

Abstract
Mycosis fungoides (MF) is the most frequent form of cutaneous T-cell lymphoma (CTCL), which can deteriorate from patch stage to dermal-based tumors and systemic involvement in years. The interaction of chemokines in the skin with CTCL cells might have implications for the pathogenesis of the disease. In this study, we show by PCR analysis and immunofluorescence staining that the chemokine CCL18 is present in skin biopsy specimens of patients with MF and its precursor form parapsoriasis en plaque but not in healthy tissue. In addition, the serum levels of CCL18 were increased threefold in MF patients compared with those in healthy controls. In skin, CCL18 was specifically expressed by CD163+ CD209+ macrophages at the invasive margin of the tumor and not expressed by mature CD208+ dendritic cells in the center of the tumor. The chemokine CCL17 was, by contrast, ubiquitously expressed. Furthermore, CCL18 promoted the chemotaxis but not the proliferation of CTCL cells. CCL18 inhibited proliferation of tumor cells and abolished the CXCL12-induced growth of a CTCL cell line. These data link the increased expression of CCL18 with CTCL and suggest an immunomodulatory effect of the chemokine in the pathogenesis of CTCL.
Mycosis fungoides (MF) is the most frequent variant of cutaneous T-cell lymphoma (CTCL) in the general population, usually arising in mid to late adulthood with a male predominance of 2:1. Typical MF deteriorates from patch and plaque stage to dermal-based tumors many years after the initial diagnosis.1 Effective immune control during the initial stages of disease might contribute to the prolonged course of disease. It is known that CTCL cells can hamper proliferation of reactive T cells and suppress maturation of dendritic cells (DCs) by secretion of a TH2-dominated cytokine profile.2 IL-10 especially down-regulates DC function and may induce tolerance of skin DCs rather than immune defense.3,4
The main characteristic of CTCL in the early stages is the trapping of the malignant T-cell clone in the skin, which can be achieved by a specific set of chemokines. Chemokines are small molecules of approximately 8 kDa that mediate cell migration and are main soluble factors of intercellular communication.5 CCL17, also known as thymus and activation regulated chemokine, has been described in CTCL skin lesions in association with the infiltration of CCR4+ tumor cells.6,7 CXCR4, the receptor of CXCL12, is also highly expressed by lesional tumor cells and seems to contribute to the accumulation of tumor cells in the skin.8
CCL18, previously also designated as DC-derived chemokine 1, pulmonary and activation–regulated chemokine, alternative macrophage activation–associated CC chemokine, or macrophage inflammatory protein 4, is a human chemokine that has no mouse equivalent and the receptor of which is not yet known. It was shown to be expressed in germinal centers of tonsils by DCs and to attract mainly T cells, CD38− mantle zone B lymphocytes, and DCs.9–11 CCL18 has been described in TH2-associated allergic or autoimmune diseases, including atopic dermatitis,11 bullous pemphigoid,12 hypersensitivity pneumonitis,13 and vernal keratoconjunctivitis.14 Regarding its implication in tumor pathogenesis, elevated serum concentrations of CCL18 have been detected in childhood acute lymphoblastic leukemia,15 and CCL18 expression was increased in patients with gastric cancer, where it was associated with prolonged overall survival.16 CCL18 expression can be induced by IL-4.11 Because the TH2 cytokine IL-4 was shown to be expressed in lesional skin of patients with both parapsoriasis en plaque (PEP) and MF,17 CTCL lesions represent a suitable environment for up-regulation of CCL18.
The study was performed to investigate the expression of CCL18 in CTCL and to elucidate its role in the different stages of MF. We found that CCL18 is up-regulated in patients with PEP and MF and expressed in lesional skin by macrophages. In MF tumor stage, these CCL18-expressing macrophages were located at the tumor invasion front. Furthermore, CCL18 reduced proliferation and abolished the CXCL12-induced proliferation of CTCL cell lines in vitro. Thereby, the data suggest a regulatory role of the chemokine CCL18 in CTCL.
Materials and Methods
Patients
Patient conditions were diagnosed by clinical and histologic investigation and staged according to current classification of the International Society of Cutaneous Lymphoma and the European Organization of Research and Treatment of Cancer.1 Informed consent was obtained from all donors in accordance with University of Dresden ethics committee guidelines. Patient characteristics are given in Table 1. PEP was diagnosed after a clinical presentation of flat, reddish brown, nonpalpable to barely palpable patches and histologic criteria demonstrating the following: an almost normal epidermis with occasional foci of parakeratosis, lymphocytes that may have migrated to the epidermis and only occasionally simulate vesicle or epidermal lymphocyte aggregations (Pautrier's microabscesses), and subepidermal infiltrate that was mild and accentuated around the subpapillary vessels (for histologic classification we followed Lever's Histopathology of the Skin18). Patients with MF had red, scaly, eczematous-like eruptions with sharply delineated margins in addition to elevated plaques. Histologically, the lesions exhibited a superficial, deep, perivascular lymphocytic infiltrate with collections of lymphocytes (Pautrier's microabscesses) within a thickened epidermis. Rarely, cells showed larger, hyperconvoluted, or cerebriform nuclei. The papillary dermis was expanded by fibrosis. Patients in MF tumor stage presented with clinically visible tumors of the skin. The histologic diagnosis was confirmed by finding neoplastic cells in the reticular dermis forming nodules or tumors. The epidermotropism was diminished.
Table 1.
Characteristics of Patients Included in the Study
| Patient no. | Age, years | Sex | Diagnosis | Stage ISCL/EORTC 2007 | T-cell receptor clonality | Ki67+ cells, % | Density grade of tumor cells |
|---|---|---|---|---|---|---|---|
| 1 | 67 | M | PEP | Monoclonal with polyclonal background | 1–2 | ||
| 2 | 67 | M | PEP | Polyclonal | 1 | ||
| 3 | 67 | M | PEP | Polyclonal | 2 | ||
| 4 | 73 | M | PEP | Polyclonal | 1 | ||
| 5 | 55 | F | MF patch/plaque | T2N0B0M0 stage IB | Monoclonal with polyclonal background | <5 | 2 |
| 6 | 68 | M | MF patch/plaque | T2N0B0M0 stage IB | Monoclonal | 30 | 2 |
| 7 | 77 | M | MF patch/plaque | T2N0B0M0 stage IB | Monoclonal | 45 | 3 |
| 8 | 62 | F | MF patch/plaque | T2N0B0M0 stage IA | Oligoclonal | 5 | 2 |
| 9 | 73 | M | MF patch/plaque | T2N0B0M0 stage IB | Monoclonal | 40 | 3–4 |
| 10 | 78 | F | MF tumor | T3N0B0M0 stage IIB | Monoclonal | 50 | 4 |
| 11 | 87 | F | MF tumor | T3NxB0M0 stage IIB | Monoclonal | 50 | 4 |
| 12 | 61 | F | MF tumor | T3NxB0M0 stage IIB | Monoclonal with polyclonal background | 50 | 4 |
| 13 | 72 | M | MF tumor | T3N0B0M0 stage IIB | Monoclonal | 40 | 4 |
| 14 | 75 | M | MF tumor | T3N0B0M0 stage IIB | Monoclonal | 40 | 3 |
ISCL/EORTC, International Society of Cutaneous Lymphoma and the European Organization of Research and Treatment of Cancer; F, female; M, male.
The density of the tumor cells in skin biopsy specimens was graded according to the scoring system of Goteri et al19: grade 1, mild, superficial, and perivascular subepidermal lymphoid infiltrate without tendency to confluence; grade 2, moderate, superficial, and perivascular infiltrate in the upper dermis showing a tendency to confluence; grade 3, bandlike lymphoid infiltrate, homogenously distributed below the dermal-epidermal junction; and grade 4, heavy burden of neoplastic T cells, diffusely extending from the superficial to the reticular dermis or into the hypodermis. The patients did not receive any systemic or topical treatment with immunosuppressive drugs for at least 4 weeks before collection of initial blood samples and skin biopsy specimens. Serum samples of 8 patients with atopic dermatitis were used as positive controls for determination of CCL18.
Cell Lines and Proliferation Analysis
The CTCL cell line Hut78, initially obtained from a patient with systemic T-cell lymphoma, was purchased from ATCC and cultured in RPMI (Biochrom AG, Berlin, Germany) and 10% fetal calf serum (Gibco, Carlsbad, CA). The cell lines Seax (derived from a patient with systemic involvement of CTCL) and MyLa (derived from CTCL) were provided by Reinhard Dummer (University Hospital of Dermatology, Zürich, Switzerland). In vitro stimulation of cells (105 cells/mL) was performed with CXCL12 (Peprotech, Rocky Hill, NJ) and CCL18 (R&D Systems, Minneapolis, MN) in a 48-well plate. The optimal concentration of CXCL12 enhancing proliferation of the CTCL cell line Hut78 was determined in previous experiments. The concentration of CCL18 was calculated from the values measured in serum. At day 4 50 μL of cell suspension were transferred to a 96-well plate and diluted 1:2 in propidium iodide solution (1 μg/mL) for determination of dead cells. Cell numbers were measured by a MACSQuant Analyzer (Miltenyi Biotec, Bergisch Gladbach, Germany) and analyzed using MACSQuantify software (Miltenyi Biotec) in consideration of the dilution factor.
ELISA
The CCL18 serum levels were determined using Duoset enzyme-linked immunosorbent assay (ELISA) (R&D Systems) according to the manufacturer's instructions. Avidin-linked alkaline phosphatase was purchased from Sigma (Traufkirchen, Germany).
Real-Time Quantitative PCR Analysis for Chemokine Expression
The mRNA from skin samples was extracted using a Peq Gold RNAPure (30–1020) kit (PeqLab Biotechnologie GmbH, Erlangen, Germany) according to manufacturer's instructions. RNA was cleaned using an RNA Cleanup Kit-5 (R1023; Zymo Research, Orange, CA) and reverse transcribed with oligo dT and random hexamer primers using an iScript cDNA Synthesis Kit (170–8891; Bio-Rad Lab, München, Germany). Primers were designed with MWG software and custom ordered from MWG Biotech AG (Ebersberg, Germany) according to the following sequences: CCL2, forward: 5′-AGCAGCAAGTGTCCCAAAG-3′, reverse: 5′-TTGGGTTGTGGAGTGAGTG-3′; CCL17, forward: 5′-TCCCCTTAGAAAGCTGAAGAC-3′, reverse: 5′-ACTGCATTCTTCACTCTCTTG-3′; CCL18, forward: 5′-TCTATACCTCCTGGCAGATTC-3′, reverse: 5′-TTTCTGGACCCACTTCTTATTG-3′; CCL19, forward: 5′-TAGAACGCATCATCCAGAGAC-3′, reverse: 5′-ATTCACAATGCTTGACTCGGAC-3′; CCL21, forward: 5′-CTTGAAGGAGAATCATCAGGA C-3′, reverse: 5′-TTGGGTGGGAAGACAGAAC-3′; CCL22, forward: 5′-TTGGAGGAGGCCATTTCAC-3′, reverse: 5′-CACTCCCCACACTTTCAAC-3′; hypoxanthine phosphoribosyltransferase (HPRT), forward: 5′-GGTCAGGCAGTATAATCCAAAG-3′, reverse: 5′-GTCAAGGGCATATCCTACAAC-3′.
The PCR was performed in 25-μL reaction volumes containing 8 ng/10 μL of diluted cDNA, 13 μL of iQ SYBR Green Supermix containing TAQ polymerase (170–8882; Bio-Rad Lab), 1 μL of 2.5-nmol/L forward primer, and 1 μL of 2.5-nmol/L reverse primer. The profile at the iCycler (Bio-Rad Lab) was amplified as follows: 50°C for 2 minutes and 95°C for 2 minutes, 45 cycles of 95°C for 15 seconds, annealing temperature of 60°C for 45 seconds, and extension for 1 minute at 95°C with one final cycle of extension at 55°C for 1 minute. The melting point analysis was performed in 80 cycles with 5°C steps starting from 50°C for each time of 10 seconds.
The CT values of each chemokine were determined from triplicate reactions and expressed as the percentage of HPRT using the ΔCT method based on threshold cycle differences.
Analysis of T-Cell Receptor γ Gene Rearrangements
Genomic DNA was extracted from freshly frozen and paraffin-embedded skin tissue from patients with PEP and MF using the QIAamp DNA FFPE Tissue Kit (Qiagen, Hilden, Germany) according to the manufacturer's instructions. The PCR reactions were performed with the IdentiClone TCRG Gene Clonality Assay for Gel Detection (InVivoScribe Technologies, San Diego, CA). One or two dominant bands within the valid size range and distinct from any background smear were reported as monoclonal.
Immunofluorescence Staining
Acetone-fixed, 5-μm-thick cryostat sections were stained with primary antibodies and corresponding secondary antibodies followed by avidin-conjugated alkaline phosphatase and naphthol-AS phosphate/Fast Red TR substrate (Sigma, Munich, Germany). For immunofluorescence analysis, cryostat sections were stained with primary and secondary antibodies. The monoclonal antibodies used in the study and their sources are shown in Table 2. All stainings were controlled by isotype stainings for each antibody. The slides were mounted with DAPI-containing medium (Vector Labs, Burlingame, CA), coverslipped, and analyzed with a Zeiss Axioimager A1 microscope (Zeiss, Jena, Germany). For each, at least three patients were analyzed. Pictures show representative stainings. If not otherwise indicated, the original magnification was ×200.
Table 2.
Antibodies Used for Immunofluorescence Staining of Skin Sections
| Antigen | Clone | Isotype | Label | Source |
|---|---|---|---|---|
| Primary Antibodies | ||||
| CCL18 | Polyclonal | Goat IgG | Unlabeled | R&D Systems |
| CD1a | Polyclonal | Rabbit IgG | Unlabeled | Atlas Antibodies |
| CCL17 | Polyclonal | Rabbit IgG | Unlabeled | Peprotech |
| CD1a | O10 | mIgG1 | Unlabeled | DakoCytomation |
| CD1c | M241 | mIgG1, k | Biotin | Ancell |
| CD3 | F7.2.38 | mIgG1 | Unlabeled | DakoCytomation |
| CD208 | 104.G4 | mIgG1 | Unlabeled | Immunotech |
| CD11c | EP1347Y | Rabbit IgG | Unlabeled | abcam |
| CD209 | 1B10 | mIgG2a | Unlabeled | Santa Cruz |
| Ki67 | K-2 | mIgG1 | Unlabeled | Zytomed Systems |
| CD163 | 10D6 | mIgG1 | Unlabeled | Novocastra |
| Isotype Antibodies | ||||
| Mouse IgG1 | Unlabeled | BD | ||
| Goat immunoglobulin | Unlabeled | Santa Cruz | ||
| Rabbit IgG | Unlabeled | Abcam | ||
| Secondary Reagents | ||||
| Donkey anti-goat IgG (H+L) | Alexa Fluor 488 | Molecular Probes | ||
| Goat F(a,b)2 anti-rabbit IgG | Alexa Fluor 546 | Molecular Probes | ||
| Goat F(a,b)2 anti-rabbit IgG | Alexa Fluor 488 | Molecular Probes | ||
| Goat F(a,b)2 anti-mouse IgG | Alexa Fluor 546 | Invitrogen (Caltag) | ||
| Goat F(ab')2 anti-mouse IgG | Alexa Fluor 488 | Molecular Probes | ||
| Goat F(ab')2 anti-mouse IgG2a | Alexa Fluor 488 | Molecular Probes | ||
| Goat F(ab')2 anti-mouse IgG | Unlabeled | Abcam | ||
| Avidin | TXRD | Vector |
Chemotaxis Assay
Chemotaxis of the CTCL cell lines was investigated according to the following procedure: chemokines (R&D Systems) dissolved in medium (RPMI 1640 with 0.5% bovine serum albumin) or medium as control alone were added in 150 μL to the lower wells of a 96-well chemotaxis chamber (Millipore, Billerica, MA). A total of 70 μL of cell suspension (7.2 × 10⁶ cells/mL) was seeded into the upper transwell inserts equipped with a 8-μm pore filter. After 3 hours of incubation at 37°C, transwells were removed and the number of transmigrated cell suspensions was counted by means of a FACSCalibur (BD Biosciences, Heidelberg, Germany) using BD CELLQuest Software. At least quadruplicates were performed for each condition. The chemotactic index was calculated by dividing the number of migrated cells induced by chemokine by the mean number of cells recruited by medium alone (migration to medium alone had a chemotactic index of 1).
Statistical Analysis
Data are presented as bars (indicating mean ± SD or SEM) or box plots [indicating mean (quadrat), median (line), 25% to 75% percentiles (box), and SD (whisker)]. The statistical analysis was performed using Student's t-test with the help of Origin 7.0 software (OriginLab Co., Northampton, MA). Correlation was tested by Spearman's rank correlation test. In all cases, P < 0.05 was considered significant.
Results
Serum Levels of CCL18 Are Increased in Patients with MF
We compared the concentration of CCL18 in serum samples of MF patients and healthy controls. MF patients showed three times higher (P = 0.00005) concentrations of CCL18 in serum (59 ± 17 ng/mL) than healthy individuals (18 ± 4.4 ng/mL; Figure 1). The CCL18 levels in patients at MF patch stage (51 ± 9.2 ng/mL) compared with patients at MF tumor stage (63 ± 21 ng/mL) were not significantly different. The CCL18 levels in serum samples of MF patients almost reached the levels found in patients with atopic dermatitis (78 ± 30 ng/mL, P = 0.001 compared with healthy individuals). In 2 patients with PEP, which is believed to be the precursor form of MF, CCL18 levels in serum samples were 100 ng/mL and thus highly increased compared with healthy controls and MF patients. Similar high levels of CCL18 were only detected during disease course in patient 5 (Table 1), who progressed from PEP to MF patch stage and later complete remission under therapy psoralen–UV-A irradiation. In addition, patient 13 (Table 1) reached complete remission after treatment with interferon alfa. In both patients, the concentration of CCL18 in serum decreased by 20% after regression of the disease. However, the concentrations were still elevated compared with the mean CCL18 concentration in serum samples of healthy individuals (50 and 54 ng/mL versus 18 ± 4.4 ng/mL).
Figure 1.
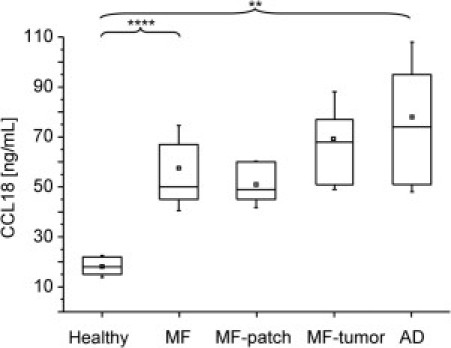
CCL18 is increased in the serum of MF patients. The concentration of CCL18 in serum samples of 6 healthy controls, 8 atopic dermatitis (AD) patients, and 10 MF patients (5 in MF patch or plaque stage and 5 in MF tumor stage) were determined by ELISA. In MF patients, CCL18 concentrations (mean ± SD, 59 ± 17 ng/mL) were significantly three times higher compared with their healthy counterparts (18 ± 4.4 ng/mL; ***P = 0.00005). The differences between patients in MF patch or plaque stage (51 ± 9.2 ng/mL) and MF tumor stage (68 ± 19 ng/mL) were not significant. For positive control, AD patients were tested and had significantly higher levels (78 ± 30 ng/mL, **P = 0.001) compared with healthy controls. Values were not significantly different than those of MF patients.
CCL18 mRNA Is Expressed in Lesional MF Skin
The elevated concentrations of CCL18 in serum samples of MF patients prompted us to investigate the expression of CCL18 in the skin. First, biopsy specimens from lesional tissue were analyzed by real-time quantitative RT-PCR for expression of CCL18 mRNA (Figure 2A). In patients with PEP and MF patch or plaque lesions, mRNA levels of CCL18 were not significantly elevated compared with those with healthy skin. However, in biopsy specimens from MF tumor lesions, mRNA levels of CCL18 were significantly increased by 18% compared with healthy counterparts. The concentration of CCL17 mRNA showed a significant increase in PEP (16%) and tumor lesions (17%) compared with healthy counterparts, whereas the other chemokines tested were not significantly regulated in MF lesional skin (Figure 2A). CCL18 mRNA expression correlated with the lesional expression of the proliferation marker Ki-67 among tumor cells in patients with MF (Figure 2B; P = 0.007). However, CCL18 did not correlate with the density of the cellular infiltrate graded by the score from Goteri et al19 in MF and PEP lesions (Figure 2C). The latter was not changed when only values from MF patients or only MF tumor lesions were correlated.
Figure 2.
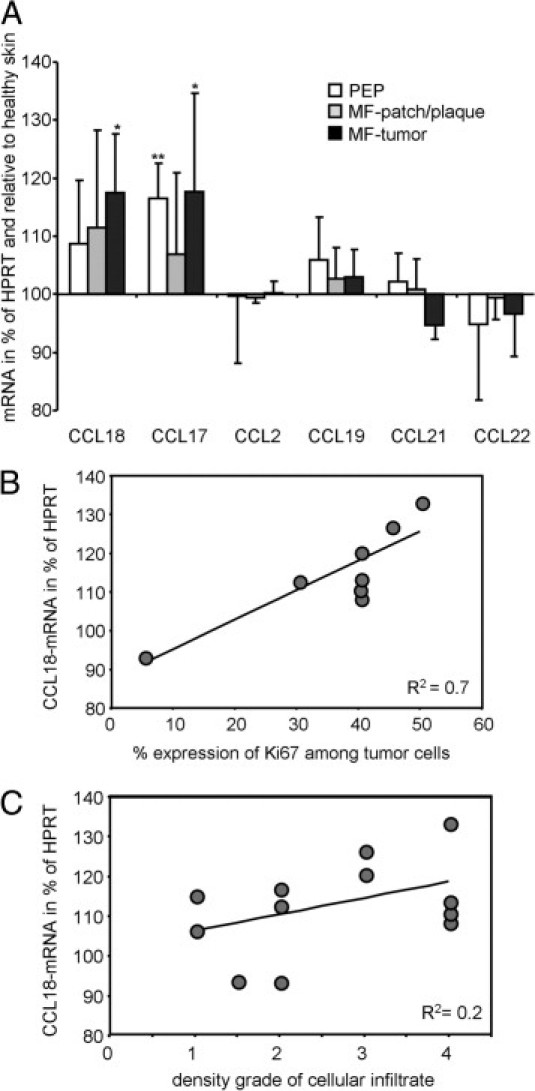
CCL18 mRNA is up-regulated in MF skin and correlated with expression of the proliferation marker Ki-67 in CTCL. A: Real-time quantitative PCR analysis of chemokine expression in healthy skin (n = 7), lesional skin from patients with PEP (n = 4), skin from patients in MF patch or plaque stage (n = 3), and MF tumor lesions (n = 5) was performed. Values were normalized to the housekeeping gene HPRT, and expression levels of the chemokines are given as the percentage of the mean expression in healthy skin. Bars represent mean ± SD. The P value was determined between the values of diseased and healthy skin by Student's t-test. *P < 0.05, **P < 0.005. B: Concentration of CCL18 mRNA correlated with the expression rate of the proliferation marker Ki-67 in MF patch and MF tumor lesions (P = 0.007). C: Concentration of CCL18 mRNA did not correlate with the density of the cellular infiltrate in PEP, MF patch, and MF tumor lesions (P = 0.14). R2 indicates coefficient of determination, with 1 indicating complete correlation and 0 indicating no correlation; significance was tested by Spearman's rank correlation.
CCL18 Protein Is Expressed in MF Skin
To test whether the up-regulation of CCL18 mRNA expression is accompanied by protein expression, immunofluorescence staining of CCL18 in lesional skin was performed (Figure 3A). CCL18 was not detected in healthy skin but up-regulated in MF patch or plaque and MF tumor lesions. When tumor cells were labeled with CD4, CCL18 staining predominately appeared around the tumor cell accumulation and along the invasive margin of the tumor (tumor-stroma interface; Figure 3A). Notably, the characteristic Pautrier's microabscesses (epidermal tumor cell aggregations) contained CCL18-expressing cells close to the tumor cells (Figure 3B). In contrast to CCL18, CCL17 was expressed in both locations: mainly between the tumor cells and in the dermal tissue around the tumor (Figure 3C). In PEP we detected only weak lesional expression of CCL18 (Figure 3D).
Figure 3.
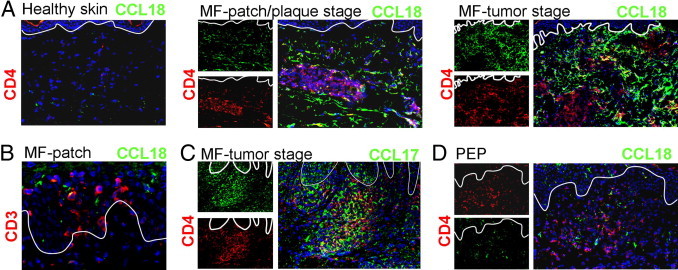
CCL18 is expressed in lesional MF skin. A: Immunofluorescence staining revealed that CCL18 protein (green) was significantly expressed in lesional skin of MF patch or plaque and MF tumor stage but not in healthy skin. CCL18 was predominately expressed at the invasive margin of the CD4+ (red) cellular tumor infiltrate (tumor-stroma interface). B: CCL18 (green) can be expressed in the epidermis close to Pautrier's microabscesses indicated by CD3 (red) staining in the epidermis (original magnification, ×400). C: CCL17 (green) was expressed amid tumor cells (CD4, red) and the dermal area around tumor cells. D: Immunofluorescence staining also detected CCL18 in PEP lesions.
CCL18 Is Mainly Expressed by CD209+ Macrophages in MF Lesional Skin
To investigate which cells secret CCL18 in MF lesions, a three-color immunofluorescence staining was performed on MF lesional skin. In PEP, in MF patch or plaque and in MF tumor stage, we observed that CCL18 was mainly expressed by CD209+ cells (Figure 4A). CD209, also designated DC-SIGN, is a C-type lectin receptor present on both macrophages and DCs.20,21 In tumor stage MF, CD209+ cells were preferentially located around the tumors, thus colocalizing with CCL18 (Figure 4A). Additional stainings revealed that most CD209+ cells co-expressed CD163 (Figure 4B), a surface marker of cutaneous macrophages.20 Double immunofluorescence staining of CCL18 and CD163 demonstrated a strong colocalization around the tumor cells, whereas the CD163+ macrophages amid tumor cells did not express CCL18 (Figure 4B), indicating that CD209+ CD163+ macrophages in the tumor invasion front are the main producers of CCL18. The total number of CD209+ cells in the dermis was 2.5-fold increased in MF patch or plaque and MF tumor lesions compared with healthy skin (Figure 4C). The number of CD163+ macrophages increased nearly fivefold when MF tumor lesions were compared with healthy skin. This increase was the highest among the other DC and macrophage markers investigated (Figure 4C).
Figure 4.
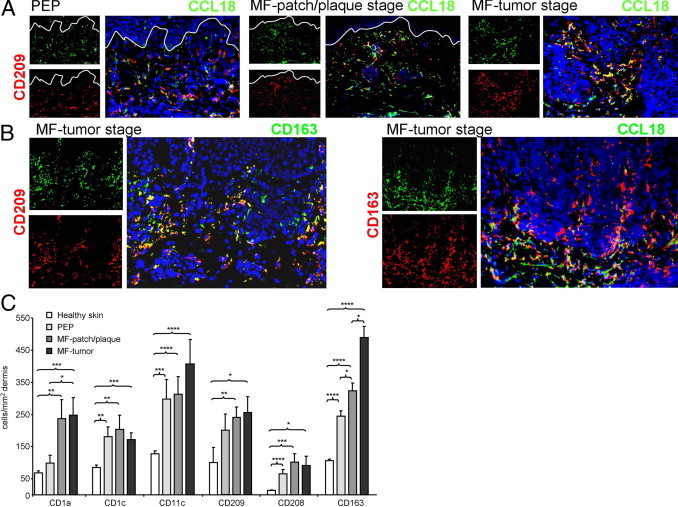
Macrophages are increased in MF lesions and represent the main CCL18+ lesional cell population. A: CCL18 was mainly co-expressed with CD209 in PEP and MF lesions. B: Double immunofluorescence staining demonstrated that most CD209-expressing cells are CD163+ macrophages. These CD163+ cells, when located at the tumor margin, were strongly positive for CCL18. C: Macrophage and DC markers are increased in PEP and MF skin. For calculation of the numbers of macrophages and DCs, three sections of each biopsy specimen from 3 healthy controls, 4 patients with PEP, 5 patients with MF patch or plaque stage, and 5 patients with MF tumor stage were stained with the respective antibodies; pictures were taken and the number of positive cells was manually counted. The dermal area was determined and the number (mean ± SEM) given in cells per square millimeters. (*P < 0.05, **P < 0.005, ***P < 0.0005, and ****P < 0.00005, Student’s t-test).
CCL18 Is Rarely Expressed by DCs in MF
We further performed double immunofluorescence stainings of CCL18 with the DC markers CD1c, CD1a, or CD11c to investigate the expression of CCL18 by lesional DCs. Only a few CD1c+ DCs coexpressed CCL18 in PEP, MF patch or plaque, or MF tumor lesions (Figure 5A). These CD1c+ DCs only occasionally co-expressed CD209 in MF lesions, a marker initially described on immature DCs21 (Figure 5B). Mature, CD208/DC-lamp+ DCs were predominantly located amid tumor cells and did not co-express CCL18 (Figure 5A). These mature, CD208+ DCs clearly co-expressed CD1a+ in MF patch and MF tumor lesions (Figure 5B). Dermal CD1a+ cells appear to be CD1c+ in healthy and inflamed human skin (Zaba et al22 and own, unpublished observation).
Figure 5.
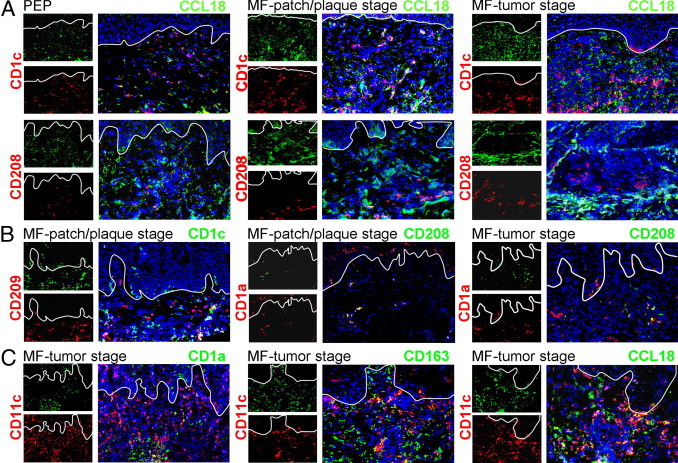
Mature DCs do not significantly express CCL18. A: Immunofluorescence staining was performed on lesional sections for the markers indicated. Occasionally, CD1c+ DCs expressed CCL18 in PEP and MF patch or plaque or MF tumor stage. CD208+ cells did not co-express CCL18. B: CD209 was only occasionally co-expressed with CD1c in MF lesional skin. CD208 was mainly co-expressed by CD1a+ DCs in MF patch or plaque and MF tumor lesions. C: CD11c was expressed by CD1a+ cells in the tumor center. Some CD163+ macrophages also co-expressed CD11c. CD11c+ cells predominately located at the tumor invasion front were co-stained with CCL18.
CD11c is frequently expressed by dermal DCs,22 and we found that its expression was strongly increased in MF lesional skin (Figure 4C). However, CD11c was not only expressed by CD1a+ DCs but also on macrophages in MF skin, as indicated by co-expression of CD11c and CD163 in MF tumor stage (Figure 5C). CCL18 was occasionally expressed by CD11c+ cells in MF lesions (Figure 5C). These CD11c+ cells were located around the tumor and therefore are very probably macrophages.
Functional Impact of CCL18 on CTCL Cell Lines
The increase of CCL18 in serum samples of PEP and MF patients and its expression by macrophages in the tumor invasion front indicated that this chemokine might be involved in tumor defense. Therefore, we aimed to investigate the effect of CCL18 on migration, proliferation, and viability of human CTCL cells. As model cell lines, we choose the human CTCL cell lines Hut78, SeAx, and MyLa. The cell lines responded to CCL18 in an in vitro chemotaxis assay, but the response was weak compared with CXCL12, a chemokine abundantly expressed in CTCL skin lesions23 (Figure 6A). Therefore, induction of tumor cell migration might not be a main function of CCL18 in CTCL. Next we investigated the impact of CCL18 on the proliferation of the CTCL cell lines and investigated the effect of CCL18 on the CXCL12-induced proliferation described for other human lymphoma cells.24 We found that incubation of the CTCL cell line Hut78 with CCL18 alone for 3 days had no effect on tumor cell proliferation and viability (Figure 6B). However, CXCL12 significantly enhanced the in vitro proliferation of the CTCL cell line by 27% (Figure 6B). This increase might be a real CXCL12-mediated induction of proliferation rather than a chemokine-mediated increase in viability of the cells (2% change in viability by CXCL12; Figure 6B). When the CTCL cell line was co-incubated with CXCL12 in the presence of CCL18, CCL18 significantly abolished the CXCL12-induced proliferation of the CTCL cell line (Figure 6B). A minor part of this effect was attributed to a decrease in viability of the cell line after addition of CXCL12 and CCL18 (3% decrease in viability; Figure 6B). Investigating the effect of CCL18 on the CTCL cell line SeAx demonstrated an inhibitory effect of the chemokines CCL18 (18%) and CXCL12 (16%) on the proliferation of the cell line (Figure 6C). If both chemokines were co-incubated with the cell line, proliferation was decreased by 24%, which could in part be explained by the reduced viability of SeAx under this condition (9%; Figure 6C). The overall proliferation and viability of the cell line MyLa were not changed by the chemokines in vitro (Figure 6D). However, CCL18 had a small inhibitory effect on the proliferation of the cell line (3%, Figure 6D). In summary, our investigation on the impact of CCL18 on the cell growth of human CTCL cell lines demonstrated that CCL18 did not induce proliferation in all three CTCL cell lines. CCL18 rather abolished the CXCL12-induced proliferation in the cell line Hut78 and inhibited proliferation of the human CTCL cell lines SeAx and MyLa.
Figure 6.
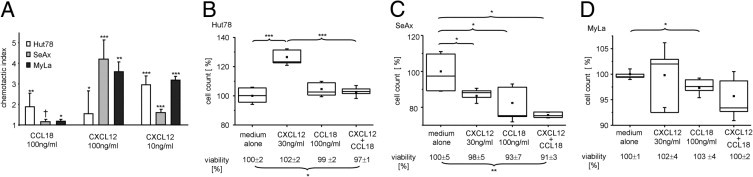
CCL18 induced weak migration of CTCL cell lines and had an inhibitory effect on human CTCL cell proliferation. A: Chemokine-induced migration of the CTCL cell lines Hut78, SeAx, and MyLa was measured in a chemotaxis chamber. Bars indicate mean ± SD; one representative of three experiments performed is shown. The investigated CTCL cell lines show a significant chemotactic index (*P < 0.05, **P < 0.005, ***P < 0.0005, Student's t-test) in comparison with the medium alone (†P = 0.05, Student's t-test). B–D: The human CTCL cell lines Hut78 (B), SeAx (C), and MyLa (D) were stimulated by addition of CXCL12 (30 ng/mL) or CCL18 (100 ng/mL; n = 6 for each condition). The mean number of live CTCL cells cultured in medium alone was set to 100% and the other values calculated as the percentage of this baseline. The viability of the cells was determined by measuring the percentage of propidium iodide–negative cells among all cells. The mean value of cells cultured in medium alone was set to 100% and the other values calculated as the percentage of this baseline. They are given below each condition. CCL18 abolished the CXCL12-induced proliferation of Hut78 (B) and inhibited proliferation of SeAx (C) and MyLa (D). *P < 0.05, **P < 0.005, and ***P < 0.0005, Student’s t-test. One representative of five experiments performed is shown.
Discussion
We describe the up-regulation of CCL18 in MF and the CCL18-mediated cross-talk between macrophages and tumor cells in CTCL. Specifically, we show increased CCL18 mRNA levels and CCL18 expression in skin and serum of patients with MF and PEP compared with healthy individuals. CCL18 was expressed in MF patch or plaque and MF tumor lesions mainly by CD209+ CD163+ macrophages. These CCL18-expressing cells were located in the tumor invasion front. Importantly, CCL18 did not induce proliferation of human CTCL cells in vitro but rather inhibited their proliferation or abolished their CXCL12-induced growth. Together, these data implicated an immunomodulatory effect of CCL18 in CTCL.
Interestingly, the inhibitory effect of CCL18 was seen not only in CTCL but also in a human pre-B acute lymphoblastic leukemia cell line.24 The authors suggested that this effect was mediated by binding of CCL18 to GPR30- and GPR30-mediated modulation of CXCR4-dependent responses. An inhibitory function of CCL18 on other chemokine receptors has also been described by interaction of CCL18 with CCR3.25 Expression of CCR3 and its ligands CCL11 and CCL26 has been reported in CTCL.26,27 In addition to CTCL, CCL18 up-regulation has been described in B-cell leukemia15 and in gastric and ovarian cancer.16,28
The expression of CCL18 by CD68+ macrophages in the tumor invasion front was first described in gastric cancer.16 In a group of 59 patients, those expressing high serum levels of CCL18 had a better prognosis, leading the authors to conclude that CCL18 levels were a prognostic factor for predicting overall and disease-free survival.16 Unfortunately, the small number of patients in our study did not allow a statistical evaluation of CCL18 expression levels and prognosis in MF tumor patients.
In the study from Leung et al16 and in our investigations in MF, CCL18 was preferentially expressed by macrophages. These were defined by expression of CD163 and co-expressed CD209. CD209, which is also known as DC-SIGN, is a C-type lectin, binding to glycoproteins and glycolipids, and initially has been described on immature DCs.21 Later, it was recognized as a marker of cutaneous CD163+ and CD68+ macrophages.20 The positioning of macrophages in the cutaneous tumor invasion front is not specific for CTCL in the skin because the peritumoral localization of CD209+ macrophages has also been described in cutaneous melanoma.29 The expression of CD209 has been shown to facilitate recognition of tumor antigens in colorectal cancer30 and acute lymphoblastic leukemia T cells.31
The up-regulation of CCL18 in MF was accompanied by increased expression of CCL17 mRNA in our MF patients. In contrast to CCL18, the chemokine CCL17 was mainly expressed between the tumor lesions. The main function of CCL17 in MF could be to retain lymphoma cells in the skin. Malignant cells in MF express CCR4 and CXCR4.6,8 In tumor stage MF, CCR4 is down-regulated and expression of CCR7 is induced on CTCL cells.32 The ligands of CCR7, CCL21, and CCL19 were not up-regulated in MF and therefore cannot hold tumor cells inside the skin. Their known expression in lymphoid tissue might instead contribute to progression of MF in late-stage tumor disease and mediate lymphoid spreading of CTCL cells.32
In summary, our data can be integrated in the current model of chemokine-mediated interactions in CTCL. It is anticipated that CTCL, especially MF, develops by trapping of malignant T-cell clones in the skin. Depending on the subtype of CTCL and the stage of the disease, these malignant T cells can express the chemokine receptors CXCR4, CCR4, CCR10, and CCR3.6,33 The respective ligands CXCL12,23 CCL17,7 CCL27,34 CCL11,26 and CCL2627 have been described in CTCL lesional skin and can mediate maintenance of the malignant cells in the skin. Expression of CCL18 by macrophages in PEP, MF patch or plaque stage, and the tumor invasion front of MF lesions might mediate an inhibitory function by abrogating the proliferative effect of other chemokines in CTCL. These findings broaden our understanding on the immune control in PEP and MF lesions and demonstrate a new link between CCL18 expression and human CTCL.
Acknowledgments
We thank Tilo Biedermann for helpful discussion of the manuscript and Claudia Schönfeld for assistance in performing parts of the experiments.
Footnotes
Supported by a MEDDRIVE and a habilitation grant of the Medical Faculty of the Technical University of Dresden (C.G.).
References
- 1.Stadler R., Assaf C., Klemke C.D., Nashan D., Weichenthal M., Dummer R., Sterry W. Short German guidelines: cutaneous lymphomas. J Dtsch Dermatol Ges. 2008;6(Suppl 1):S25–S31. doi: 10.1111/j.1610-0387.2008.06710.x. [DOI] [PubMed] [Google Scholar]
- 2.Thumann P., Luftl M., Moc I., Bagot M., Bensussan A., Schuler G., Jenne L. Interaction of cutaneous lymphoma cells with reactive T cells and dendritic cells: implications for dendritic cell-based immunotherapy. Br J Dermatol. 2003;149:1128–1142. doi: 10.1111/j.1365-2133.2003.05674.x. [DOI] [PubMed] [Google Scholar]
- 3.Luftl M., Feng A., Licha E., Schuler G. Dendritic cells and apoptosis in mycosis fungoides. Br J Dermatol. 2002;147:1171–1179. doi: 10.1046/j.1365-2133.2002.04994.x. [DOI] [PubMed] [Google Scholar]
- 4.Papadavid E., Economidou J., Psarra A., Kapsimali V., Mantzana V., Antoniou C., Limas K., Stratigos A., Stavrianeas N., Avgerinou G., Katsambas A. The relevance of peripheral blood T-helper 1 and 2 cytokine pattern in the evaluation of patients with mycosis fungoides and Sezary syndrome. Br J Dermatol. 2003;148:709–718. doi: 10.1046/j.1365-2133.2003.05224.x. [DOI] [PubMed] [Google Scholar]
- 5.Rot A., von Andrian U.H. Chemokines in innate and adaptive host defense: basic chemokinese grammar for immune cells. Annu Rev Immunol. 2004;22:891–928. doi: 10.1146/annurev.immunol.22.012703.104543. [DOI] [PubMed] [Google Scholar]
- 6.Ferenczi K., Fuhlbrigge R.C., Pinkus J., Pinkus G.S., Kupper T.S. Increased CCR4 expression in cutaneous T cell lymphoma. J Invest Dermatol. 2002;119:1405–1410. doi: 10.1046/j.1523-1747.2002.19610.x. [DOI] [PubMed] [Google Scholar]
- 7.Kakinuma T., Sugaya M., Nakamura K., Kaneko F., Wakugawa M., Matsushima K., Tamaki K. Thymus and activation-regulated chemokine (TARC/CCL17) in mycosis fungoides: serum TARC levels reflect the disease activity of mycosis fungoides. J Am Acad Dermatol. 2003;48:23–30. doi: 10.1067/mjd.2003.132. [DOI] [PubMed] [Google Scholar]
- 8.Kallinich T., Muche J.M., Qin S., Sterry W., Audring H., Kroczek R.A. Chemokine receptor expression on neoplastic and reactive T cells in the skin at different stages of mycosis fungoides. J Invest Dermatol. 2003;121:1045–1052. doi: 10.1046/j.1523-1747.2003.12555.x. [DOI] [PubMed] [Google Scholar]
- 9.Adema G.J., Hartgers F., Verstraten R., de Vries E., Marland G., Menon S., Foster J., Xu Y., Nooyen P., McClanahan T., Bacon K.B., Figdor C.G. A dendritic-cell-derived C-C chemokine that preferentially attracts naive T cells. Nature. 1997;387:713–717. doi: 10.1038/42716. [DOI] [PubMed] [Google Scholar]
- 10.Lindhout E., Vissers J.L., Hartgers F.C., Huijbens R.J., Scharenborg N.M., Figdor C.G., Adema G.J. The dendritic cell-specific CC-chemokine DC-CK1 is expressed by germinal center dendritic cells and attracts CD38-negative mantle zone B lymphocytes. J Immunol. 2001;166:3284–3289. doi: 10.4049/jimmunol.166.5.3284. [DOI] [PubMed] [Google Scholar]
- 11.Gunther C., Bello-Fernandez C., Kopp T., Kund J., Carballido-Perrig N., Hinteregger S., Fassl S., Schwarzler C., Lametschwandtner G., Stingl G., Biedermann T., Carballido J.M. CCL18 is expressed in atopic dermatitis and mediates skin homing of human memory T cells. J Immunol. 2005;174:1723–1728. doi: 10.4049/jimmunol.174.3.1723. [DOI] [PubMed] [Google Scholar]
- 12.Gunther C., Carballido-Perrig N., Kopp T., Carballido J.M., Pfeiffer C. CCL18 is expressed in patients with bullous pemphigoid and parallels disease course. Br J Dermatol. 2009;160:747–755. doi: 10.1111/j.1365-2133.2008.08979.x. [DOI] [PubMed] [Google Scholar]
- 13.Pardo A., Smith K.M., Abrams J., Coffman R., Bustos M., McClanahan T.K., Grein J., Murphy E.E., Zlotnik A., Selman M. CCL18/DC-CK-1/PARC up-regulation in hypersensitivity pneumonitis. J Leukoc Biol. 2001;70:610–616. [PubMed] [Google Scholar]
- 14.El Asrar A.M., Struyf S., Al Kharashi S.A., Missotten L., Van Damme J., Geboes K. Expression of T lymphocyte chemoattractants and activation markers in vernal keratoconjunctivitis. Br J Ophthalmol. 2002;86:1175–1180. doi: 10.1136/bjo.86.10.1175. [DOI] [PMC free article] [PubMed] [Google Scholar]
- 15.Struyf S., Schutyser E., Gouwy M., Gijsbers K., Proost P., Benoit Y., Opdenakker G., Van Damme J., Laureys G. PARC/CCL18 is a plasma CC chemokine with increased levels in childhood acute lymphoblastic leukemia. Am J Pathol. 2003;163:2065–2075. doi: 10.1016/S0002-9440(10)63564-X. [DOI] [PMC free article] [PubMed] [Google Scholar]
- 16.Leung S.Y., Yuen S.T., Chu K.M., Mathy J.A., Li R., Chan A.S., Law S., Wong J., Chen X., So S. Expression profiling identifies chemokine (C-C motif) ligand 18 as an independent prognostic indicator in gastric cancer. Gastroenterology. 2004;127:457–469. doi: 10.1053/j.gastro.2004.05.031. [DOI] [PubMed] [Google Scholar]
- 17.Vowels B.R., Lessin S.R., Cassin M., Jaworsky C., Benoit B., Wolfe J.T., Rook A.H. Th2 cytokine mRNA expression in skin in cutaneous T-cell lymphoma. J Invest Dermatol. 1994;103:669–673. doi: 10.1111/1523-1747.ep12398454. [DOI] [PubMed] [Google Scholar]
- 18.Elder D.E., Johnson B., Jr, Elenitsas R. Lippincott-Raven; Philadelphia: 1997. Lever‘s Histopathology of the Skin. [Google Scholar]
- 19.Goteri G., Filosa A., Mannello B., Stramazzotti D., Rupoli S., Leoni P., Fabris G. Density of neoplastic lymphoid infiltrate: CD8+ T cells, and CD1a+ dendritic cells in mycosis fungoides. J Clin Pathol. 2003;56:453–458. doi: 10.1136/jcp.56.6.453. [DOI] [PMC free article] [PubMed] [Google Scholar]
- 20.Ochoa M.T., Loncaric A., Krutzik S.R., Becker T.C., Modlin R.L. “Dermal dendritic cells” comprise two distinct populations: cD1+ dendritic cells and CD209+ macrophages. J Invest Dermatol. 2008;128:2225–2231. doi: 10.1038/jid.2008.56. [DOI] [PMC free article] [PubMed] [Google Scholar]
- 21.Geijtenbeek T.B., Torensma R., van Vliet S.J., van Duijnhoven G.C., Adema G.J., van K.Y., Figdor C.G. Identification of DC-SIGN, a novel dendritic cell-specific ICAM-3 receptor that supports primary immune responses. Cell. 2000;100:575–585. doi: 10.1016/s0092-8674(00)80693-5. [DOI] [PubMed] [Google Scholar]
- 22.Zaba L.C., Krueger J.G., Lowes M.A. Resident and “inflammatory” dendritic cells in human skin. J Invest Dermatol. 2009;129:302–308. doi: 10.1038/jid.2008.225. [DOI] [PMC free article] [PubMed] [Google Scholar]
- 23.Narducci M.G., Scala E., Bresin A., Caprini E., Picchio M.C., Remotti D., Ragone G., Nasorri F., Frontani M., Arcelli D., Volinia S., Lombardo G.A., Baliva G., Napolitano M., Russo G. Skin homing of Sezary cells involves SDF-1-CXCR4 signaling and down-regulation of CD26/dipeptidylpeptidase IV. Blood. 2006;107:1108–1115. doi: 10.1182/blood-2005-04-1492. [DOI] [PubMed] [Google Scholar]
- 24.Catusse J., Wollner S., Leick M., Schrottner P., Schraufstatter I., Burger M. Attenuation of CXCR4 responses by CCL18 in acute lymphocytic leukemia B cells. J Cell Physiol. 2010;225:792–800. doi: 10.1002/jcp.22284. [DOI] [PubMed] [Google Scholar]
- 25.Nibbs R.J., Salcedo T.W., Campbell J.D., Yao X.T., Li Y., Nardelli B., Olsen H.S., Morris T.S., Proudfoot A.E., Patel V.P., Graham G.J. C-C chemokine receptor 3 antagonism by the beta-chemokine macrophage inflammatory protein 4, a property strongly enhanced by an amino-terminal alanine-methionine swap. J Immunol. 2000;164:1488–1497. doi: 10.4049/jimmunol.164.3.1488. [DOI] [PubMed] [Google Scholar]
- 26.Kleinhans M., Tun-Kyi A., Gilliet M., Kadin M.E., Dummer R., Burg G., Nestle F.O. Functional expression of the eotaxin receptor CCR3 in CD30+ cutaneous T-cell lymphoma. Blood. 2003;101:1487–1493. doi: 10.1182/blood-2002-02-0475. [DOI] [PubMed] [Google Scholar]
- 27.Miyagaki T., Sugaya M., Fujita H., Ohmatsu H., Kakinuma T., Kadono T., Tamaki K., Sato S. Eotaxins and CCR3 interaction regulates the Th2 environment of cutaneous T-cell lymphoma. J Invest Dermatol. 2010;130:2304–2311. doi: 10.1038/jid.2010.128. [DOI] [PubMed] [Google Scholar]
- 28.Schutyser E., Struyf S., Proost P., Opdenakker G., Laureys G., Verhasselt B., Peperstraete L., Saccani A., Allavena P., Mantovani A., Van Damme J. Identification of biologically active chemokine isoforms from ascitic fluid and elevated levels of CCL18/pulmonary and activation-regulated chemokine in ovarian carcinoma. J Biol Chem. 2002;277:24584–24593. doi: 10.1074/jbc.M112275200. Van dP, I. [DOI] [PubMed] [Google Scholar]
- 29.Vermi W., Bonecchi R., Facchetti F., Bianchi D., Sozzani S., Festa S., Berenzi A., Cella M., Colonna M. Recruitment of immature plasmacytoid dendritic cells (plasmacytoid monocytes) and myeloid dendritic cells in primary cutaneous melanomas. J Pathol. 2003;200:255–268. doi: 10.1002/path.1344. [DOI] [PubMed] [Google Scholar]
- 30.van Gisbergen K.P., Aarnoudse C.A., Meijer G.A., Geijtenbeek T.B., van K.Y. Dendritic cells recognize tumor-specific glycosylation of carcinoembryonic antigen on colorectal cancer cells through dendritic cell-specific intercellular adhesion molecule-3-grabbing nonintegrin. Cancer Res. 2005;65:5935–5944. doi: 10.1158/0008-5472.CAN-04-4140. [DOI] [PubMed] [Google Scholar]
- 31.Gijzen K., Raymakers R.A., Broers K.M., Figdor C.G., Torensma R. Interaction of acute lymphopblastic leukemia cells with C-type lectins DC-SIGN and L-SIGN. Exp Hematol. 2008;36:860–870. doi: 10.1016/j.exphem.2008.02.003. [DOI] [PubMed] [Google Scholar]
- 32.Sugita K., Shimauchi T., Kabashima R., Nakashima D., Hino R., Kabashima K., Nakamura M., Tokura Y. Loss of tumor cell CCR4 expression upon leukemic change in adult T-cell leukemia/lymphoma. J Am Acad Dermatol. 2009;61:163–164. doi: 10.1016/j.jaad.2008.10.008. [DOI] [PubMed] [Google Scholar]
- 33.Fujita Y., Abe R., Sasaki M., Honda A., Furuichi M., Asano Y., Norisugi O., Shimizu T., Shimizu H. Presence of circulating CCR10+ T cells and elevated serum CTACK/CCL27 in the early stage of mycosis fungoides. Clin Cancer Res. 2006;12:2670–2675. doi: 10.1158/1078-0432.CCR-05-1513. [DOI] [PubMed] [Google Scholar]
- 34.Kagami S., Sugaya M., Minatani Y., Ohmatsu H., Kakinuma T., Fujita H., Tamaki K. Elevated serum CTACK/CCL27 levels in CTCL. J Invest Dermatol. 2006;126:1189–1191. doi: 10.1038/sj.jid.5700246. [DOI] [PubMed] [Google Scholar]