

Abstract
Background/Objectives
Socioeconomic disparities in diet quality are well established. This study tested the hypothesis that such disparities are mediated, in part, by diet cost.
Subjects/Methods
The Seattle Obesity Study (S.O.S.) was a cross sectional study based on a representative sample of 1266 adults of King County, WA conducted in 2008–09. Demographic and socioeconomic variables were obtained through telephone survey. Income and education were used as indicators of socioeconomic position (SEP). Dietary intake data were obtained using a food frequency questionnaire (FFQ). Diet cost was calculated based on retail prices for FFQ component foods. Energy density (KJ/g) and Mean Adequacy Ratio (MAR) were used as two indices of overall diet quality.
Results
Higher income and education were each associated with lower energy density and higher MAR scores, adjusting for covariates. Higher income and education were also associated with higher energy adjusted diet cost. Higher quality diets were in turn associated with higher diet costs. All these associations were significant (P<0.0001). In formal mediation analyses, diet cost significantly mediated the pathway between income and diet quality measures, adjusting for covariates (p <0.05 each). Further, income – diet cost – diet quality pathway was found to be moderated by education level.
Conclusions
The social gradient in diet quality may be explained by diet cost. Strategies to improve diet quality among lower socioeconomic strata may need to take food prices and diet cost along with nutrition education into account.
Key words or phrases: socioeconomic position, diet cost, energy density, MAR, diet quality, mediation analyses
Introduction
That groups of higher education and incomes tend to consume higher quality diets is well known (Shimakawa et al., 1994; Galobardes et al., 2001; Groth et al., 2001; Giskes et al., 2002; Kant & Graubard, 2007; Ricciuto & Tarasuk, 2007; Darmon & Drewnowski, 2008; Monsivais & Drewnowski, 2009; Mullie et al., 2010). Whereas measures of socioeconomic position (SEP) were mostly limited to education and incomes, measures of diet quality have varied widely from nutrients to foods or food groups. In general, higher quality diets were characterized by higher intakes of whole grains, lean meats, fresh fruits and vegetables, and by lower intakes of added fats and sugars, and refined grains (Darmon et al., 2005; Ledikwe et al., 2006).
Diet quality measures can also include such composite variables as Energy density and Mean adequacy Ratio (MAR) (Keller et al., 1997; Ledikwe et al., 2006; Kant & Graubard, 2007; Maillot et al., 2007b; Ricciuto & Tarasuk, 2007; Monsivais & Drewnowski, 2009), the healthy eating index (Mullie et al., 2010), dietary variety (Hatloy et al., 2000; Worsley et al., 2003) or dietary diversity (Kant & Graubard, 2007) and others (Shimakawa et al., 1994; Dynesen et al., 2003; Lallukka et al., 2007; Northstone & Emmett, 2010).
Higher quality diets, in turn, tend to be associated with higher diet costs (Andrieu et al., 2006; Maillot et al., 2007a; Murakami et al., 2009; Bernstein et al., 2010). In general, diets that were nutrient dense were more expensive than were diets that were energy dense but nutrient poor. Diets higher in vegetables and fruits cost more per calorie than diets higher in grains, sweets and fats (Darmon et al., 2005).
The present hypothesis was that the observed socioeconomic disparities in diet quality may be explained, in part, by differential diet cost (Figure 1). If so, then the following associations would be expected a) SEP would be linked to diet quality, b) SEP would be linked to diet cost, c) diet cost would be linked to diet quality and, d) the observed relation between SEP and diet quality would be attenuated once the diet cost variable was entered into the model. This was tested using mediation analysis, which examines if an observed association can be explained, in part, by another variable which is the mediator, and if mediation effects were statistically significant (Baron & Kenny, 1986). To our knowledge, the present study is the first to assess the role of diet cost as a mediating variable in the causal pathway between SEP and diet quality.
Figure 1.
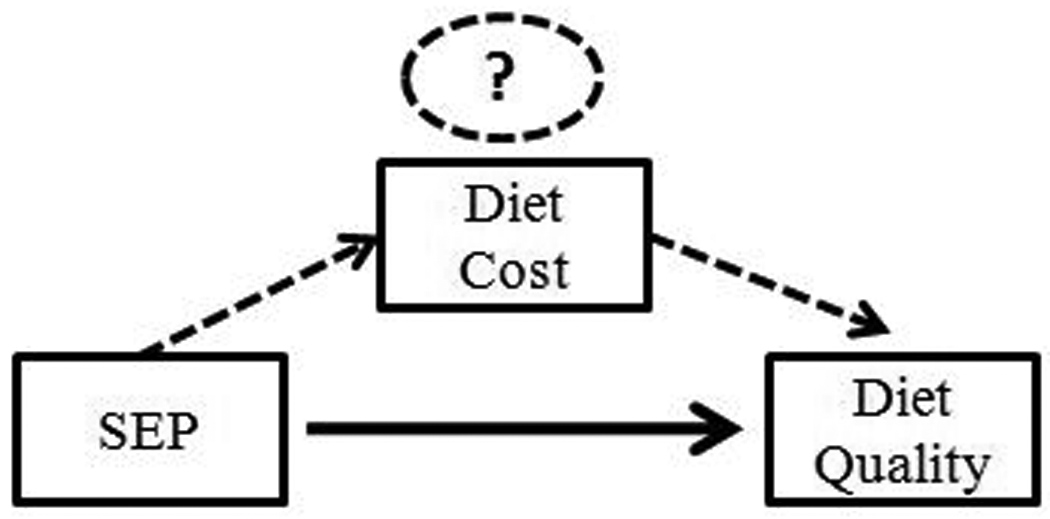
Diet cost may mediate the relation between SEP and diet quality
Materials and methods
Participant Sample
The Seattle Obesity Study (S.O.S.) was a population-based study of social disparities, diet quality, and health. A stratified sampling scheme ensured adequate representation by income and race/ethnicity. King County zip codes with high percentages of household incomes <$35000, African-Americans or Hispanics were over-sampled. Randomly generated telephone numbers were matched with residential addresses using commercial databases. A pre-notification letter was mailed out. Telephone calls were placed mostly in the afternoons and evenings with up to 13 follow ups. Once the household was contacted, an adult member of the household aged >18y was randomly selected. A 20 min telephone survey was administered by trained interviewers. The S.O.S sample was demographically comparable to the 2007 Behavioral Risk Factor Surveillance System (BRFSS) and King County Census data. Study protocols had been approved by Institutional Review Board at University of Washington.
Survey participants were asked if they would also complete a dietary intake assessment. The majority (n=1903 or 95%) agreed and FFQ instruments and stamped addressed return envelopes were mailed. Completed FFQs were returned by 1318 participants, a 69% response rate. Of these, 52 questionnaires were excluded based on extreme energy intakes (<2.1 or >21.0 MJ/day) leaving a sample of 1266 (804 women and 462 men). FFQ respondents were compared to those who did not respond to FFQs. FFQ respondents were likely to married (53% vs. 45%), educated (57% vs. 51%) and retired (28% vs.14%). No significant differences were seen by other SEP characteristics or health variables.
Dietary Intake Assessment
The FFQ used was the G-SEL version of the Fred Hutchinson Cancer Research Center (FHCRC), previously used in large scale studies (Neuhouser et al., 1999; Patterson et al., 1999). Participants recorded the frequency of consumption of foods and beverages listed in the FFQ along with portion size. Completed FFQs, returned to the investigators, were checked for errors, stripped of all identifiers and sent to Nutrition Shared Resource at the FHCRC for processing. Nutrient composition analyses of dietary intake data yielded dietary energy (kcal), the weight of foods, beverages, and drinking water (g), and the estimated daily intakes of over 45 macro- and micronutrients, using well established method in previous studies (Monsivais & Drewnowski, 2009).
Measures of dietary exposure
Our variables of dietary exposure were two summary measures of diet quality, energy density and MAR. Energy density, defined as ratio of total energy intake over daily weight of total foods consumed (KJ/g), was used as one indicator of diet quality, consistent with past studies (Ledikwe et al., 2005; Maillot et al., 2007b; Monsivais & Drewnowski, 2009). Following these studies, energy density of individual diets was derived from foods only. Mean Adequacy Ratio (MAR) was a truncated index of the percent of daily recommended intakes for key nutrients (Madden et al., 1976). It was computed by taking average of Nutrient adequacy ratio (NAR) for 11 key nutrients, namely vitamins A, C, D, E, B12, calcium, iron, magnesium, potassium, folate and fiber, using the formula below. Most of these nutrients were expressed as nutrients of concerns by 2005 Dietary Guidelines Advisory Committee (USDA, 2005)
Where, for nutrienti
Intakei is daily intake of each micronutrient, DRIi refers to age and gender specific dietary reference intakes for each nutrient (Food and Nutrition Board, 2004), MAR refers to average of NAR across 11 nutrients. MAR is expressed as % adequacy/d. Following past models, nutrients were not weighted and no attempt was made to adjust for bioavailability (Madden et al., 1976). NAR for each nutrient at the individual level was then truncated at 1 to avoid masking of overall MAR score due to higher intake of a particular nutrient (Madden et al., 1976; Maillot et al., 2007b). As beverages are an importance source of nutrients in a diet, MAR was computed using foods and caloric beverages (Kant, 1996; Torheim et al., 2004).
Monetary value of diets
The monetary value of diets was estimated by attaching a food price vector to the FFQ nutrient composition database using well established methods (Monsivais & Drewnowski, 2007; Monsivais & Drewnowski, 2009). Retail prices for each of the foods in the FFQ were obtained from 3 key supermarket chains in Seattle. The variable associated with each respondent was monetary value per day ($/d). Daily diet cost was energy adjusted using residual model and then categorized into quintiles, a standard energy adjustment and stratification technique in epidemiological studies (Willett, 1998; Bernstein et al., 2010). For analyses, diet cost was computed from the same data consistent with the respective diet quality variable. For energy density, diet cost was computed from foods only, and from foods and caloric beverages for MAR.
Demographic and Socioeconomic Measures
Self reported data on gender, age, race/ethnicity, and household size were obtained during the phone survey. For each participant, self reported education and annual household income were used as indicators of SEP. Education was measured in 6 categories ranging from “never attended” to “college graduates”. For analyses, high education was defined as those with ≥ college education. Household income was measured from “less than $10 000” to “greater than $100 000” per year. High income was defined as households making ≥$50,000.
Statistical Analyses
Multivariable logistic regression was used to examine the association between SEP and diet quality, adjusted for age, gender, race/ethnicity, total energy intake and household size. Quintiles of energy density and MAR each were used as independent variables and indicator of high income and high education each were used as dependent variables. Percent with high income and high education were reported setting age to 56 years and energy intake to 7.5MJ/d. Change per SD increase in energy density and MAR separately was also assessed.
Similar analyses were used to assess the association of SEP with diet cost. Energy adjusted quintiles of diet cost were used as independent variable with SEP indicators as dependent variables, adjusting for covariates.
To assess the association of diet cost with diet quality, multivariable linear regression was used. Energy adjusted quintiles of diet cost were used as independent variable and energy density and MAR each were used as dependent variables, adjusting for covariates.
The role of diet cost in mediating the relation between SEP and diet quality was assessed using Barry and Kenny three-step framework for formal mediation analysis (Baron & Kenny, 1986). The three steps are the following: 1) assess if SEP is associated with diet quality 2) assess if SEP is associated with diet cost, and 3) assess if strength of the association between SEP and diet quality is attenuated once diet cost is added to the model. To formally assess Step 3, the proportion of the association between SEP and diet quality (Step 1) reduced after adding diet cost into the same model was calculated. This method is similar to analytical techniques used by epidemiologists frequently (Marmot et al., 2008). However, in addition, it tests the strength of the mediation using Sobel-Goodman test (Sobel, 1982; MacKinnon et al., 2002). An α level of 0.05 was used to test for statistical significance. All analyses were conducted using STATA 10.0.
Results
Participant Characteristics
Mean age was 56±14 y for men and 56±15 y for women. More than half (62%) of the sample had household incomes ≥50K (median for WA State) and 57% were college graduates.
Mean daily energy intake from all foods and caloric beverages was 8.3±3.2 MJ/d for men and 7.1±2.8 MJ/d for women. Mean daily energy intake from foods only was 7.1±3.0 MJ/d for men and 6.3±2.4 MJ/d for women. Energy density based on foods only was 6.4±1.3 KJ/g for men and 5.7±1.4 KJ/g for women. As measured by truncated MAR, dietary adequacy for 11 nutrients in the diet was 74±17 % for men and 76±16 % for women. Examination of nutrient intakes with respect to age and gender specific DRIs showed that nutrient adequacy was significantly below recommended values for vitamins D and E, and potassium, followed by calcium, fiber and magnesium (results not shown).
Mean diet cost ($/d), based on foods and caloric beverages, was $9.45±4.07 for men and $8.75±3.60 for women. Energy adjusted diet cost ($/8.4MJ) was 9.61±2.18 for men and 10.48±2.47 for women.
SEP with diet quality
Table 1 shows associations between quintiles of energy density and MAR each with SEP indicators (income and education separately), after adjusting for covariates. With increase in quintiles of energy density, there was a significant drop in the proportion of those with higher income (60% to 39%) and higher education (74% to 53%). By contrast, higher MAR score, a positive indicator of diet quality, was associated with significantly higher proportion of those with higher income (increased from 29% to 63% across extreme quintiles) and education (37% to 79%). These trends were all significant, with p for linear trend <0.0001.
Table 1.
Multivariate regression with socioeconomic indicatorsa as dependent variables, and energy densityb and MARc each as independent variables, adjustedd for covariates
| Quintiles of energy density (n=1266) | |||||||
|---|---|---|---|---|---|---|---|
| Dependent variables | Q1 | Q2 | Q3 | Q4 | Q5 | p-valuee | βf |
| Socioeconomic Indicators | |||||||
| Income % (95% CI) | 60.3 (45.6, 73.3) | 49.5 (35.0, 64.0) | 49.9 (35.5, 64.3) | 46.7 (32.6, 61.3) | 38.5 (25.8, 52.9) | <0.0001 | 0.77*** |
| Education % (95% CI) | 74.2 (63.1, 82.8) | 72.3 (60.0, 81.5) | 66.0 (53.7, 76.4) | 64.2 (51.7, 75.0) | 53.3 (40.7, 65.5) | <0.0001 | 0.71*** |
| Quintiles of MAR (n=1266) | |||||||
| Q1 | Q2 | Q3 | Q4 | Q5 | p-valuee | βf | |
| Socioeconomic Indicators | |||||||
| Income % (95% CI) | 29.1 (17.6, 44.2) | 47.5 (33.2, 62.1) | 51.5 (37.3, 65.5) | 52.9 (38.7, 66.6) | 62.9 (47.5, 76.1) | <0.0001 | 1.76*** |
| Education % (95% CI) | 37.2 (25.1, 51.2) | 57.8 (45.0, 69.7) | 65.7 (53.5, 76.0) | 69.4 (57.8, 79.0) | 79.2 (68.6, 86.9) | <0.0001 | 2.02*** |
Income (≥50K vs. <50K as reference category) and Education (at least college graduates vs. less as reference category)
Energy density defined as KJ/g and computed from foods only
MAR defined as % adequacy per day and computed from foods and caloric beverages.
Adjusted for age, gender, race/ethnicity, household size and total energy intake. Proportions presented for age of 56 y and energy intake of 7.5 MJ/d.
p-value for trend test across energy adjusted quintiles of daily diet cost
Odds ratio for socioeconomic indicators per SD increase in energy density/ MAR respectively.
P <0.0001
SEP with diet cost
Table 2 shows positive associations between SEP and quintiles of diet cost, after adjusting for covariates. People in the highest quintile of diet cost were significantly more likely to be from higher income and higher education categories. There was a 96% increase in proportion of higher income among those in highest quintile of diet cost compared to lowest. Similarly, proportion of those with higher education was higher by 60% across extreme quintiles. The trends were significant with p-value <0.0001.
Table 2.
Multivariate regression with socioeconomic indicatorsa as dependent variables, and quintiles of diet costb as independent variable, adjustedc for covariates.
| Quintiles of energy adjusted diet cost (n=1266) | p- valued |
||||||
|---|---|---|---|---|---|---|---|
| Dependent variables | Q1 | Q2 | Q3 | Q4 | Q5 | βe | |
| Socioeconomic Indicators5 | |||||||
| Income % (95% CI) | 32.7 (21.4, 46.6) | 38.8 (25.9, 53.6) | 51.5 (37.2, 65.5) | 60.4 (45.9, 73.1) | 64.4 (49.9, 76.7) | <0.0001 | 1.55*** |
| Education % (95% CI) | 49.2 (36.8, 61.6) | 59.2 (46.2, 71.0) | 63.5 (51.2, 74.2) | 69.8 (58.2, 79.2) | 78.7 (68.6, 86.1) | <0.0001 | 1.54*** |
Income (>=50K vs. <50K as reference category) and Education (at least college graduates vs. less as reference category)
Daily diet cost ($/d) energy adjusted using residual method and then converted into quintiles. Computed from foods and caloric beverages
Adjusted for age, gender, race/ethnicity and household size. Proportions presented for age of 56 years.
p-value for trend test across energy adjusted quintiles of daily diet cost
Odds ratio for socioeconomic indicators each per SD increase in energy adjusted diet cost.
P <0.0001
Diet cost with diet quality
Table 3 shows associations between energy adjusted quintile of diet cost with energy density and MAR separately. Mean energy density of the diet was 36% lower among those in the highest quintile of diet cost compared to the lowest (4.8 KJ/g vs. 7.5 KJ/g respectively). By contrast, MAR showed a strong positive association and increased from 75% to 85% across extreme quintiles of diet cost. These trends were all significant, with p for linear trend <0.0001.
Table 3.
Multivariate regression with energy densitya and MARb each as dependent variables, and quintiles of diet costc as independent variable, adjustedd for covariates
| Quintiles of energy adjusted diet cost (n=1266) | |||||||
|---|---|---|---|---|---|---|---|
| Dependent variables | Q1 | Q2 | Q3 | Q4 | Q5 | p-valuee | βf |
| Summary measures | |||||||
| Energy density (95% CI) | 7.5 (7.3, 7.7) | 6.6 (6.4, 6.9) | 6.0 (5.8, 6.3) | 5.6 (5.4, 5.9) | 4.8 (4.6, 5.1) | <0.0001 | −0.89*** |
| MAR % (95% CI) | 74.5 (72.3, 76.8) | 77.2 (74.8, 79.5) | 79.3 (77.0, 81.6) | 82.8 (80.6, 85.0) | 85.2 (83.0, 87.5) | <0.0001 | 3.57*** |
Energy density defined as KJ/g and computed from foods only
MAR defined as % adequacy per day and computed from foods and caloric beverages.
Daily diet cost ($/d) energy adjusted using residual method and then converted into quintiles. Diet cost estimates were obtained from the same data as used for the respective diet quality variable. Energy density and its corresponding diet cost were computed from foods only. MAR and its corresponding diet cost were computed from foods and caloric beverages.
Adjusted for age, gender, race/ethnicity, household size and total energy intake. Means presented for age of 56 years and energy intake of 7.5 MJ/d.
p-value for trend test across energy adjusted quintiles of diet cost
Regression coefficients for each energy density and MAR per SD increase in energy adjusted diet cost.
P <0.0001
Role of diet cost in mediating the relation between SEP and diet quality
Table 4A shows results of mediation analysis with energy density as the dependent variable, SEP indicator (high income) as independent variable and energy-adjusted diet cost as the mediator variable, after controlling for other covariates. Model 1 and 2 obtained from mediation tests re-establish the associations between income and energy density (−0.34KJ/g mean difference between high and low income), and income and diet cost (0.46KJ/g) respectively. Both these associations were highly significant (p-value<0.0001). Model 3 shows significant attenuation in the association observed between income and energy density when diet cost was added to the model. The effect of income reduced by 76% from −0.34KJ/g in model 1 to −0.08KJ/g in model 3. Sobel-Goodman test indicates that mediation by diet cost was highly significant (p-value <0.00001). Further, the income – diet cost – energy density pathway was found to be moderated by education level. Among those with education ≤ high school, the relation between income and energy density was much stronger (−0.48KJ/g) compared to those with ≥ college degree (−0.27KJ/g). However, after further adjusting for diet cost, the association reduced by 95% (−0.48KJ/g in model 1 to −0.02KJ/g in model 3) among those with ≥ high school education compared to 69% among college graduates (−0.27KJ/g in model 1 to −0.08KJ/g in model 3). As indicated by Sobel-Goodman test, the mediation effects by diet cost were significant for both lower and higher education. However, since no significant association was initially observed between income and energy density among those with some college education, there was no effect to be mediated.
Table 4.
A: Mediation analysis with energy densitya as the dependent variable, SEP indicatorsb as independent variables and diet costc as the mediating variable. Effect modification by education was examined.
| Model 1d | Model 2e | Model 3f | Proportion of total effect mediated by diet cost |
||||
|---|---|---|---|---|---|---|---|
| β | 95% CI | β | 95% CI | β | 95% CI | ||
| Income as the independent variable and diet cost as the mediating variable before taking education into account | |||||||
| Higher income | −0.34*** | −0.51, −0.16 | 0.46*** | 0.25, 0.66 | −0.08 | −0.21, 0.04 | |
| Diet Cost | - | - | −0.56*** | −0.60, −0.52 | 76%**** | ||
| Only among those ≤ high school education (n = 180) | |||||||
| Higher income | −0.48* | −0.93, −0.03 | 0.80** | 0.29, 1.31 | −0.02 | −0.37, 0.32 | |
| Diet Cost | - | - | −0.57*** | −0.67, −0.47 | 95%** | ||
| Only among those with some college (n = 274) | |||||||
| Higher income | −0.09 | −0.44, 0.24 | 0.16 | −0.23, 0.56 | −0.002 | −0.26, 0.25 | |
| Diet Cost | - | - | −0.58*** | −0.65, −0.50 | - | ||
| Only among those ≥ college graduates(n = 648) | |||||||
| Higher income | −0.27* | −0.50, −0.03 | 0.35* | 0.06, 0.64 | 0.08 | −0.25, 0.09 | |
| Diet Cost | - | - | 0.53*** | −0.58, −0.48 | 69%* | ||
|
Table 4B: Mediation analysis with MARa as the dependent variable, SEP indicatorsb as independent variables and diet costc as the mediating variable. Effect modification by education was examined. | |||||||
|---|---|---|---|---|---|---|---|
| Model 1d | Model 2e | Model 3f | Proportion of total effect mediated by diet cost |
||||
| β | 95% CI | β | 95% CI | β | 95% CI | ||
| Income as the independent variable and diet cost as the mediating variable before taking education into account | |||||||
| Higher income | 3.28*** | 1.99, 4.56 | 0.72*** | 0.46, 0.98 | 2.10** | 0.88, 3.33 | |
| Diet Cost | - | - | 1.61*** | 1.34, 1.88 | 36%*** | ||
| Only among those ≤ high school education (n = 180) | |||||||
| Higher income | 5.24** | 2.00, 8.49 | 1.02** | 0.46, 1.57 | 3.16 | −0.006, 6.33 | |
| Diet Cost | - | - | 2.04*** | 1.22, 2.86 | 40%** | ||
| Only among those with some college (n = 274) | |||||||
| Higher income | 0.62 | −1.93, 3.17 | 0.31 | −0.17, 0.79 | 0.17 | −2.29, 2.64 | |
| Diet Cost | - | - | 1.43*** | 0.83, 2.03 | - | ||
| Only among those ≥ college graduates (n = 648) | |||||||
| Higher income | 2.20* | 0.46, 3.94 | 0.57** | 0.18, 0.96 | 1.37 | −0.28, 3.03 | |
| Diet Cost | - | - | 1.43*** | 1.11, 1.76 | 38%** | ||
Energy density defined as KJ/g and computed from foods only
Higher income defined as ≥50K vs. <50K as the reference category. Effect modification by education examined. High school defined as ≤ 12 years of education, some college as college 1–3 years and college graduates as college of 4 years or more
Daily diet cost ($/d) energy adjusted using residual method and computed from foods only
Model 1 of mediation analyses. Multivariable regression with energy density regressed on SEP variables, before adding diet cost to the model. Adjusted for age, gender, household size, race/ethnicity and total energy intake.
Model 2 of mediation analyses. Multivariable regression with diet cost (mediating variable) as the dependent variable, regressed on SEP variables, adjusted for age, gender, household size, race/ethnicity and total energy intake.
Model 3 of mediation analyses. Multivariable regression with energy density regressed on SEP variables, after adding diet cost to the model. Adjusted for age, gender, household size, race/ethnicity and total energy intake.
p <0.05,
p<0.005,
p <0.0001,
p <0.00001
MAR defined as % adequacy/d and computed from foods and caloric beverages
Higher income defined as ≥50K vs. <50K as the reference category. Effect modification by education examined. High school defined as ≤ 12 years of education, some college as college 1 to 3 years, college graduates as college 4 years or more
Daily diet cost ($/d) energy adjusted using residual method and computed from foods and caloric beverages
Model 1 of mediation analyses. Multivariable regression with MAR regressed on SEP variables, before adding diet cost to the model. Adjusted for age, gender, household size, race/ethnicity and total energy intake.
Model 2 of mediation analyses. Multivariable regression with diet cost (mediating variable) as the dependent variable, regressed on SEP variables, adjusted for age, gender, household size, race/ethnicity and total energy intake.
Model 3 of mediation analyses. Multivariable regression with MAR regressed on SEP variables, after adding diet cost to the model. Adjusted for age, gender, household size, race/ethnicity and total energy intake.
p <0.05,
p<0.005,
p <0.0001,
p <0.00001
Table 4B shows similar results with MAR as the dependent variable. Model 1 re-established the positive association between income and MAR. However, there was significant attenuation after adding diet cost to the model (Model 3). Similar to the results obtained with energy density, the income – diet cost – MAR pathway was found to be moderated by education. Among those with ≥ high school education, the association of income with MAR was much stronger (5.24% difference in nutrient adequacy between high and low income) compared to college graduates (2.20%). After adding diet cost to the same model, the income effect was attenuated by 40% (from 5.24 in model 1 to 3.16 in model 3) among those with ≥ high school education as compared to 38% among college graduates (2.20 in model 1 to 1.37 in model 3). Sobel-Goodman test showed that the mediation effects were highly significant with p-value <0.05. Again, no initial association was observed among those with some college education.
Discussion
The present study is the first to show that the previously observed relation between SEP and diet quality may be significantly mediated by diet cost. As predicted, stepwise analyses confirmed that lower SEP groups consumed more energy dense and nutrient poor diets. Furthermore, lower SEP groups had lower diet costs and lower cost diets were more likely to be energy dense and nutrient poor. These findings are consistent with past observations (Keller et al., 1997; Kant & Graubard, 2007; Maillot et al., 2007b; Monsivais & Drewnowski, 2009; Bernstein et al., 2010).
The hypothesis that diet cost may be one of the mechanisms to explain socioeconomic disparities in diet quality has been advanced before (Darmon & Drewnowski, 2008; Monsivais & Drewnowski, 2009; Mullie et al., 2010). The present study is the first to establish this mechanism using formal mediation analyses. Data shows that the effects of income on diet quality can be explained by diet cost. This can be attributed to the general consensus that income is a direct proxy for affordability of foods (Turrell et al., 2003; Kant & Graubard, 2007). Further, income – diet cost pathway was found to play a stronger role in determining diet quality among lower education as compared to higher education. This can be attributed to the fact that education extends beyond affordability and also reflects one’s ability to use dietary knowledge to achieve better quality diets within the given budget constraints (Galobardes et al., 2001; Turrell et al., 2003; Kant & Graubard, 2007). No significant associations were seen among those with some college education. This could be due to heterogeneity in this sub-group by income, which may be a typical characteristic of Seattle population.
The study had certain limitations. First, estimates of diet quality and diet cost were each based on FFQs, which have some known biases (Willett, 1998; Drewnowski, 2001). However, the estimates of energy density obtained from FFQs were consistent with previous studies (Ledikwe et al., 2005; Monsivais & Drewnowski, 2009). Secondly, diet cost used as an indicator of monetary value of the diet was based on retail food prices rather than actual expenditures made by the study sample. At the same time, this method of estimating diet cost has already been used in existing studies (Schroder et al., 2006; Drewnowski et al., 2007; Monsivais & Drewnowski, 2009; Murakami et al., 2009; Bernstein et al., 2010). Third, the study sample was representative of adult residents of King County, WA and not of the US population as a whole. Median incomes in King County were higher than the national figures and percentage of minorities was lower. Fourth, mediation analyses were based on cross sectional data, assuming temporality in SEP, diet cost and diet quality.
Nonetheless, the present findings have implications for epidemiological studies and public health policy. First, cost of the diet is one of the critical, yet underappreciated, factors that may explain consumption of lower quality diets among lower socioeconomic strata. It becomes imperative for future studies and interventions, aimed at improving the diet quality and diet related diseases, to take diet cost into account. Second, improving dietary knowledge should continue to be the focus of nutrition education programs and interventions as another strategy to improve diet quality within the income constraints. A key question remains whether socioeconomic differences in physical access to healthy foods, food preferences and attitudes may also contribute to social differences in diet quality.
Acknowledgements
This research was supported in part by National Institute of Diabetes and Digestive and Kidney Diseases grants R01DK076608 and R21DK085406.
Funding support: NIH grant NIDDKR01DK076608
Footnotes
Conflict of interest
None declared
References
- Andrieu E, Darmon N, Drewnowski A. Low-cost diets: more energy, fewer nutrients. Eur J Clin Nutr. 2006;60:434–436. doi: 10.1038/sj.ejcn.1602331. [DOI] [PubMed] [Google Scholar]
- Baron RM, Kenny DA. The moderator-mediator variable distinction in social psychological research: conceptual, strategic, and statistical considerations. J Pers Soc Psychol. 1986;51:1173–1182. doi: 10.1037//0022-3514.51.6.1173. [DOI] [PubMed] [Google Scholar]
- Bernstein AM, Bloom DE, Rosner BA, Franz M, Willett WC. Relation of food cost to healthfulness of diet among US women. Am J Clin Nutr. 2010;92(5):1197–1203. doi: 10.3945/ajcn.2010.29854. [DOI] [PMC free article] [PubMed] [Google Scholar]
- Darmon N, Darmon M, Maillot M, Drewnowski A. A nutrient density standard for vegetables and fruits: nutrients per calorie and nutrients per unit cost. J Am Diet Assoc. 2005;105:1881–1887. doi: 10.1016/j.jada.2005.09.005. [DOI] [PubMed] [Google Scholar]
- Darmon N, Drewnowski A. Does social class predict diet quality? Am J Clin Nutr. 2008;87:1107–1117. doi: 10.1093/ajcn/87.5.1107. [DOI] [PubMed] [Google Scholar]
- Drewnowski A. Diet image: a new perspective on the food-frequency questionnaire. Nutr Rev. 2001;59:370–372. doi: 10.1111/j.1753-4887.2001.tb06964.x. [DOI] [PubMed] [Google Scholar]
- Drewnowski A, Monsivais P, Maillot M, Darmon N. Low-energy-density diets are associated with higher diet quality and higher diet costs in French adults. J Am Diet Assoc. 2007;107:1028–1032. doi: 10.1016/j.jada.2007.03.013. [DOI] [PubMed] [Google Scholar]
- Dynesen AW, Haraldsdottir J, Holm L, Astrup A. Sociodemographic differences in dietary habits described by food frequency questions--results from Denmark. Eur J Clin Nutr. 2003;57:1586–1597. doi: 10.1038/sj.ejcn.1601728. [DOI] [PubMed] [Google Scholar]
- Food and Nutrition Board. Institute of Medicine. Washington, D.C.: National Academy Press; 2004. Dietary Reference Intakes: Recommended intakes for individuals. [Google Scholar]
- Galobardes B, Morabia A, Bernstein MS. Diet and socioeconomic position: does the use of different indicators matter? Int J Epidemiol. 2001;30:334–340. doi: 10.1093/ije/30.2.334. [DOI] [PubMed] [Google Scholar]
- Giskes K, Turrell G, Patterson C, Newman B. Socio-economic differences in fruit and vegetable consumption among Australian adolescents and adults. Public Health Nutr. 2002;5:663–669. doi: 10.1079/PHN2002339. [DOI] [PubMed] [Google Scholar]
- Groth MV, Fagt S, Brondsted L. Social determinants of dietary habits in Denmark. Eur J Clin Nutr. 2001;55:959–966. doi: 10.1038/sj.ejcn.1601251. [DOI] [PubMed] [Google Scholar]
- Hatloy A, Hallund J, Diarra MM, Oshaug A. Food variety, socioeconomic status and nutritional status in urban and rural areas in Koutiala (Mali) Public Health Nutr. 2000;3:57–65. doi: 10.1017/s1368980000000628. [DOI] [PubMed] [Google Scholar]
- Kant AK. Indexes of overall diet quality: A review. J Am Diet Assoc. 1996;96:785. doi: 10.1016/S0002-8223(96)00217-9. [DOI] [PubMed] [Google Scholar]
- Kant AK, Graubard BI. Secular trends in the association of socio-economic position with self-reported dietary attributes and biomarkers in the US population: National Health and Nutrition Examination Survey (NHANES) 1971–1975 to NHANES 1999–2002. Public Health Nutr. 2007;10:158–167. doi: 10.1017/S1368980007246749. [DOI] [PubMed] [Google Scholar]
- Keller HH, Ostbye T, Bright-See E. Predictors of dietary intake in Ontario seniors. Can J Public Health. 1997;88:305–309. doi: 10.1007/BF03403895. [DOI] [PMC free article] [PubMed] [Google Scholar]
- Lallukka T, Laaksonen M, Rahkonen O, Roos E, Lahelma E. Multiple socio-economic circumstances and healthy food habits. Eur J Clin Nutr. 2007;61:701–710. doi: 10.1038/sj.ejcn.1602583. [DOI] [PubMed] [Google Scholar]
- Ledikwe JH, Blanck HM, Khan LK, Serdula MK, Seymour JD, Tohill BC, Rolls BJ. Dietary energy density determined by eight calculation methods in a nationally representative United States population. J Nutr. 2005;135:273–278. doi: 10.1093/jn/135.2.273. [DOI] [PubMed] [Google Scholar]
- Ledikwe JH, Blanck HM, Khan LK, Serdula MK, Seymour JD, Tohill BC, Rolls BJ. Low-energy-density diets are associated with high diet quality in adults in the United States. J Am Diet Assoc. 2006;106:1172–1180. doi: 10.1016/j.jada.2006.05.013. [DOI] [PubMed] [Google Scholar]
- MacKinnon DP, Lockwood CM, Hoffman JM, West SG, Sheets V. A comparison of methods to test mediation and other intervening variable effects. Psychol Methods. 2002;7:83–104. doi: 10.1037/1082-989x.7.1.83. [DOI] [PMC free article] [PubMed] [Google Scholar]
- Madden JP, Goodman SJ, Guthrie HA. Validity of the 24-hr. recall. Analysis of data obtained from elderly subjects. J Am Diet Assoc. 1976;68:143–147. [PubMed] [Google Scholar]
- Maillot M, Darmon N, Darmon M, Lafay L, Drewnowski A. Nutrient-dense food groups have high energy costs: an econometric approach to nutrient profiling. J Nutr. 2007a;137:1815–1820. doi: 10.1093/jn/137.7.1815. [DOI] [PubMed] [Google Scholar]
- Maillot M, Darmon N, Vieux F, Drewnowski A. Low energy density and high nutritional quality are each associated with higher diet costs in French adults. Am J Clin Nutr. 2007b;86:690–696. doi: 10.1093/ajcn/86.3.690. [DOI] [PubMed] [Google Scholar]
- Marmot MG, Shipley MJ, Hemingway H, Head J, Brunner EJ. Biological and behavioural explanations of social inequalities in coronary heart disease: the Whitehall II study. Diabetologia. 2008;51:1980–1988. doi: 10.1007/s00125-008-1144-3. [DOI] [PMC free article] [PubMed] [Google Scholar]
- Monsivais P, Drewnowski A. The rising cost of low-energy-density foods. J Am Diet Assoc. 2007;107:2071–2076. doi: 10.1016/j.jada.2007.09.009. [DOI] [PubMed] [Google Scholar]
- Monsivais P, Drewnowski A. Lower-energy-density diets are associated with higher monetary costs per kilocalorie and are consumed by women of higher socioeconomic status. J Am Diet Assoc. 2009;109:814–822. doi: 10.1016/j.jada.2009.02.002. [DOI] [PMC free article] [PubMed] [Google Scholar]
- Mullie P, Clarys P, Hulens M, Vansant G. Dietary patterns and socioeconomic position. Eur J Clin Nutr. 2010;64:231–238. doi: 10.1038/ejcn.2009.145. [DOI] [PubMed] [Google Scholar]
- Murakami K, Miyake Y, Sasaki S, Tanaka K, Ohya Y, Hirota Y. Monetary diet cost is associated with not only favorable but also unfavorable aspects of diet in pregnant Japanese women: The Osaka Maternal and Child Health Study. Environ Health Insights. 2009;3:27–35. doi: 10.4137/EHI.S2508. [DOI] [PMC free article] [PubMed] [Google Scholar]
- Neuhouser ML, Kristal AR, McLerran D, Patterson RE, Atkinson J. Validity of short food frequency questionnaires used in cancer chemoprevention trials: results from the Prostate Cancer Prevention Trial. Cancer Epidemiol Biomarkers Prev. 1999;8:721–725. [PubMed] [Google Scholar]
- Northstone K, Emmett PM. Dietary patterns of men in ALSPAC: associations with socio-demographic and lifestyle characteristics, nutrient intake and comparison with women's dietary patterns. Eur J Clin Nutr. 2010;64:978–986. doi: 10.1038/ejcn.2010.102. [DOI] [PubMed] [Google Scholar]
- Patterson RE, Kristal AR, Tinker LF, Carter RA, Bolton MP, Agurs-Collins T. Measurement characteristics of the Women's Health Initiative food frequency questionnaire. Ann Epidemiol. 1999;9:178–187. doi: 10.1016/s1047-2797(98)00055-6. [DOI] [PubMed] [Google Scholar]
- Ricciuto LE, Tarasuk VS. An examination of income-related disparities in the nutritional quality of food selections among Canadian households from 1986–2001. Soc Sci Med. 2007;64:186–198. doi: 10.1016/j.socscimed.2006.08.020. [DOI] [PubMed] [Google Scholar]
- Schroder H, Marrugat J, Covas MI. High monetary costs of dietary patterns associated with lower body mass index: a population-based study. Int J Obes (Lond) 2006;30:1574–1579. doi: 10.1038/sj.ijo.0803308. [DOI] [PubMed] [Google Scholar]
- Shimakawa T, Sorlie P, Carpenter MA, Dennis B, Tell GS, Watson R, Williams OD. Dietary intake patterns and sociodemographic factors in the atherosclerosis risk in communities study. ARIC Study Investigators. Prev Med. 1994;23:769–780. doi: 10.1006/pmed.1994.1133. [DOI] [PubMed] [Google Scholar]
- Sobel ME. Asymptotic confidence intervals for indirect effects in structural equation models. Washington, DC: American Sociological Association; 1982. [Google Scholar]
- Torheim LE, Ouattara F, Diarra MM, Thiam FD, Barikmo I, Hatloy A, Oshaug A. Nutrient adequacy and dietary diversity in rural Mali: association and determinants. Eur J Clin Nutr. 2004;58:594–604. doi: 10.1038/sj.ejcn.1601853. [DOI] [PubMed] [Google Scholar]
- Turrell G, Hewitt B, Patterson C, Oldenburg B. Measuring socio-economic position in dietary research: is choice of socio-economic indicator important? Public Health Nutr. 2003;6:191–200. doi: 10.1079/PHN2002416. [DOI] [PubMed] [Google Scholar]
- US Department of Agriculture. Washington, DC: Government Printing Office; 2005. Adequate nutrients with calorie needs: Dietary Guidelines for Americans, 2005. [Google Scholar]
- Willett W. 2nd ed. New York: Oxford University Press; 1998. Nutritional Epidemiology. [Google Scholar]
- Worsley A, Blasche R, Ball K, Crawford D. Income differences in food consumption in the 1995 Australian National Nutrition Survey. Eur J Clin Nutr. 2003;57:1198–1211. doi: 10.1038/sj.ejcn.1601670. [DOI] [PubMed] [Google Scholar]