

Abstract
Fragile X syndrome (FXS) is caused by loss of the fragile X mental retardation gene protein product (FMRP) through promoter hypermethylation, which is usually associated with CGG expansion to full mutation size (>200 CGG repeats). Methylation-sensitive Southern blotting is the current gold standard for the molecular diagnosis of FXS. For females, Southern blotting provides the activation ratio (AR), which is the proportion of unmethylated alleles on the active X chromosome. Herein, we examine the relationship of FMRP expression with methylation patterns of two fragile X–related epigenetic elements (FREE) analyzed using matrix-assisted laser desorption/ionization–time-of-flight mass spectrometry and the AR. We showed that the differential methylation of the FREE2 sequence within fragile X mental retardation gene intron 1 was related to depletion of FMRP expression. We also show that, using the combined cohort of 12 females with premutation (55 to 200 CGG repeats) and 22 females with full mutation alleles, FREE2 methylation analysis was superior to the AR as a predictor of the proportion of FMRP-positive cells in blood. Because matrix-assisted laser desorption/ionization–time-of-flight mass spectrometry is amenable to high-throughput processing and requires minimal DNA, these findings have implications for routine FXS testing and population screening.
Diagnostic laboratories use a combination of PCR-based techniques and methylation-sensitive Southern blot (SB) analysis for molecular diagnosis of the fragile X syndrome (FXS). These assays provide information on the size of the CGG repeat expansion within the 5′UTR of the fragile X mental retardation gene (FMR1) and the methylation status of the FMR1 promoter.1 For females who carry one normal-sized allele and one expanded FMR1 allele, SB also provides information on the proportion of X chromosomes with the normal-sized allele that are active, known as the FMR1 activation ratio (AR).2 The methylation status of the expanded alleles and the AR in females are thought to reflect the levels of FMR1 protein product (FMRP),3 which functions as a regulator of processes involved in synaptic formation and plasticity,4 essential for normal brain development.5
A major limitation of the current approach to FXS testing is the use of SB analysis, which is laborious, time-consuming, and costly and requires large quantities of high-quality DNA for analysis. This limitation also makes SB unsuitable for population screening. In an attempt to replace SB, several PCR-based approaches have recently been developed to reliably amplify premutation (PM; 55 to 200 CGG repeats) and small full-mutation (FM; >200 CGG repeats) alleles.6–8 However, these new tests do not provide information on FMR1 promoter methylation status.6,7,9
Because CGG size alone does not fully predict the functionality of the FMR1 gene, methylation-sensitive SB analysis is still required for the samples identified as PM, FM, or a combination of the two (ie, mosaic) to interpret the resulting FXS phenotype. Between 30% and 50% of FM females carry the abnormal allele, predominantly on the inactive X chromosome, and have a normal IQ, whereas only 25% of all FM females have been classified as intellectually disabled.2,10 Furthermore, approximately 15% of the FM carriers are FM-PM mosaics, where PM is the predominant allele and the major source of FMRP.11 The mosaic FM-PM males are often high functioning, with an IQ in the borderline or low end of the normal range.11 FM males with an unmethylated (UM) FMR1 promoter can also be high functioning because of production of some FMRP.11
Although several methylation-specific PCR and multiplex ligation probe amplification tests have been developed for high-throughput molecular diagnosis of FXS,12–24 these tests have limited use for methylation analysis of FM and PM female samples because the methylation related to X inactivation is not distinguishable from the methylation related to the expanded alleles. Furthermore, to our knowledge, compared with methylation-sensitive SB, there are no PCR or multiplex ligation probe amplification tests that show a comparable degree of association with FMRP or clinical measures for female carriers of expanded FMR1 alleles.2,3,25
We have developed a high-throughput method that examines methylation of novel epigenetic markers for FXS: fragile X–related epigenetic elements 1 (FREE1) and 2 (FREE2).26,27 The elements are located on either side of the CGG expansion outside the classic 52-site CpG island and are different from the sites routinely analyzed using methylation-sensitive SB28 or methylation-specific PCR.21 To assess the methylation pattern of these sites, we used the EpiTYPER system (Sequenom, Inc., San Diego, CA), a premium tool for methylation analysis,29–32 that we have previously used for fragile X testing.26
We have demonstrated that methylation patterns of these regions are consistent between different cell types and are specific for pathogenic FM alleles in FXS-affected males and females. The mean methylation values across these regions were also inversely related to FMRP expression using immunoassaying in blood samples of high-functioning FM and FM-PM mosaic males.26 Furthermore, we have shown that, using a small sample of FM females, mean methylation output ratios (MORs) for FREE1 (CpG 2 to 10) and FREE2 (CpG 1 to 12) were highly inversely correlated with the FMR1 AR (determined by SB) and positively correlated with one another.26 However, it is important to make a distinction between the SB AR and FREE methylation analysis, which are not equivalent in PM-FM female mosaics. The FREE matrix-assisted laser desorption/ionization–time-of-flight (MALDI-TOF) MOR represents total methylation (contribution of all allele types), whereas the SB AR is specific to methylation or lack of it on normal-sized alleles.2 Herein, we compare the AR from SB analysis with the MOR of the FREE1 and FREE2 regions to examine their relationships with FMRP in blood lymphocytes from females carrying PM or FM alleles.
Materials and Methods
Patient Samples
The study was approved by the Royal Children's Hospital, Melbourne, Ethics Committee and by the Institutional Review Board of the University of California at Davis. FM carrier and control Epstein-Barr virus–transformed lymphoblast cell lines for the DNA spiking experiment were obtained from the Murdoch Childrens Research Institute tissue culture storage repository in Melbourne.
The participants included in this study were aged between 6 and 63 years and comprised 23 healthy control (HC) females with normal-sized expansion and 15 FM subjects from Australia and 12 PM carriers and seven FM subjects from the United States. The Australian participants were recruited through the fragile X families attending the Victorian Clinical Genetic Services at the Royal Children's Hospital. The US participants were recruited through families attending the Child Development Unit of the Children's Hospital in Denver, CO. The data on SB methylation analysis and FMRP immunoreactivity in blood smears previously described by Loesch et al33 were used in this study.
FMRP Assessment in Blood
FMRP immunoreactivity assessment was conducted on blood smears made within 24 hours of blood collection, as previously described.25,34,35 The FMRP level is expressed as the percentage of lymphocytes that are positive in staining for FMRP using immunocytochemical techniques, as previously described.25
CGG Repeat Size PCR Amplification
The CGG repeat size for all samples was initially assessed using a fully validated PCR assay, with precision of plus or minus one triplet repeat across the normal (<45 CGG repeats) and grey zone (45-54 CGG repeats) ranges, performed using a fragment analyzer (MegaBace; GE Healthcare/Amersham Biosciences, Buckinghamshire, England), with a higher detection limit of 170 repeats, as previously described.36
Methylation-Sensitive SB Analysis
Methylation of the classic FMR1 CpG island was assessed using a fully validated methylation-sensitive SB procedure with appropriate normal and abnormal controls, as previously described9; EcoRI and NruI digestion was performed on 7 to 9 μg of DNA. Fragments were separated on a 0.8% agarose–Tris acetate EDTA gel; DNA was denatured with HCl and NaOH and transferred to a charged nylon membrane. The FMR1 alleles were detected using SB analysis with probe StB12.3, labeled with Dig-11-dUTP by PCR (PCR Dig Synthesis kit; Roche Diagnostics, Mannheim, Germany). Autoradiography was performed with intensifying screens and Fuji Medical X-Ray film (FUJIFILM Medical Systems, Stamford, CT), and FMR1 methylation values for the expanded alleles were calculated as previously described.2,37 The FMR1 ARs for female samples represented the ratio of density (optically scanned) of the 2.8-kb band/combined densities of the 2.8- and 5.2-kb bands, where the 2.8-kb band represents the proportion of normal active X and the 5.2-kb band represents the proportion of normal inactive (methylated) X.2
MALDI-TOF Methylation Analysis
FREE1 and FREE2 DNA sequences are listed in Supplemental Figure S1 (available at http://jmd.amjpathol.org). FREE1 and FREE2 methylation analysis was performed using the MALDI-TOF mass spectrometry (MS) EpiTYPER system, as previously detailed.26 DNA was extracted from one control and one fragile X male lymphoblast cell line. The DNA samples were mixed as different ratios, and many aliquots were made. Each time methylation analysis was performed using MALDI-TOF MS, these same spiked samples, together with six additional (three HC and three FXS) samples, were included as controls, as in Figure 3 of the study by Godler et al.26 The DNA from these six additional control samples and spiked samples underwent bisulfite conversion, PCR amplification, and a mass-cleave reaction, together with the test samples within each plate. Each run produced standard curves (see Supplemental Figures S2 and S3 at http://jmd.amjpathol.org). The results for the spiked samples and the six control samples provided intrarun and interrun quality control data. Furthermore, two separate bisulfite conversion reactions were made for each test sample, each amplified with a separate PCR. For each PCR, a single mass-cleave reaction was performed. Thus, FREE MALDI-TOF analysis of one DNA sample using our protocol would result in two separate MORs. These two output measures that reflected complete technical variation related to every step of the procedure (including bisulfite conversion and PCR) had to be within 35% of their mean; otherwise, they were rejected from further analysis.
Figure 3.

The relationship between methylation of specific CpG units within FREE2 and the proportion of FMRP-positive cells in the blood of PM and FM females. MORs for CpG units from 1 to 12 were negatively correlated with the FMRP expression in the combined cohort of 12 PM and 22 FM females. (Black diamonds indicate FM; white diamonds indicate PM.) A: CpG1. B: CpG2. C: CpG 6/7. D: CpG 8/9. E: CpG 10 to 12. An analysis of CpG sites 6 and 7 and CpG sites 8 and 9 showed fragment sizes that overlapped using MALDI-TOF analysis and were expressed as the mean CpG unit methylation value of two sites presented as CpG units 6/7 and 8/9, respectively. The fragment sizes for CpG sites 8, 9, and 10 also overlapped and were presented as the CpG unit 10–12 denominations, representing mean methylation across the three sites. The broken lines represent the methylation range (mean ± SD) for each CpG unit in HC females, which is listed in Table 1.
The bisulfite treatment was performed on 0.5 μg of genomic DNA per sample using the MethylEasy XCEED kit (Human Genetic Signatures, Sydney, Australia). PCR, in vitro transcription, and mass-cleave reactions for FREE1 and FREE2 amplicons were performed using previously described protocols.26
Statistical Analysis
The relationships between methylation values and FMRP expression were assessed using simple linear regression. The analyses were conducted using the publicly available R statistical computing package (The R Project for Statistical Computing, http://www.r-project.org, last accessed February 19, 2009).
Results
Validation of MORs for Individual CpG Sites
The quality of raw data from spectra of the FXS versus HC spiking experiment and the automatic output from EpiTYPER 1.0.5 software for each site analyzed are presented in Figure 1. The sequence locations are indicated in Supplemental Figure S1 (available at http://jmd.amjpathol.org). In this experiment, lymphoblast HC DNA and FXS DNA were mixed at 1:0, 2:1, 1:1, 1:2, or 0:1 ratios, corresponding to 0%, 33.3%, 50%, 66.6%, or 100% FXS DNA in the sample. The spiked DNA mixtures were bisulfite converted in duplicate reactions. Each reaction was amplified with FREE1- and FREE2-specific primers, followed by mass-cleave and fragment analysis using MALDI-TOF MS. Each FREE1 assay result provides MORs for eight separate CpG units encompassing 10 CpG sites, whereas each FREE2 assay result provides MORs for five separate CpG units encompassing 12 CpG sites. This output offers the flexibility for analysis of either specific sites or their combinations and/or each of the two regions as a whole.
Figure 1.
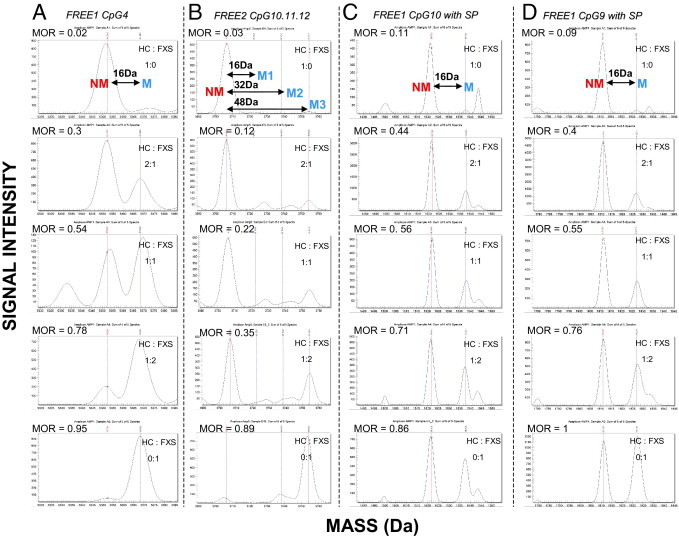
Examples of raw mass spectra for selected FREE1 and FREE2 CpG sites from spiked samples. The mass difference between the NM and M fragments for the same CpG site is 16 Da because of the presence of an adenosine residue in the place of a guanosine residue. The EpiTYPER-used software identifies peaks acceptable for analysis, which is presented in the form of the MOR.29–31 This ratio represents the relationship between M and NM peaks for the same fragments, which is analogous to total percentage of methylation.26 Herein, we present raw spectra for spiked samples included during each run used to indicate if there were any technical problems between different plates/runs and whether the results were comparable between the runs. Lymphoblast DNA from an HC male was spiked with lymphoblast DNA form a male affected with FXS at 1:0, 2:1, 1:1, 1:2, and 0:1 ratios, corresponding to 0%, 33.3%, 50%, 66.6%, and 100% (top to bottom), respectively, FXS DNA in the sample. The peaks representing fragments from UM CpG units are represented by red lines, whereas the fragments from methylated CpG units are represented by blue lines. A: CpG4 fragments with no silent peaks. B: FREE2 CpG 10, 11, and 12 fragments of the same size, with the third blue peak representing the combined mass of methylation fragments from all three sites (54 Da away from the UM peak). C: FREE1 CpG 10 fragments with a silent peak contribution evident (bottom panel). D: FREE1 CpG 9 fragments with a silent peak contribution evident (bottom panel). The corresponding MORs from these raw spectra are plotted against FXS DNA input (see Supplemental Figures S2 and S3 at http://jmd.amjpathol.org). MOR indicates methylation output ratio.
For the FREE1 CpG 4 in Figure 1A, the intensity of the methylated (M) peak increased as the nonmethylated (NM) peak decreased with increased input of FXS DNA; this was reflected by the MOR. However, for FREE2 CpG sites 10, 11, and 12 (Figure 1B), the NM fragments were of the same mass and were, thus, considered as one unit. The M1 fragment for this unit was 16 Da heavier than the NM peak and represents the mass of one of the three CpG sites methylated. The M2 fragment was 32 Da heavier than the NM peak and represents the mass of two of the three CpG sites methylated. The M3 fragment was 48 Da heavier than the NM peak and represents the mass of all three CpG sites methylated. From Figure 1B, it is evident that, as the amount of FXS DNA increased in the mix in relation to the HC DNA, the M3 peak proportionally increased with UM decreasing, whereas M1 and M2 remained relatively the same. This suggests that FREE2 CpG sites 10, 11, and 12 follow the same pattern of methylation in the FXS DNA; these changes were represented by the EpiTYPER software–calculated MOR.
Only two units (CpGs 9 and 10) within FREE1 contained peaks of unknown origin, referred to as the silent peaks (Figure 1, C and D). Because the silent peaks have fragments that overlap in size with the NM fragment, the data from these two units should be treated with caution. However, previous bisulfite sequencing of the same region has indicated that FREE1 CpGs 9 and 10 are virtually 100% methylated in FXS males.38 This information can be used to deconstruct the silent peak intensities, because in the sample consisting of 100% FXS DNA, the silent peak contribution can be considered as the background (Figure 1, C and D). As the proportion of FXS DNA decreased, so did the intensity of the M peak for both CpGs 9 and 10 in relation to the NM peak. These changes were reflected in the adjusted MORs obtained using the EpiTYPER 1.0.5 software Silent Signal computation. The MORs for these spectra plotted against FXS DNA proportion clearly showed a correlation of approximately 1 (see Supplemental Figure S2, A and B, at http://jmd.amjpathol.org), where the known proportion of FXS DNA is presented on the x axis and the MOR is presented on the y axis. This high correlation coefficient was also evident for other sites with no silent peaks present. It was also evident that for CpG units 2 to 10 within FREE1, the relationship between observed and expected outcomes was linear, with a positive gradient close to 1 (see Supplemental Figures S2 and S3 at http://jmd.amjpathol.org), which shows that these results provide fully quantitative analysis of FXS DNA content. However, for FREE2, this relationship was nonliner and approximately exponential, demonstrating bias toward detection of NM fragments.
Relationship of FREE MALDI-TOF MS and SB Methylation Analyses with FMRP Immunostaining in Blood of PM and FM Females
We examined the relationships between the methylation output for the FREE1 and FREE2 regions and the proportion of FMRP-positive cells, determined using immunostaining in blood samples from PM and FM females. The FMRP analysis of these same samples was previously conducted as a part of another study.33 Figures 2 and 3 show that MORs for all sites, except for FREE1 CpG 1, were inversely correlated with FMRP levels. MORs for FREE1 CpGs 2, 4, 5/6, and 9 and FREE2 CpGs 6/7 and 8/9, located within FMR1 intron 1, showed significant correlation with FMRP in both the PM and FM and FM-only cohorts (Table 1).
Figure 2.

The relationship between methylation of specific CpG units within FREE1 and the proportion of FMRP-positive cells in the blood of PM and FM females. MORs for CpG units from 2 to 10 were negatively correlated with the FMRP expression in the cohort of 12 PM and 22 FM females. (Black diamonds indicate FM; white diamonds indicate PM.) Analysis of the MOR was calculated based on the sum of intensities for M/(M + UM signal), as previously described.26A: CpG1 did not show a significant correlation with FMRP expression. B: CpG2. C: CpG3. D: CpG4. E: CpG5/6. F: CpG8. G: CpG9. H: CpG10. CpG sites 5 and 6 showed fragment sizes that overlapped using MALDI-TOF analysis and were expressed as the mean methylation value, representing two sites presented as CpG unit 5/6. The broken lines represent the methylation range (mean ± SD) for each CpG unit in HC females, which is listed in Table 1.
Table 1.
Results of Simple Linear Regression Analysis between Methylation of Specific CpG Sites within the FREE1 and FREE2 Regions and FMRP Levels in Blood Samples of PM and FM Females
| HC range |
PM range |
Correlation with FMRP PM-FM cohort |
Correlation with FMRP FM-only cohort |
|||||||||
|---|---|---|---|---|---|---|---|---|---|---|---|---|
| CpG | n | Mean ± 2 SDs | HC upper threshold | n | Mean ± 2 SDs | PM upper threshold | n | R | P | n | R | P |
| FREE1 | ||||||||||||
| 1 | 19 | 0.30 ± 0.05 | 0.35 | 12 | 0.31 ± 0.05 | 0.37 | 34 | −0.11 | 0.5220 | 22 | −0.13 | 0.5530 |
| 2 | 23 | 0.46 ± 0.08 | 0.55 | 12 | 0.57 ± 0.12 | 0.66 | 34 | −0.71 | <0.0001 | 22 | −0.55 | 0.0090 |
| 3 | 23 | 0.44 ± 0.13 | 0.59 | 12 | 0.61 ± 0.10 | 0.66 | 33 | −0.49 | 0.0037 | 21 | −0.41 | 0.0660 |
| 4 | 23 | 0.49 ± 0.08 | 0.59 | 12 | 0.62 ± 0.12 | 0.76 | 34 | −0.78 | <0.0001 | 22 | −0.67 | 0.0006 |
| 5/6 | 23 | 0.42 ± 0.12 | 0.54 | 12 | 0.45 ± 0.10 | 0.52 | 33 | −0.65 | <0.0001 | 21 | −0.61 | 0.0030 |
| 8 | 12 | 0.50 ± 0.22 | 0.82 | 11 | 0.56 ± 0.42 | 0.86 | 31 | −0.51 | 0.0030 | 20 | −0.33 | 0.1550 |
| 9 | 22 | 0.48 ± 0.17 | 0.68 | 10 | 0.50 ± 0.18 | 0.64 | 31 | −0.58 | 0.0006 | 21 | −0.42 | 0.0560 |
| 10 | 11 | 0.66 ± 0.30 | 0.85 | 11 | 0.54 ± 0.19 | 0.70 | 27 | −0.40 | 0.0400 | 16 | −0.47 | 0.0680 |
| Mean | 23 | 0.48 ± 0.21 | 0.61 | 12 | 0.56 ± 0.08 | 0.63 | 34 | −0.71 | <0.0001 | 22 | −0.56 | 0.0069 |
| FREE2 | ||||||||||||
| 1 | 11 | 0.24 ± 0.05 | 0.28 | 10 | 0.30 ± 0.14 | 0.38 | 28 | −0.66 | 0.0002 | 18 | −0.46 | 0.0550 |
| 2 | 10 | 0.14 ± 0.09 | 0.21 | 8 | 0.22 ± 0.10 | 0.31 | 23 | −0.53 | 0.0095 | 15 | −0.37 | 0.1780 |
| 6/7 | 10 | 0.37 ± 0.04 | 0.41 | 11 | 0.36 ± 0.14 | 0.43 | 29 | −0.70 | <0.0001 | 18 | −0.57 | 0.0140 |
| 8/9 | 11 | 0.27 ± 0.08 | 0.33 | 10 | 0.27 ± 0.12 | 0.36 | 29 | −0.72 | <0.0001 | 19 | −0.55 | 0.0140 |
| 10–12 | 11 | 0.25 ± 0.06 | 0.32 | 9 | 0.28 ± 0.14 | 0.35 | 27 | −0.64 | 0.0002 | 18 | −0.45 | 0.0640 |
| Mean | 11 | 0.25 ± 0.06 | 0.31 | 11 | 0.30 ± 0.12 | 0.40 | 33 | −0.61 | 0.0001 | 22 | −0.45 | 0.0340 |
The methylation ranges for each CpG site for the HC and PM cohorts and upper thresholds (representing highest methylation values) for these groups have been included. The R and P values for MORs of CpG units that showed significant correlation with FMRP in both the PM and FM, as well as FM only cohorts, are highlighted in bold.
We have previously reported a highly significant correlation between the mean MORs across FREE1 and FREE2 regions and FMRP in blood samples of UM and partially methylated FM males.26 This study expanded the methylation and FMRP analyses to the combined cohort of PM and FM females. In the female sample, we found clear differences for specific CpG units in their relationship between methylation and FMRP expression. Specifically, FREE1 CpGs 3 and 4 (Figure 2, C and D) and, to a lesser extent, CpG 2 (Figure 2B) showed highly skewed methylation in the PM females for most samples. Apart from a few outliers, this degree of skewed methylation was not evident for any of the FREE2 sites; most PM MORs were within the normal range (Figure 3).
We have also presented FREE1 and FREE2 data as mean MORs across each whole region, rather than specific CpG units (Figure 4, A and B), where the output for every CpG unit included is weighed equally. The mean MOR values for FREE 1 (CpGs 2 to 10) and FREE2 (CpGs 1 to 12) were clearly superior to the methylation-sensitive SB AR as predictors of the proportion of FMRP-positive cells, as shown in the combined cohort of PM and FM alleles. In contrast, by using the FM-only cohort, the methylation-sensitive SB AR showed stronger correlation with FMRP than the mean MOR of the FREE1 and FREE2 regions.
Figure 4.

The correlation between FREE region methylation and FMRP immunostaining in blood of the combined PM and FM cohort of females and between the FMR1 AR and FMRP. A: The relationship between mean methylation across CpG units 2 to 10 of FREE1 and FMRP immunostaining in blood. B: The relationship between mean methylation across CpG units 1 to 12 of FREE2 and FMRP immunostaining in blood. C: The relationship between FMR1 AR, determined using methylation-sensitive (NruI site) SB analysis and FMRP immunostaining in blood. Simple linear regression was performed for A–C on the combined cohort of PM and FM females and on only the FM cohort. Black diamonds indicate FM; white diamonds indicate PM.
Interpretation of FREE MALDI-TOF MS Data
We examined whether site-specific methylation analysis was superior to averaging methylation across multiple sites. For FREE1, it is evident from Table 1 that mean FREE1 methylation was highly correlated with FMRP in the PM-FM cohort and in the FM-only cohort, whereas only FREE1 CpG 4 showed a correlation with FMRP expression that was slightly stronger than that with mean FREE1 methylation. However, CpG 4 also showed severe skewing of methylation for PM samples, whereas this skewing was nullified in the mean FREE1 methylation analysis, as evident from comparison between HC and PM upper thresholds. Because the clinical significance of site-specific skewing in FREE1 is as yet unclear, averaging methylation from sites 2 to 10 within the FREE1 region seems to give a more appropriate predictor of FMRP depletion in FM females than considering specific FREE1 sites individually.
In contrast to FREE1, FREE2 showed no evidence for site-specific methylation skewing in the PM cohort. Of the sites examined, CpGs 6/7 and 8/9 showed a correlation with FMRP expression that was much stronger than with mean FREE2 methylation in either the PM-FM or the FM-only cohort. Thus, we recommend that for FREE2 analysis, MORs for CpG 6/7 and 8/9 sites are more appropriate than averaging methylation from all FREE2 sites within the region.
The HC and PM upper threshold ranges in Table 1 can also be used to determine what level of methylation should be considered abnormal. Almost half of FM alleles showed methylation values outside the PM upper threshold, approaching 0.6 for FREE1 and 0.4 for FREE2. Because PM carriers do not generally show FMRP deficiency, these PM thresholds may be useful to differentiate low- from high-functioning FM females, where low-functioning status reflects a deficit in FMRP expression.
Discussion
Our results have characterized the MALDI-TOF MS EpiTYPER system as applied to fragile X testing of females. One feature of the system is the ability to accurately determine the overall and site-specific methylation status that strongly correlates with the proportion of FMRP-positive cells in the blood of carriers of the full range of normal and expanded alleles. We have also demonstrated that differences exist between the methylation status of FREE1 and FREE2 and between the individual CpGs within each of these two regions and that the differential methylation of the FMR1 intron 1 sequences within FREE2 may have predictive value for FXS in female carriers of expanded alleles.
The nonuniformity of methylation across different CpG sites of the FREE regions appears to be consistent with variation of methylation within the classic FMR1 CpG island. The latter was previously reported to be most pronounced at consensus binding sequences involved in regulation of FMR1 expression.22 The significance of this variation within FREE regions and its relevance to regulation of FMR1 activity are yet to be investigated.
The existing threshold of 200 repeats, which distinguishes FM and PM alleles, is based on hypermethylation of the classic CpG island but may not necessarily hold for all sites within FREE regions. This is especially relevant to females carrying PM alleles, which have been UM using methylation-sensitive SB for CpG sites of the classic FMR1 CpG island.39 Most PM females show methylation of FREE1 CpGs 2, 3, and 4 well above the normal range. In contrast to PM females, we have previously observed that FREE1 CpG 2, 3, and 4 sites were hypomethylated in PM males and in male and female carriers of the normal-sized alleles.26 This suggests that the effect of the CGG expansion within the PM range on these sites may be specific to females, possibly through a trans effect on methylation of the analogous sites on another X chromosome. The biological significance of this site-specific skewing warrants further study by relating this phenomenon to the level of FMR1 expression and clinical phenotypes of previously described FMR1-associated disorders.40–43
Preliminary data from the comparison of FREE1 with FREE2 suggest that differences in methylation patterns may help to understand their role in the regulation of FMRP expression. We have identified CpGs 5/6 and 9 within the FREE1 region as most informative, based on the minimal overlap of the MOR in FM samples with the HC range and on the close relationship of the site-specific MOR with the proportion of FMRP-positive cells in blood from a cohort of PM and FM females. Of these CpG sites, CpG 9 has a unique location at the 3′ end of the methylation boundary in close proximity to the (CAAAC)n repetitive element (see Supplemental Figure S1 at http://jmd.amjpathol.org). This boundary has recently been defined by Naumann et al38 and also in our earlier study,26 with FREE1 CpG 9 being equivalent to CpG 63 of Naumann et al.
In both studies, methylation shifted from the regions upstream of FREE1 (detected by amplicons 3 and 4 in our earlier publication) to the FREE1 region in FXS-affected individuals. Naumann et al38 also show that nuclear proteins bind to the border region and the FREE1 region (including CpG sites 2 and 4) and that the differential methylation of these sequences may affect the level of FMR1 expression in carriers of expanded alleles. These findings are supported by our observations of the highly significant associations between hypermethylation of FREE1 CpG 2, 4, and 9 sites and the deficit of FMRP in both FXS males26 and females, as demonstrated in the current study.
To our knowledge, this is the first report of the association of differential methylation of FMR1 intron 1 sequences with the depletion of FMRP-positive cells in blood. Of the FREE2 sites, the CpG 6/7 unit (consisting of sites 6 and 7) and the CpG 8/9 unit (consisting of sites 8 and 9) were the most informative for FM females because they showed negligible overlap with the normal range and strong associations with the depletion of FMRP-positive cells in blood. Notably, these units are located in close proximity to the putative GATA1 and GATA2 binding sites (see Supplemental Figure S1 at http://jmd.amjpathol.org), at the 5′ end of intron 1, which has not previously been recognized to have diagnostic significance in FXS.
Our finding that the SB AR was highly predictive of the proportion of FMRP-positive cells in blood in the FM-only cohort is consistent with earlier findings.25 However, a limitation of both of these studies relates to the method of FMRP assessment, which does not allow for determination of the absolute quantity of FMRP in blood samples. Nevertheless, the proportion of FMRP-positive cells determined using this method was highly negatively correlated with the severity of cognitive impairment and physical phenotype of FXS in both males and females.33,44–46 These data also suggest that the proportion of FMRP-positive cells and methylation assessed in blood are fairly representative of these measures in the brain.
An alternative way to assess FMRP levels in blood is using Western blot analysis, as done by Kaufmann et al3 (Figure 4B in their study). This study reported a marginally significant relationship between the levels of FMRP expression and the AR measured by SB (r = 0.5, P = 0.03, n = 19) in PM and FM females. However, if the data from individuals with ARs between 0.3 and 0.9 are matched between Kaufmann et al3 and this study, there was no significant association. In contrast, in our study, methylation analysis of the FREE regions showed strong correlations with FMRP expression in PM and FM females for this intermediate AR range. Thus, considering results from both of these studies, methylation-sensitive SB appears limited as a predictor of FMRP expression measured by either Western blot analysis or immunohistochemistry.
Furthermore, almost half of FM alleles showed methylation values outside the PM upper threshold, approaching 0.6 for FREE1 and 0.4 for FREE2; therefore, these PM thresholds may be useful to differentiate low- from high-functioning FM females. For SB, ARs of PM alleles overlap with values for most (88%) of FM samples; thus, there is no apparent PM threshold that may be used to differentiate low- from high-functioning FM females.
We have previously recommended the use of MALDI-TOF MS for FXS newborn screening26 based on low cost, minimal DNA quality and quantity requirements, high specificity for pathogenic FM alleles in males and females, and conformation with current newborn screening ethical requirements. In addition to these features, the EpiTYPER system used in this study allows for two spectrochips to be run simultaneously, which equates to 768 samples per run, with a processing time of 1.5 hours per run. This enables the system to perform up to five runs per day with the throughput of approximately 4000 samples, making it an ideal technology for an FXS newborn screening program. Thus, a major potential application of our FREE assays may be in newborn or early childhood screening to enable early treatment and/or intervention.47 Furthermore, if our method is combined with any of the latest CGG-based tests, it can be used to detect all categories of FMR1 alleles in relation to methylation status and expansion size,6–8 without the need for SB. This may be particularly relevant to PM-FM mosaics (in which the methylated FM allele is on the active X chromosome), which comprise many carriers.2
In summary, we provide suggestions for MALDI-TOF MS data interpretation, in which a PM upper MOR threshold of approximately 0.4 for FREE2 CpG 6/7 and 8/9 intronic sites can be used to distinguish between low- and high-functioning FM females, determined by FMRP expression. Further testing of large sample cohorts will be required to establish the cutoffs that are based on phenotypic outcomes in FM carriers, for use of MALDI-TOF MS in FXS diagnostics.
Acknowledgments
We thank Dr. Annette Taylor and Debbie Hennerich (Kimball Genetics, a Division of LabCorp) for fragile X PCR and Southern blot analysis, FMRP testing, and case coordination. We also thank the study participants and their families for their contribution; Louise Hills and Con Ngo (Victorian Clinical Genetic Services Cytogenetics Laboratory, Murdoch Childrens Research Institute) for acquisition of patients' CGG expansion size data; Dr. Benjamin Ong (Sequenom Platform Facility, Murdoch Childrens Research Institute) for assistance with MALDI-TOF MS applications; and Dr. Flora Tassone (Department of Biochemistry and Molecular Medicine, University of California at Davis, School of Medicine, Sacramento, California) for critical review of the manuscript.
Footnotes
Supported by a National Health and Medical Research Council development grant (1017263 to D.E.G. and H.R.S.), an E. W. Al Thrasher Award (D.E.G., H.R.S., R.H., and D.Z.L.), a grant from the National Institute of Child Health and Human Development (HD36071 to R.H. and D.Z.L.), and a National Health and Medical Research Council project grant (330400 to D.Z.L.).
Disclosure: R.H. has received funding from Novartis, Roche, Seaside Therapeutics, Forest, Johnson and Johnson, Neuropharm, and Curemark for clinical trials.
Supplemental material for this article can be found at http://jmd.amjpathol.org or at doi: 10.1016/j.jmoldx.2011.05.006.
Supplementary data
The position of specific CpG sites analyzed within the FREE1 and FREE2 regions and their locations on the FMR1 gene (sequence numbering from GenBank L29074 and L38501). Primers used for MALDI-TOF methylation analysis targeted FREE1 and FREE2 regions at the Xq27.3 locus. Individual CpG sites within each amplicon are numbered accordingly. The 3′ end of the FMR1 exon 1 and the beginning of intron 1 are indicated by >>. Putative transcription factor binding sites and methylation-sensitive restriction enzyme recognition sites within these regions are indicated between the lines. The (CGG)n expansion starts 318 base pairs 3′ from the end of FREE1 and 88 base pairs 5′ from the beginning of FREE2.26
A spiking experiment indicating the quantification limits of MALDI-TOF methylation analysis of FXS DNA for each CpG site of the FREE1 region. HC DNA was spiked with FXS DNA at 1:0, 2:1, 1:1, 1:2, and 0:1 ratios, corresponding to 0%, 33.3%, 50%, 66.6%, and 100%, respectively, FXS DNA in the sample. The M versus UM ratios at each analyzable CpG unit were expressed as MORs on the y axis, with FXS DNA input percentage expressed on the x axis (each point represents the mean of duplicate PCRs, each from a single bisulfite-converted DNA mixture). A: CpG 1. B: CpG 2. C: CpG 3. D: CpG 4. E: Average methylation between overlapping fragments for CpG 5/6. F: CpG 8. G: CpG 9 (with a silent peak of overlapping mass to the UM fragment). H: CpG 10 (with a silent peak of overlapping mass to the UM fragment). For D, G, and H, raw spectra are included in Figure 1.
A spiking experiment indicating the quantification limits of MALDI-TOF methylation analysis of FXS DNA for each CpG site of the FREE2 region. HC DNA was spiked with FXS DNA at 1:0, 2:1, 1:1, 1:2, or 0:1 ratios, corresponding to 0%, 33.3%, 50%, 66.6%, or 100%, respectively, FXS DNA in the sample. The M versus UM ratios at each analyzable CpG unit were expressed as MORs on the y axis, with the FXS DNA input percentage expressed on the x axis (each point represents the mean of duplicate PCRs, with each PCR from a single bisulfite-converted DNA mixture). A: CpG 1. B: CpG 2. C: Average methylation between overlapping fragments for CpGs 6/7. D: Average methylation between overlapping fragments for CpGs 8/9. E: Average methylation between overlapping fragments for CpGs 10–12. For E, raw spectra are included in Figure 1.
References
- 1.Pieretti M., Zhang F.P., Fu Y.H., Warren S.T., Oostra B.A., Caskey C.T., Nelson D.L. Absence of expression of the FMR-1 gene in fragile X syndrome. Cell. 1991;66:817–822. doi: 10.1016/0092-8674(91)90125-i. [DOI] [PubMed] [Google Scholar]
- 2.de Vries B.B., Wiegers A.M., Smits A.P., Mohkamsing S., Duivenvoorden H.J., Fryns J.P., Curfs L.M., Halley D.J., Oostra B.A., van den Ouweland A.M., Niermeijer M.F. Mental status of females with an FMR1 gene full mutation. Am J Hum Genet. 1996;58:1025–1032. [PMC free article] [PubMed] [Google Scholar]
- 3.Kaufmann W.E., Abrams M.T., Chen W., Reiss A.L. Genotype, molecular phenotype, and cognitive phenotype: correlations in fragile X syndrome. Am J Med Genet. 1999;83:286–295. [PubMed] [Google Scholar]
- 4.Irwin S.A., Galvez R., Greenough W.T. Dendritic spine structural anomalies in fragile-X mental retardation syndrome. Cereb Cortex. 2000;10:1038–1044. doi: 10.1093/cercor/10.10.1038. [DOI] [PubMed] [Google Scholar]
- 5.Hallahan B.P., Craig M.C., Toal F., Daly E.M., Moore C.J., Ambikapathy A., Robertson D., Murphy K.C., Murphy D.G. In vivo brain anatomy of adult males with fragile X syndrome: an MRI study. Neuroimage. 2011;54:16–24. doi: 10.1016/j.neuroimage.2010.08.015. [DOI] [PubMed] [Google Scholar]
- 6.Filipovic-Sadic S., Sah S., Chen L., Krosting J., Sekinger E., Zhang W., Hagerman P.J., Stenzel T.T., Hadd A., Latham G.J., Tassone F. A novel FMR1 PCR method for the routine detection of low-abundance expanded alleles and full mutations in fragile X syndrome. Clin Chem. 2010;56:399–408. doi: 10.1373/clinchem.2009.136101. [DOI] [PMC free article] [PubMed] [Google Scholar]
- 7.Hantash F.M., Goos D.G., Tsao D., Quan F., Buller-Burckle A., Peng M., Jarvis M., Sun W., Strom C.M. Qualitative assessment of FMR1 (CGG)n triplet repeat status in normal, intermediate, premutation, full mutation, and mosaic carriers in both sexes: implications for fragile X syndrome carrier and newborn screening. Genet Med. 2010;12:162–173. doi: 10.1097/GIM.0b013e3181d0d40e. [DOI] [PubMed] [Google Scholar]
- 8.Lyon E., Laver T., Yu P., Jama M., Young K., Zoccoli M., Marlowe N. A simple, high-throughput assay for fragile X expanded alleles using triple repeat primed PCR and capillary electrophoresis. J Mol Diagn. 2010;12:505–511. doi: 10.2353/jmoldx.2010.090229. [DOI] [PMC free article] [PubMed] [Google Scholar]
- 9.Tassone F., Pan R., Amiri K., Taylor A.K., Hagerman P.J. A rapid polymerase chain reaction-based screening method for identification of all expanded alleles of the fragile X (FMR1) gene in newborn and high-risk populations. J Mol Diagn. 2008;10:43–49. doi: 10.2353/jmoldx.2008.070073. [DOI] [PMC free article] [PubMed] [Google Scholar]
- 10.Taylor A.K., Safanda J.F., Fall M.Z., Quince C., Lang K.A., Hull C.E., Carpenter I., Staley L.W., Hagerman R.J. Molecular predictors of cognitive involvement in female carriers of fragile X syndrome. JAMA. 1994;271:507–514. [PubMed] [Google Scholar]
- 11.Hagerman R.J., Hull C.E., Safanda J.F., Carpenter I., Staley L.W., O'Connor R.A., Seydel C., Mazzocco M.M., Snow K., Thibodeau S.N., Kuh D., Nelson D.L., Caskey C.T., Annette K.T. High functioning fragile X males: demonstration of an unmethylated fully expanded FMR-1 mutation associated with protein expression. Am J Med Genet. 1994;51:298–308. doi: 10.1002/ajmg.1320510404. [DOI] [PubMed] [Google Scholar]
- 12.Hornstra I.K., Nelson D.L., Warren S.T., Yang T.P. High resolution methylation analysis of the FMR1 gene trinucleotide repeat region in fragile X syndrome. Hum Mol Genet. 1993;2:1659–1665. doi: 10.1093/hmg/2.10.1659. [DOI] [PubMed] [Google Scholar]
- 13.Boyd V.L., Moody K.I., Karger A.E., Livak K.J., Zon G., Burns J.W. Methylation-dependent fragment separation: direct detection of DNA methylation by capillary electrophoresis of PCR products from bisulfite-converted genomic DNA. Anal Biochem. 2006;354:266–273. doi: 10.1016/j.ab.2006.04.009. [DOI] [PubMed] [Google Scholar]
- 14.Nygren A.O., Lens S.I., Carvalho R. Methylation-specific multiplex ligation-dependent probe amplification enables a rapid and reliable distinction between male FMR1 premutation and full-mutation alleles. J Mol Diagn. 2008;10:496–501. doi: 10.2353/jmoldx.2008.080053. [DOI] [PMC free article] [PubMed] [Google Scholar]
- 15.Zhou Y., Lum J.M., Yeo G.H., Kiing J., Tay S.K., Chong S.S. Simplified molecular diagnosis of fragile X syndrome by fluorescent methylation-specific PCR and GeneScan analysis. Clin Chem. 2006;52:1492–1500. doi: 10.1373/clinchem.2006.068593. [DOI] [PubMed] [Google Scholar]
- 16.Dahl C., Gronskov K., Larsen L.A., Guldberg P., Brondum-Nielsen K. A homogeneous assay for analysis of FMR1 promoter methylation in patients with fragile X syndrome. Clin Chem. 2007;53:790–793. doi: 10.1373/clinchem.2006.080762. [DOI] [PubMed] [Google Scholar]
- 17.Dahl C., Guldberg P. High-resolution melting for accurate assessment of DNA methylation. Clin Chem. 2007;53:1877–1878. doi: 10.1373/clinchem.2007.094854. [DOI] [PubMed] [Google Scholar]
- 18.Dahl C., Guldberg P. A ligation assay for multiplex analysis of CpG methylation using bisulfite-treated DNA. Nucleic Acids Res. 2007;35:e144. doi: 10.1093/nar/gkm984. [DOI] [PMC free article] [PubMed] [Google Scholar]
- 19.Weisenberger D.J., Campan M., Long T.I., Kim M., Woods C., Fiala E., Ehrlich M., Laird P.W. Analysis of repetitive element DNA methylation by MethyLight. Nucleic Acids Res. 2005;33:6823–6836. doi: 10.1093/nar/gki987. [DOI] [PMC free article] [PubMed] [Google Scholar]
- 20.Weinhausel A., Haas O.A. Evaluation of the fragile X (FRAXA) syndrome with methylation-sensitive PCR. Hum Genet. 2001;108:450–458. doi: 10.1007/s004390100519. [DOI] [PubMed] [Google Scholar]
- 21.Coffee B., Keith K., Albizua I., Malone T., Mowrey J., Sherman S.L., Warren S.T. Incidence of fragile X syndrome by newborn screening for methylated FMR1 DNA. Am J Hum Genet. 2009;85:503–514. doi: 10.1016/j.ajhg.2009.09.007. [DOI] [PMC free article] [PubMed] [Google Scholar]
- 22.Stoger R., Kajimura T.M., Brown W.T., Laird C.D. Epigenetic variation illustrated by DNA methylation patterns of the fragile-X gene FMR1. Hum Mol Genet. 1997;6:1791–1801. doi: 10.1093/hmg/6.11.1791. [DOI] [PubMed] [Google Scholar]
- 23.Rosales-Reynoso M.A., Vilatela E.A., Ojeda R.M., Arce-Rivas A., Sandoval L., Troyo-Sanroman R., Barros-Nunez P. PCR approach for detection of fragile X syndrome and Huntington disease based on modified DNA: limits and utility. Genet Test. 2007;11:153–159. doi: 10.1089/gte.2006.0508. [DOI] [PubMed] [Google Scholar]
- 24.Zhou Y., Law H.Y., Boehm C.D., Yoon C.S., Cutting G.R., Ng I.S., Chong S.S. Robust fragile X (CGG)n genotype classification using a methylation specific triple PCR assay. J Med Genet. 2004;41:e45. doi: 10.1136/jmg.2003.012716. [DOI] [PMC free article] [PubMed] [Google Scholar]
- 25.Tassone F., Hagerman R.J., Ikle D.N., Dyer P.N., Lampe M., Willemsen R., Oostra B.A., Taylor A.K. FMRP expression as a potential prognostic indicator in fragile X syndrome. Am J Med Genet. 1999;84:250–261. [PubMed] [Google Scholar]
- 26.Godler D.E., Tassone F., Loesch D.Z., Taylor A.K., Gehling F., Hagerman R.J., Burgess T., Ganesamoorthy D., Hennerich D., Gordon L., Evans A., Choo K.H., Slater H.R. Methylation of novel markers of fragile X alleles is inversely correlated with FMRP expression and FMR1 activation ratio. Hum Mol Genet. 2010;19:1618–1632. doi: 10.1093/hmg/ddq037. [DOI] [PMC free article] [PubMed] [Google Scholar]
- 27.Godler D.E., Slater H.R., Amor D., Loesch D.Z. Methylation analysis of fragile X related epigenetic elements may provide a suitable newborn screening test for fragile X syndrome. Med Genet. 2010;12:595. doi: 10.1097/GIM.0b013e3181f07088. [DOI] [PMC free article] [PubMed] [Google Scholar]
- 28.Pietrobono R., Pomponi M.G., Tabolacci E., Oostra B., Chiurazzi P., Neri G. Quantitative analysis of DNA demethylation and transcriptional reactivation of the FMR1 gene in fragile X cells treated with 5-azadeoxycytidine. Nucleic Acids Res. 2002;30:3278–3285. doi: 10.1093/nar/gkf434. [DOI] [PMC free article] [PubMed] [Google Scholar]
- 29.Kim J.B., Sebastiano V., Wu G., Arauzo-Bravo M.J., Sasse P., Gentile L., Ko K., Ruau D., Ehrich M., van den Boom D., Meyer J., Hubner K., Bernemann C., Ortmeier C., Zenke M., Fleischmann B.K., Zaehres H., Scholer H.R. Oct4-induced pluripotency in adult neural stem cells. Cell. 2009;136:411–419. doi: 10.1016/j.cell.2009.01.023. [DOI] [PubMed] [Google Scholar]
- 30.Coolen M.W., Stirzaker C., Song J.Z., Statham A.L., Kassir Z., Moreno C.S., Young A.N., Varma V., Speed T.P., Cowley M., Lacaze P., Kaplan W., Robinson M.D., Clark S.J. Consolidation of the cancer genome into domains of repressive chromatin by long-range epigenetic silencing (LRES) reduces transcriptional plasticity. Nat Cell Biol. 2010;12:235–246. doi: 10.1038/ncb2023. [DOI] [PMC free article] [PubMed] [Google Scholar]
- 31.Coolen M.W., Statham A.L., Gardiner-Garden M., Clark S.J. Genomic profiling of CpG methylation and allelic specificity using quantitative high-throughput mass spectrometry: critical evaluation and improvements. Nucleic Acids Res. 2007;35:e119. doi: 10.1093/nar/gkm662. [DOI] [PMC free article] [PubMed] [Google Scholar]
- 32.Ehrich M., Nelson M.R., Stanssens P., Zabeau M., Liloglou T., Xinarianos G., Cantor C.R., Field J.K., van den Boom D. Quantitative high-throughput analysis of DNA methylation patterns by base-specific cleavage and mass spectrometry. Proc Natl Acad Sci U S A. 2005;102:15785–15790. doi: 10.1073/pnas.0507816102. [DOI] [PMC free article] [PubMed] [Google Scholar]
- 33.Loesch D.Z., Huggins R.M., Hagerman R.J. Phenotypic variation and FMRP levels in fragile X. Ment Retard Dev Disabil Res Rev. 2004;10:31–41. doi: 10.1002/mrdd.20006. [DOI] [PubMed] [Google Scholar]
- 34.Willemsen R., Mohkamsing S., de Vries B., Devys D., van den Ouweland A., Mandel J.L., Galjaard H., Oostra B. Rapid antibody test for fragile X syndrome. Lancet. 1995;345:1147–1148. doi: 10.1016/s0140-6736(95)90979-6. [DOI] [PubMed] [Google Scholar]
- 35.Loesch D.Z., Huggins R.M., Taylor A.K. Application of robust pedigree analysis in studies of complex genotype-phenotype relationships in fragile X syndrome. Am J Med Genet. 2002;107:136–142. doi: 10.1002/ajmg.10129. [DOI] [PubMed] [Google Scholar]
- 36.Khaniani M.S., Kalitsis P., Burgess T., Slater H.R. An improved diagnostic PCR assay for identification of cryptic heterozygosity for CGG triplet repeat alleles in the fragile X gene (FMR1) Mol Cytogenet. 2008;1:5. doi: 10.1186/1755-8166-1-5. [DOI] [PMC free article] [PubMed] [Google Scholar]
- 37.Tassone F., Hagerman R.J., Chamberlain W.D., Hagerman P.J. Transcription of the FMR1 gene in individuals with fragile X syndrome. Am J Med Genet. 2000;97:195–203. doi: 10.1002/1096-8628(200023)97:3<195::AID-AJMG1037>3.0.CO;2-R. [DOI] [PubMed] [Google Scholar]
- 38.Naumann A., Hochstein N., Weber S., Fanning E., Doerfler W. A distinct DNA-methylation boundary in the 5′-upstream sequence of the FMR1 promoter binds nuclear proteins and is lost in fragile X syndrome. Am J Hum Genet. 2009;85:606–616. doi: 10.1016/j.ajhg.2009.09.018. [DOI] [PMC free article] [PubMed] [Google Scholar]
- 39.Tassone F., Hagerman R.J., Taylor A.K., Gane L.W., Godfrey T.E., Hagerman P.J. Elevated levels of FMR1 mRNA in carrier males: a new mechanism of involvement in the fragile-X syndrome. Am J Hum Genet. 2000;66:6–15. doi: 10.1086/302720. [DOI] [PMC free article] [PubMed] [Google Scholar]
- 40.Hagerman R.J., Leehey M., Heinrichs W., Tassone F., Wilson R., Hills J., Grigsby J., Gage B., Hagerman P.J. Intention tremor, parkinsonism, and generalized brain atrophy in male carriers of fragile X. Neurology. 2001;57:127–130. doi: 10.1212/wnl.57.1.127. [DOI] [PubMed] [Google Scholar]
- 41.Greco C.M., Hagerman R.J., Tassone F., Chudley A.E., Del Bigio M.R., Jacquemont S., Leehey M., Hagerman P.J. Neuronal intranuclear inclusions in a new cerebellar tremor/ataxia syndrome among fragile X carriers. Brain. 2002;125:1760–1771. doi: 10.1093/brain/awf184. [DOI] [PubMed] [Google Scholar]
- 42.Allingham-Hawkins D.J., Babul-Hirji R., Chitayat D., Holden J.J., Yang K.T., Lee C. Fragile X premutation is a significant risk factor for premature ovarian failure: the International Collaborative POF in Fragile X study–preliminary data. Am J Med Genet. 1999;83:322–325. [PMC free article] [PubMed] [Google Scholar]
- 43.Sullivan A.K., Marcus M., Epstein M.P., Allen E.G., Anido A.E., Paquin J.J., Yadav-Shah M., Sherman S.L. Association of FMR1 repeat size with ovarian dysfunction. Hum Reprod. 2005;20:402–412. doi: 10.1093/humrep/deh635. [DOI] [PubMed] [Google Scholar]
- 44.Loesch D.Z., Huggins R., Hay D.A., Gedeon A.K., Mulley J.C., Sutherland G.R. Genotype-phenotype relationships in fragile X syndrome: a family study. Am J Hum Genet. 1993;53:1064–1073. [PMC free article] [PubMed] [Google Scholar]
- 45.Loesch D.Z., Bui Q.M., Dissanayake C., Clifford S., Gould E., Bulhak-Paterson D., Tassone F., Taylor A.K., Hessl D., Hagerman R., Huggins R.M. Molecular and cognitive predictors of the continuum of autistic behaviours in fragile X. Neurosci Biobehav Rev. 2007;31:315–326. doi: 10.1016/j.neubiorev.2006.09.007. [DOI] [PMC free article] [PubMed] [Google Scholar]
- 46.Loesch D.Z., Huggins R.M., Bui Q.M., Epstein J.L., Taylor A.K., Hagerman R.J. Effect of the deficits of fragile X mental retardation protein on cognitive status of fragile x males and females assessed by robust pedigree analysis. J Dev Behav Pediatr. 2002;23:416–423. doi: 10.1097/00004703-200212000-00004. [DOI] [PubMed] [Google Scholar]
- 47.Hagerman R.J., Berry-Kravis E., Kaufmann W.E., Ono M.Y., Tartaglia N., Lachiewicz A., Kronk R., Delahunty C., Hessl D., Visootsak J., Picker J., Gane L., Tranfaglia M. Advances in the treatment of fragile X syndrome. Pediatrics. 2009;123:378–390. doi: 10.1542/peds.2008-0317. [DOI] [PMC free article] [PubMed] [Google Scholar]
Associated Data
This section collects any data citations, data availability statements, or supplementary materials included in this article.
Supplementary Materials
The position of specific CpG sites analyzed within the FREE1 and FREE2 regions and their locations on the FMR1 gene (sequence numbering from GenBank L29074 and L38501). Primers used for MALDI-TOF methylation analysis targeted FREE1 and FREE2 regions at the Xq27.3 locus. Individual CpG sites within each amplicon are numbered accordingly. The 3′ end of the FMR1 exon 1 and the beginning of intron 1 are indicated by >>. Putative transcription factor binding sites and methylation-sensitive restriction enzyme recognition sites within these regions are indicated between the lines. The (CGG)n expansion starts 318 base pairs 3′ from the end of FREE1 and 88 base pairs 5′ from the beginning of FREE2.26
A spiking experiment indicating the quantification limits of MALDI-TOF methylation analysis of FXS DNA for each CpG site of the FREE1 region. HC DNA was spiked with FXS DNA at 1:0, 2:1, 1:1, 1:2, and 0:1 ratios, corresponding to 0%, 33.3%, 50%, 66.6%, and 100%, respectively, FXS DNA in the sample. The M versus UM ratios at each analyzable CpG unit were expressed as MORs on the y axis, with FXS DNA input percentage expressed on the x axis (each point represents the mean of duplicate PCRs, each from a single bisulfite-converted DNA mixture). A: CpG 1. B: CpG 2. C: CpG 3. D: CpG 4. E: Average methylation between overlapping fragments for CpG 5/6. F: CpG 8. G: CpG 9 (with a silent peak of overlapping mass to the UM fragment). H: CpG 10 (with a silent peak of overlapping mass to the UM fragment). For D, G, and H, raw spectra are included in Figure 1.
A spiking experiment indicating the quantification limits of MALDI-TOF methylation analysis of FXS DNA for each CpG site of the FREE2 region. HC DNA was spiked with FXS DNA at 1:0, 2:1, 1:1, 1:2, or 0:1 ratios, corresponding to 0%, 33.3%, 50%, 66.6%, or 100%, respectively, FXS DNA in the sample. The M versus UM ratios at each analyzable CpG unit were expressed as MORs on the y axis, with the FXS DNA input percentage expressed on the x axis (each point represents the mean of duplicate PCRs, with each PCR from a single bisulfite-converted DNA mixture). A: CpG 1. B: CpG 2. C: Average methylation between overlapping fragments for CpGs 6/7. D: Average methylation between overlapping fragments for CpGs 8/9. E: Average methylation between overlapping fragments for CpGs 10–12. For E, raw spectra are included in Figure 1.