

Abstract
Deletion or loss of heterozygosity (LOH) in chromosomes 1p and 19q in oligodendrogliomas (ODGs) have diagnostic, prognostic, and therapeutic implications. Current clinical assays are limited because the probes or primers interrogate only limited genomic segments. We investigated the use of single nucleotide polymorphism (SNP) arrays for identifying genomic changes in gliomas from FFPE tissues. DNA was extracted from FFPE tissues of 30 brain tumor cases (15 ODGs and 15 non-ODGs) and assayed on the Illumina array with 300,000 markers. SNP results were compared with standard short tandem repeat (STR) assays of chromosomes 1p and 19q. Fifteen ODGs had LOH by STR and deletion by array on both 1p and 19q. Ten non-ODGs had no evidence of LOH on 1p and 19q by STR, seven of which had no abnormalities for these chromosomes; three had partial deletions by SNP array. Five non-ODG cases had partial LOH or deletion by both assays. No major discordance was found between SNP array and STR results. Advantages of SNP arrays include no need for an accompanying normal sample, the ability to find small segmental deletions, the potential to distinguish between deletions and copy neutral LOH, and whole-genome screening to allow discovery of new, significant loci. Assessment of genomic changes in routine glioma specimens using SNP arrays is feasible and has great potential as an accurate clinical diagnostic test.
Gliomas are the most common primary tumors of the central nervous system in adults. The current World Health Organization classification and grading system is based on histologic features and distinguishes astrocytomas, oligodendrogliomas (ODGs), and oligoastrocytomas or mixed gliomas.1 Treatment and prognosis are largely dependent on the diagnosis. However, classification is sometimes difficult using a histopathological approach alone.
Considerable evidence suggests that acquired non-random genetic alterations could influence the diagnosis, disease progression, and response to conventional treatments of ODGs. Specifically, co-deletion of the short arm of chromosome 1 (1p) and the long arm of chromosome 19 (19q) correlates with the histologic diagnosis of classic ODG, increased chemosensitivity compared with an astrocytoma of a similar grade, and improved overall survival.2 Other markers that are used in the evaluation of adult malignant gliomas include methylation of the O-6 methylguanine-DNA methyltransferase (MGMT) gene promoter, alterations in the epidermal growth factor receptor (EGFR) pathway, and isocitrate dehydrogenase 1 (IDH1) gene mutations.2 These markers are not yet tested as a standard of care, but assessment of 1p and 19q status is widely implemented in the neuro-oncological management of patients with ODGs and anaplastic ODGs.
Currently, deletion or loss of heterozygosity (LOH) of chromosome arms 1p and 19q are tested either by fluorescence in situ hybridization (FISH) or by short tandem repeat (STR, microsatellite) analysis.3 Both assays are limited in that the probes or primers interrogate only small portions of the chromosomes, and thus small deletions can be missed or misinterpreted as involving the whole arm. Additionally, STR loci are not always informative; that is, some may be germline homozygous. In this situation, STR analysis of normal tissue from the same patient (eg, peripheral blood, buccal swab, or uninvolved brain tissue) confirm the noninformativeness of the loci but do not resolve the underlying question of LOH. Also, normal tissue often is not readily available for comparison, especially for consult cases. Furthermore, FISH can detect deletions but cannot detect copy neutral (CN)-LOH, and STR analysis cannot distinguish CN-LOH from deletions.
High-resolution array-based comparative genomic hybridization (aCGH) and single nucleotide polymorphism (SNP) array provide an alternative method for characterizing chromosomal alterations in ODGs and other glial tumors. Array-based CGH has been shown to be a useful method for detecting deletions of 1p/19q in gliomas with the added advantage of providing information regarding other genomic changes.4,5 A genome-wide association study used SNP array to identify five susceptibility loci for glioma.6 In addition, a recent meta-analysis of genome-wide CGH data of 467 cases demonstrated World Health Organization grade-specific aberration profiles in astrocytoma.7 A gain of chromosome 7 with a hot spot at 7q32 was seen frequently even in low-grade astrocytomas. Analysis of pediatric low-grade astrocytomas using Illumina HumanHap550K SNP arrays identified duplication of 7q34.8 In contrast, gains on chromosomes 7, 8q, 19q, and 20 and losses on 9p, 10, 18q, and Xp were reported to be associated with shorter overall survival in persons with oligodendroglial tumors.9 Thus array-based technology has proved to be a powerful tool for research and has great potential to become a valuable clinical diagnostic application.
The results of the aforementioned studies were obtained using DNA isolated from fresh frozen tumor tissues. However, in usual pathology practice, it is not easy to obtain frozen tissues for array-based assays. In contrast, formalin-fixed, paraffin-embedded (FFPE) tissues are almost always available. Oosting et al10 used Illumina BeadArray platform on FFPE colorectal tumor tissues and showed nearly identical patterns of genomic change to fresh frozen tissues. Recently, successful array-based molecular karyotyping using Affymetrix GeneChip Mapping on FFPE solid tumor samples has been reported.11,12 However, few studies have evaluated the performance of array-based assays on FFPE samples for brain tumors. Johnson et al13 characterized a series of 15 matched FFPE and frozen astrocytomas using a customized CGH array; however, aCGH fails to detect CN-LOH, a common mechanism of LOH in solid tumors.14 In contrast, SNP arrays allow one to determine both the copy number status and the genotype, thereby detecting regional gains/losses and CN-LOH.
In this study, we investigated the use of SNP arrays to identify genomic changes in gliomas using DNA extracted from FFPE tissues.
Materials and Methods
Tumor Samples and DNA Extraction
This study was covered under Institutional Review Board approval and comprised FFPE tissue samples from 30 brain tumor cases (15 ODGs and 15 non-ODGs) that had been submitted for routine clinical analysis of 1p/19q loss via our existing STR assay. All samples were obtained in 2010. The mean age of the patients analyzed was 42.7 years (range, 14 to 82 years). Detailed demographics are summarized in Table 1.
Table 1.
Patients and Brain Tumor Characteristics
| Variable | ODG | Non-ODG | P value |
|---|---|---|---|
| No. of cases | 15 | 15 | NS |
| Age (mean ± SEM) | 48.33 ± 4.47 | 37.7 ± 3.35 | 0.053 |
| Sex | 9 male, 6 female | 7 male, 8 female | NS |
| Diagnosis, N (%) | ODG, 9 (30%) | Fibrillary AC, 3 (10%) | NA |
| Anaplastic ODG, 5 (16.7%) | AC, 2 (6.7%) | ||
| Oligosarcoma + ODG, 1 (3.3%) | Pineal parenchymal tumor of intermediate differentiation, 1 (3.3%) | ||
| Anaplastic AC, 7 (23.3%) | |||
| Glioblastoma, 2 (6.7%) | |||
| WHO grade 2, No. (%) | 9 (30%) | 5 (16.7%) | NS |
| WHO grade 3, No. (%) | 6 (70%) | 8 (56.6%) | NS |
| WHO grade 4, No. (%) | NA | 2 (6.7%) | NA |
AC, astrocytoma; NA, not available; NS, not significant; ODG, oligodendroglioma; WHO, World Health Organization.
H&E-stained slides from FFPE tumor samples were reviewed by a pathologist (P.B.), and tumor tissue was selected for analysis. Corresponding tissue from two to five unstained, 10-μm-thick tissue sections was removed using Pinpoint reagents (ZymoResearch, Orange, CA) as previously described.3,15 Genomic DNA was extracted from the sample with use of a QIAmp DNA Kit (Qiagen, Valencia, CA) and quantified by OD at 260 nm using the NanoDrop ND-1000 (NanoDrop Technologies, Inc., Wilmington, DE).
DNA Quality Assessment
DNA qualities were determined with use of a BioScore Screening and Amplification Kit (Enzo Life Sciences, Plymouth Meeting, PA). The BioScore assay is an isothermal whole-genome amplification method that can generate more than 10 μg of DNA from 100 ng of high-quality genomic DNA. In brief, 100 ng of DNA was incubated with primers, nucleotide mix, and enzyme at 37°C. After 1 hour, 5 μL of Stop Buffer was added to the mixture. The resulting amplified DNA was purified with use of a QIAquick PCR Purification Kit (Qiagen), and yields were measured by NanoDrop (NanoDrop Technologies, Inc.) and calculated. Depending on the DNA yield, DNA quality was classified as poor, intermediate, good, or excellent (<1 μg, 1 to 3 μg, 3 to 10 μg, or >10 μg, respectively, as per the manufacturer's protocol). This assay was performed only to assess the quality of the DNA and not to generate DNA for the SNP array. However, in some instances SNP array was performed on paired specimens (nonamplified DNA and DNA amplified by BioScore) to assess performance.
STR (Microsatellite) Analysis of 1p/19q LOH
STR assay of chromosomes 1p and 19q was performed by multiplex PCR of five STR loci on chromosome 1 (D1S199, D1S186, D1S162, D1S312, and D1S226) and three loci on chromosome 19q (D19S918, D19S112, and D19S206), as previously described.3 Briefly, fluorescent-labeled PCR products were detected by capillary electrophoresis with use of the ABI 3130 Genetic Analyzer and GeneMapper software version 4 (Applied Biosystems, Carlsbad, CA). Interpretation was made by the molecular pathologist (C.D.G., J.R.E.) based on the ratio of the peak height (intensity) of the longer allele to the shorter allele at heterozygous loci.3
Illumina Infinium II SNP Array
DNA samples extracted from FFPE tissue (200 ng optimal) were run on the Illumina Infinium II SNP array with 300K markers (HumanCytoSNP-12, Illumina Inc., San Diego, CA) without any optimization or change in the manufacturer's regular protocol. For 14 cases, DNA after whole-genome amplification using a BioScore Screening and Amplification Kit (Enzo Life Sciences) also was run in parallel with DNA not subject to pre-amplification. For one case, a matched specimen from peripheral blood also was assayed by SNP array. The B allele frequency (BAF) and Log R ratio (LRR) data were analyzed using Illumina KaryoStudio software version 2.0 and CNV (copy number variation) partition V2.4.4.0. We excluded known benign copy number changes from our analysis. Moreover, only changes larger than a few megabases were considered. BAF represents the frequency of B alleles at a given SNP. LRR is the ratio between the observed and the expected probe intensity, thus indicating copy number. Deviation of LRR (Log R Dev) was used to assess noisiness of the SNP array data. SNP array results were compared with our standard clinical STR assay of chromosomes 1p and 19q. Abnormalities of other chromosomes also were analyzed, and the results were compared with pathological diagnoses.
Statistical Analysis
The χ2 test and paired Student's t-test were used to evaluate statistical significance.
Results
We analyzed SNP array data from 30 FFPE glioma specimens (Table 1). The quality of DNA extracted from FFPE tissues was assessed with use of the BioScore Screening and Amplification Kit (Enzo Life Sciences). The detailed results are shown in Table 2. The majority of cases (90%) had excellent14 or good-quality13 DNA; three cases had only intermediate-quality DNA. No poor-quality cases of DNA were found. The excellent and good-quality cases had lower SNP array noise and lower Log R Dev compared with those with intermediate-quality DNA [0.34 ± 0.026 (mean ± SEM) versus 0.45 ± 0.029 versus 0.96 ± 0.07, respectively, P < 0.0001; see also Supplemental Table S1 at http://jmd.amjpathol.org]. Overall, DNA qualities correlated well with Illumina SNP array quality determined by Log R Dev. The whole genome pre-amplified DNA samples had significantly higher deviation compared with matched non-pre-amplified samples (1.05 ± 0.33, n = 14, versus 0.44 ± 0.20, n = 14; P < 0.0001). In some cases we could not obtain the amount of DNA required for testing per the manufacturer's protocol and the input on the SNP array was less than optimal, being as low as 76 ng (optimal DNA input is 200 ng) (Table 2). The amount of DNA did not appear to affect the quality of the SNP array results, because there was no correlation between DNA input and Log R Dev. These results suggest that, for the Illumina platform, the quality of the DNA is a more important factor for successful SNP array analysis than is DNA quantity. Nevertheless, even for the microarrays with higher Log R Dev, all data were interpretable with respect to 1p and 19q (Table 2 and Figure 1).
Table 2.
Summary of Diagnosis, DNA and Array Parameters, SNP array, and STR Results for Chromosomes 1p and 19q
| Case no. | Diagnosis | DNA quality | DNA input (ng) | Log R Dev | SNP array results |
STR results |
||
|---|---|---|---|---|---|---|---|---|
| 1p | 19q | 1p | 19q | |||||
| 1 | ODG | Excellent | 200 | 0.21 | del 1p | del 19q | LOH | LOH |
| 2 | ODG | Excellent | 200 | 0.45 | del 1p | del 19q | LOH | LOH |
| 3 | ODG | Good | 180 | 0.52 | del 1p | del 19q | LOH | LOH |
| 4 | ODG | Good | 184 | 0.55 | del 1p | del 19q | LOH | LOH |
| 5 | ODG | Good | 76 | 0.39 | del 1p | del 19q | LOH | LOH |
| 6 | ODG | Good | 200 | 0.57 | del 1p | del 19q | LOH | LOH |
| 7 | ODG | Good | 200 | 0.52 | del 1p | del 19q | LOH | LOH |
| 8 | ODG | Good | 200 | 0.50 | del 1p | del 19q | LOH | LOH |
| 9 | ODG | Excellent | 120 | 0.34 | del 1p | del 19q | LOH | LOH |
| 10 | Anaplastic ODG | Intermediate | 180 | 0.98 | del 1p | del 19q | LOH | LOH |
| 11 | Anaplastic ODG | Excellent | 156 | 0.34 | del 1p | del 19q | LOH | LOH |
| 12 | Anaplastic ODG | Good | 176 | 0.35 | del 1p | del 19q | LOH | LOH |
| 13 | Anaplastic ODG | Good | 200 | 0.39 | del 1p | del 19q | LOH | LOH |
| 14 | Anaplastic ODG | Good | 200 | 0.41 | del p12→pter | del q13.11→qter | LOH | LOH |
| 15 | ODG + oligosarcoma | Excellent | 116 | 0.35 | del/CN-LOH 1p | del/CN-LOH 19q | LOH | LOH |
| 16 | Fibrillary AC | Excellent | 172 | 0.44 | No abnl | No abnl | No LOH | No LOH |
| 17 | Fibrillary AC | Good | 200 | 0.60 | No abnl | No abnl | No LOH | No LOH |
| 18 | Fibrillary AC | Intermediate | 200 | 1.07 | No abnl | No abnl | No LOH | No LOH |
| 19 | AC | Excellent | 200 | 0.51 | No abnl | No abnl | No LOH | No LOH |
| 20 | AC | Intermediate | 200 | 0.83 | No abnl | No abnl | No LOH | No LOH |
| 21 | Pineal parenchymal tumor | Excellent | 148 | 0.27 | No abnl | No abnl | No LOH | No LOH |
| 22 | Anaplastic AC | Excellent | 200 | 0.22 | No abnl | No abnl | No LOH | No LOH |
| 23 | Anaplastic AC | Excellent | 200 | 0.25 | No abnl | del q13.41→qter | No LOH | No LOH |
| 24 | Anaplastic AC | Excellent | 200 | 0.33 | del p31.1p31.1 | No abnl | No LOH | No LOH |
| 25 | Anaplastic AC | Good | 200 | 0.38 | No abnl | del q13.32→qter | No LOH | No LOH |
| 26 | Anaplastic AC | Excellent | 160 | 0.37 | No abnl | del q13.31→qter | No LOH | LOH |
| 27 | Anaplastic AC | Good | 190 | 0.43 | No abnl | del cen→q13.42 | No LOH | LOH |
| 28 | Glioblastoma | Excellent | 152 | 0.46 | No abnl | del q13.31→q13.32; | No LOH | LOH |
| del q13.32→qter | ||||||||
| 29 | Glioblastoma | Excellent | 200 | 0.25 | del p35.1→ p36.11 | dup entire chromosome | No LOH | LOH |
| 30 | Anaplastic AC | Good | 192 | 0.24 | del p32.1→pter, dup p13.3p13.3 | del p12→qter | Distal LOH | LOH |
AC, astrocytoma; del, deletion; dup, duplication; No abnl, no abnormality detected; ODG, oligodendroglioma.
Figure 1.

Examples of SNP array for chromosomes 1 and 19. SNP array data with Illumina HumanCytoSNP-12 illustrated with KaryoStudio software; red data show smoothed signal intensity values (LRR) (Log base 2 ratio of observed and expected intensities; LogR 0, copy number two) and blue data points represent the BAF of each individual SNP (B-allele frequency of 0 equals no B-allele; 1 equals only B-alleles present). For illustration purposes, the locations of markers used for the STR assay were shown by the ideograms in A. A: Case 14: SNP array showed deletion of most of but not the entire arms of chromosomes 1p and 19q, whereas STR called LOH on both arms. B: Case 15: SNP array showed abnormal 1p and 19q, as indicated by the separation of BAF. However, the wavy and minimally shifted LRR made it difficult to distinguish between deletion and LOH. C: Case 25: SNP array showed deletion of the distal portion of chromosome 19q, whereas STR could not be interpreted clearly because of homozygosity. The array also showed loss of distal 1q (q43àqter) and LOH of 19p (p12àpter). D: Case 29: SNP array revealed small complex deletion on 1p and duplication of entire chromosome 19, including q arm, whereas STR results for 1p and 19q were normal and showed LOH, respectively.
All 15 ODG cases showed LOH of 1p and 19q by STR testing. By SNP array analysis, all of these cases also showed abnormalities of these two regions: 13 had deletion of both whole chromosome arms (1p and 19q) (cases 1 to 13), and one case had partial deletion of these chromosome arms that included all of the STR loci (1p12 to 1pter and 19q13.11 to 19qter) (case 14, Figure 1A). For the last case (case 15), although it was clearly abnormal, the SNP plots could not be unequivocally interpreted as deletion or CN-LOH because of the waviness of the LRR. The LRR smoothed plot was close to copy number two (ratio 0) for part of chromosome 1p but moved slightly to the left (deletion) for 19q and part of 1q, whereas BAF was very well separated for both entire arms. Therefore interpretation of deletion or CN-LOH was not entirely clear. Of note, this case had several other chromosomes with minimally shifted LRR in the presence of a separated BAF, thereby posing a challenge to discerning between deletion and CN-LOH (see Supplemental Table S2 at http://jmd.amjpathol.org).
Ten non-ODG cases showed no evidence of whole-arm 1p/19q LOH by STR. For seven of these cases, the SNP array results were concordant, that is, no abnormalities were found on 1p and 19q (cases 16 to 22). In contrast, three cases had partial deletions of 1p and/or 19q by SNP array. In two of these discordant cases (cases 23 and 24), the deletions were small and located outside of the STR loci. In the third case (case 25), STR analysis showed no evidence of LOH at the most proximal 19q locus and homozygosity at the other two 19q loci, which was interpreted as no evidence of LOH overall. However, for this patient, the SNP array showed partial deletion of 19q, including a segment that spans the two distal STR loci read as homozygous (19q13.32 to 19qter) (Table 2 and Figure 1C). This case shows that SNP array analysis could help avoid ambiguous calls.
STR analysis of the five remaining non-ODG cases showed normal results for the loci at 1p for all cases with the exception of one case that had LOH for the distal three loci at 1p (case 30). For 19q, all five cases showed LOH by STR. Array data showed that three cases (cases 26 to 28) had partial deletion of 19q and one (case 30) had partial deletion of both 1p and 19q, which was consistent with the STR results. One case that had LOH at 19q only by STR had a small deletion on 1p detected by array and duplication of entire chromosome 19 (case 29; Figure 1D). Retrospectively, the allelic imbalance we saw on STR analysis in this case was consistent with trisomy, as the peak height ratio of the allele in two STR sites on chromosome 19q was 1.3 (one locus was homozygous). Overall, no major discordance was seen between SNP array and STR results (Table 3), with the added advantage that SNP array can identify additional segmental deletions and duplications and distinguish between deletions causing LOH and CN-LOH.
Table 3.
Concordance for 1p/19q Results Between STR and SNP Array
| STR results |
||||
|---|---|---|---|---|
| SNP array results | No LOH | Partial LOH or LOH of one arm | LOH both arms | Total |
| No LOH | 7 | 0 | 0 | 7 |
| Partial deletion/LOH⁎ | 3 (cases 23–25) | 5†(cases 26–30) | 1‡(case 14) | 9 |
| Deletion/LOH both arms | 0 | 0 | 14§ | 14 |
| Total | 10 | 5 | 15 | 30 |
Partial deletion/LOH means that only a segment of the chromosome showed a change and not the entire arm.
One case (case 29) with 19 LOH by STR had additional deletions in 1p and duplication in 19q by SNP array.
Array revealed del 1p12àpter and 19q13.11àqter in this case (case 14).
One case (case 15) had deletion/CN-LOH.
We next analyzed other chromosomal abnormalities detected by SNP array (see Supplemental Table S2 at http://jmd.amjpathol.org). Three cases with high Log R Dev were excluded from this analysis (cases 10, 18, and 20). In general, grade 3 and 4 lesions had significantly more abnormal chromosomes [5.17 ± 0.60 in grade 2 (n = 12), 9.46 ± 1.28 in grade 3 (n = 13), and 9.50 ± 3.50 in grade 4 (n = 2); P = 0.007 for grade 2 versus 3 and P = 0.039 for grade 2 versus 4]. The number of abnormal chromosomes in grade 2 ODGs and non-ODGs was similar [5.22 ± 0.80 (n = 9) and 5.00 ± 0.58 (n = 3), respectively], whereas grade 3 non-ODG had more abnormal chromosomes than did grade 3 ODG [10.63 ± 1.66 (n = 8) and 7.6 ± 1.94 (n = 5), respectively], although this finding was not statistically significant (P = 0.269).
Distinct differences and some similarities in distribution of abnormal chromosomes were noted between the two tumor groups analyzed (Figure 2 and Table 4; see also Supplemental Table S2 at http://jmd.amjpathol.org). As expected, the chromosome 1 and 19 abnormalities were seen more commonly in ODG (100% in ODGs versus 38.5% in non-ODGs for chromosome 1 abnormalities; 100% in ODGs versus 53.8% in non-ODGs for chromosome 19). Chromosome 15 abnormalities were only found in ODGs where 5 of 14 cases had a common deleted region between bands q13.1 and q22.31. Alternatively, only non-ODG cases had abnormalities of chromosome 10, with 4 of 13 cases showing deletion or LOH from band q25.1 to the end of the long arm. Duplication of a portion of the long arms of chromosomes 7 (particularly q35 to q36.1) and 8 (q22.3 to q24.21) was seen more frequently in non-ODG (6 of 13 verus 1 of 14 in ODG, for both chromosomes). Deletion or LOH of 9p, in particular from p21.2 to p21.3, was observed frequently in both groups of gliomas (8 of 13 non-ODGs and 6 of 14 ODGs). Loss of the entire chromosome 14 was a relatively frequent finding and was seen in 4 of 14 ODG cases, but in non-ODG cases the observed changes affecting this chromosome were smaller in size and typically non-overlapping, and thus not showing a pattern. Deletion or LOH of 17p was seen in approximately 80% of non-ODG cases (10 of 13 cases), whereas only one ODG case had LOH of this region. The type of abnormality, whether gain or loss or CN-LOH, seemed to be specific to certain chromosomes. Examples of this observation include duplications on chromosomes 7q and 8q, in contrast to deletions on chromosome 13 and 14 and CN-LOH on chromosome 17. Excluding 1p and 19q, more than half of the chromosome abnormalities seen in ODG were due to whole chromosome changes, whereas in non-ODG about 85% of the chromosome changes were segmental abnormalities.
Figure 2.
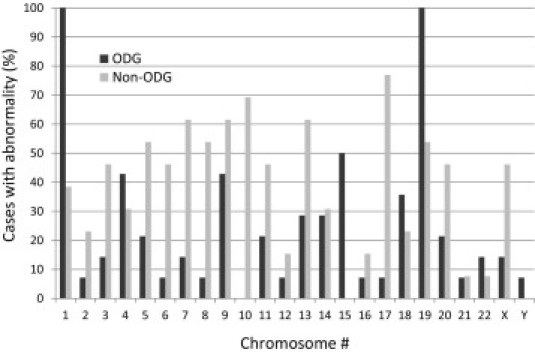
Frequency (%) of abnormal cases for each chromosome.
Table 4.
Summary of Most Frequent Chromosome Abnormalities Detected by SNP Array, Excluding Chromosomes 1 and 19
| Chromosome and minimum shared region | Abnormality | ODG | Non-ODG |
|---|---|---|---|
| 4p16.1pter | Loss/LOH | 5/14 | 0/13 |
| 5q32q33.1 | Loss/LOH | 1/14 | 4/13 |
| 7q35q36.1 | Gain | 1/14 | 6/13 |
| 8q22.3q24.21 | Gain | 1/14 | 6/13 |
| 9p21.2p21.3 | Loss/LOH | 6/14 | 8/13⁎ |
| 10q25.1qter | Loss/LOH | 0/14 | 4/13 |
| 13q12.11q13.2 | Loss | 2/14 | 8/13 |
| 14 whole chromosome | Loss | 4/14 | 0/13† |
| 15q13.1q22.31 | Loss | 5/14 | 0/13 |
| 17p13.1p13.2 | Loss/LOH | 1/14 | 10/13 |
| 18q22.3qter | Loss/LOH | 5/14 | 1/13 |
| 20p12.1pter | Gain | 0/14 | 4/13 |
Two of these cases had homozygous deletion.
Only small losses not affecting the whole chromosome
Discussion
In current clinical practice, assessment of 1p and 19q status is widely implemented in the neuro-oncological management of patients with ODGs and anaplastic ODGs. An accurate test to assess 1p and 19q status is needed. Because of the limitation of the probes or primers that interrogate only small portions of the chromosomes, current assays may not be comprehensive enough in some cases, especially since the genes that are being targeted by the LOH are currently unknown. Array-based CGH and SNP array are powerful tools and have been used extensively in the diagnosis of constitutional chromosome abnormalities in persons with developmental delay. These techniques are starting to make their way into the realm of acquired abnormalities found in neoplasia. In this study, we demonstrated that assessment of genomic changes in gliomas using SNP array in FFPE samples is feasible and has great potential as an accurate clinical diagnostic test.
The quality of DNA extracted from FFPE samples is an important factor for a successful and accurate micro-array analysis. Routine extraction using the Qiagen QIAmp DNA Kit yielded good-quality DNA in 90% of our cases as assessed by the BioScore Screening and Amplification Kit (Enzo Life Sciences), which accurately predicted array performance. When the quality was “intermediate,” as observed in three of our cases, the SNP array results were noisier, as indicated by a higher SD (Log R Dev). This higher deviation can hinder accurate analysis of chromosomal changes, in particular small-sized abnormalities, and therefore these three specimens could not be fully analyzed. However, the SNP arrays from these DNA samples still yielded data of sufficient quality for analysis of whole arm changes on chromosomes 1p and 19q. The amount of DNA recommended by the manufacturer (Illumina Inc.) for input onto the Illumina SNP array is 200 ng (at 50 ng/μL). Nevertheless, the SNP array had an acceptable performance with as low as 76 ng DNA, and this suboptimal amount did not appear to affect the quality of the data, in particular the BAF, in the limited number of cases that we studied. These results are rather surprising and this factor is an important consideration because the amount of DNA extracted from FFPE samples may be very low, especially from small biopsy specimens.
A few attempts to use copy number arrays with FFPE tissue have been made previously. Mohapatra et al16,17 used aCGH to analyze FFPE brain tumors. However, their method included optimization with a two-step labeling procedure using an amine-modified nucleotide for generation of aCGH probes. Our method did not require any modifications; therefore, the FFPE samples can be run simultaneously with samples from fresh tissues such as peripheral blood or bone marrow. This point is particularly important because the Illumina micro-array we used is packaged in a 12-sample-per-chip format.
Some limitations of the SNP array analysis on FFPE samples were noted. Because of noise and waviness on LRR lines, it was difficult in some cases to distinguish between deletion in a small percentage of cells and CN-LOH. One particular case (case 15) had an LRR close to zero while clearly showing four tracks for the BAF. This situation could indicate CN-LOH, but because of the waviness of the LRR we could not unambiguously interpret it and preferred to call it deletion/CN-LOH. In the near future, modification of DNA extraction methods and additional optimization steps may further improve the quality of DNA, which should result in higher performance of the SNP arrays.
In our analyses of SNP arrays we detected all of the changes that were identified by our routine clinical test using microsatellites (STRs), with the added advantage that the arrays provided information for the entire arm of chromosomes 1p and 19q instead of just the segments covered by the microsatellites. This information allowed us to diagnose loss of the entire 1p and 19q arms in 14 of 15 ODG cases examined, but only partial loss of 1p and 19q in one case (case 14).
The proposed mechanism of concurrent 1p and 19q chromosome loss in ODG is reciprocal whole-arm exchange at the centromere forming two derivative chromosomes: der(1;19)(p10;q10) and der(1;19)(q10;p10). The latter derivative chromosome containing the long arm of chromosome 1 and the short arm of chromosome 19 is subsequently retained, while subsequent loss of the former derivative chromosome results in simultaneous loss of 1p and 19q.18 In fact, Vogazianou et al19 recently suggested that the breakpoints of t(1;19) translocation may be in the pericentromeric regions of 1p and 19q, not disrupting any known protein coding genes. However, different mechanisms may be involved in the case, with only partial loss of 1p and 19q and with the centromeres and pericentromeric regions retained.
In addition, the SNP array detected partial deletions and duplications on chromosomes 1 and 19 that were not identified by STR analysis. Interestingly, one case had trisomy of chromosome 19 by SNP array, and it was interpreted as LOH by STR analysis (case 29). Both deletion and duplication result in allelic imbalance, which could not be distinguished by the STR analysis, because this method only detects allelic imbalance. Retrospectively, the allelic imbalance we saw on STR analysis in this case was consistent with trisomy because the peak height ratio of the allele in two STR sites on chromosome 19q was 1.3 (the remaining one locus was homozygous). This case was diagnosed as glioblastoma and had additional duplications in chromosomes 7 and 20.
Three out of 10 non-ODG cases (30%) that did not have evidence of LOH by STR analysis had partial deletions of either 1p or 19q. One out of five cases (20%) with LOH of some of the loci interrogated by STR was found to have additional deletions within 1p or 19q. In these scenarios, SNP array has the ability to accurately identify small or partial deletions. The clinical significance of these small or partial deletions is not currently understood. However, collecting such data with clinical correlation would be crucial for the discovery of genomic lesions responsible for tumorigenesis and progression.
High-resolution genomic copy number profiling of gliomas has been performed recently either by aCGH or SNP array. In glioblastoma or astrocytic tumors, chromosome 7 gain, 9p deletion, and/or chromosome 10 loss are reported to be a characteristic pattern.20 In oligodendrogliomas, combined 1p/19q and 19q loss were significantly associated with longer survival, and gains on 7, 8q, 19q, and 20 and losses on 9p, 10, 18q, and Xq were associated with shorter survival.9 Loss of 1p and 19q correlates inversely with TP53 mutations (chromosome 17p13.1), 10q deletions, and amplification of EGFR (chromosome 7p12).2 Others have shown a significantly shortened survival time in patients with a glioblastoma with 13q14 (RB1) deletion or 17p13.1 (TP53) deletion/LOH.21 Our study also identified frequent gains on chromosomes 7 and 8q, losses on 13q, and LOH on 17p in non-ODG, especially in grade 3 and 4 tumors, whereas these changes were less frequent in ODG (Table 4).
In summary, we have demonstrated that assessment of genomic changes in gliomas using Illumina SNP microarrays on FFPE samples is feasible and has great potential as an accurate clinical diagnostic test. Small deletions or LOH that could be missed by the current assays are detectable using the SNP array, which has the potential to also distinguish between simple deletion and CN-LOH. The identification of CN-LOH as a mechanism of loss highlights the importance of using a strategy that utilizes informative markers such as SNPs or microsatellites. At the same time, SNP arrays allow the identification of additional chromosome abnormalities. The number of cases in this study is relatively small, but a pattern of chromosomal abnormalities starts to emerge, and our study shows the potential of SNP array analysis in identifying crucial loci in gliomas. The clinical significance of these small deletions, CN-LOH, and abnormalities on other chromosomes has yet to be determined and will require further studies.
Acknowledgments
We thank Katie Beierl and Amanda Stafford (Molecular Diagnostic Laboratory, Johns Hopkins University, Baltimore, MD), Janet Biscoe, Victoria Stinnett, Linjie Wo, and Elizabeth Wohler (Cytogenetics Laboratory, Kennedy Krieger Institute, Baltimore, MD) for their technical expertise, and Dr. Athanasios Tsiatis for helpful discussions.
Footnotes
Supplemental material for this article can be found at http://jmd.amjpathol.org or at doi: 10.1016/j.jmoldx.2011.05.009.
Supplementary data
References
- 1.Dunbar E., Yachnis A.T. Glioma diagnosis: immunohistochemistry and beyond. Adv Anat Pathol. 2010;17:187–201. doi: 10.1097/PAP.0b013e3181d98cd9. [DOI] [PubMed] [Google Scholar]
- 2.Jansen M., Yip S., Louis D.N. Molecular pathology in adult gliomas: diagnostic, prognostic, and predictive markers. Lancet Neurol. 2010;9:717–726. doi: 10.1016/S1474-4422(10)70105-8. [DOI] [PMC free article] [PubMed] [Google Scholar]
- 3.Hatanpaa K.J., Burger P.C., Eshleman J.R., Murphy K.M., Berg K.D. Molecular diagnosis of oligodendroglioma in paraffin sections. Lab Invest. 2003;83:419–428. doi: 10.1097/01.lab.0000059948.67795.ef. [DOI] [PubMed] [Google Scholar]
- 4.Blesa D., Mollejo M., Ruano Y., de Lope A.R., Fiaño C., Ribalta T., García J.F., Campos-Martín Y., Hernández-Moneo J.L., Cigudosa J.C., Meléndez B. Novel genomic alterations and mechanisms associated with tumor progression in oligodendroglioma and mixed oligoastrocytoma. J Neuropathol Exp Neurol. 2009;68:274–285. doi: 10.1097/NEN.0b013e31819a3e8c. [DOI] [PubMed] [Google Scholar]
- 5.Idbaih A., Crinière E., Ligon K.L., Delattre O., Delattre J.Y. Array-based genomics in glioma research. Brain Pathol. 2010;20:28–38. doi: 10.1111/j.1750-3639.2009.00274.x. [DOI] [PMC free article] [PubMed] [Google Scholar]
- 6.Shete S., Hosking F.J., Robertson L.B., Dobbins S.E., Sanson M., Malmer B., Simon M., Marie Y., Boisselier B., Delattre J.Y., Hoang-Xuan K., El Hallani S., Idbaih A., Zelenika D., Andersson U., Henriksson R., Bergenheim A.T., Feychting M., Lönn S., Ahlbom A., Schramm J., Linnebank M., Hemminki K., Kumar R., Hepworth S.J., Price A., Armstrong G., Liu Y., Gu X., Yu R., Lau C., Schoemaker M., Muir K., Swerdlow A., Lathrop M., Bondy M., Houlston R.S. Genome-wide association study identifies five susceptibility loci for glioma. Nat Genet. 2009;41:899–904. doi: 10.1038/ng.407. [DOI] [PMC free article] [PubMed] [Google Scholar]
- 7.Holland H., Koschny T., Ahnert P., Meixensberger J., Koschny R. WHO grade-specific comparative genomic hybridization pattern of astrocytoma—a meta-analysis. Pathol Res Pract. 2010;206:663–668. doi: 10.1016/j.prp.2010.04.002. [DOI] [PubMed] [Google Scholar]
- 8.Sievert A.J., Jackson E.M., Gai X., Hakonarson H., Judkins A.R., Resnick A.C., Sutton L.N., Storm P.B., Shaikh T.H., Biegel J.A. Duplication of 7q34 in pediatric low-grade astrocytomas detected by high-density single-nucleotide polymorphism-based genotype arrays results in a novel BRAF fusion gene. Brain Pathol. 2009;19:449–458. doi: 10.1111/j.1750-3639.2008.00225.x. [DOI] [PMC free article] [PubMed] [Google Scholar]
- 9.Trost D., Ehrler M., Fimmers R., Felsberg J., Sabel M.C., Kirsch L., Schramm J., Wiestler O.D., Reifenberger G., Weber R.G. Identification of genomic aberrations associated with shorter overall survival in patients with oligodendroglial tumors. Int J Cancer. 2007;120:2368–2376. doi: 10.1002/ijc.22574. [DOI] [PubMed] [Google Scholar]
- 10.Oosting J., Lips E.H., van Eijk R., Eilers P.H., Szuhai K., Wijmenga C., Morreau H., van Wezel T. High-resolution copy number analysis of paraffin-embedded archival tissue using SNP BeadArrays. Genome Res. 2007;17:368–376. doi: 10.1101/gr.5686107. [DOI] [PMC free article] [PubMed] [Google Scholar]
- 11.Alvarez K., Kash S.F., Lyons-Weiler M.A., Kim H.J., Peterson L.E., Mathai B., Hagenkord J.M., Monzon F.A. Reproducibility and performance of virtual karyotyping with SNP microarrays for the detection of chromosomal imbalances in formalin-fixed paraffin-embedded tissues. Diagn Mol Pathol. 2010;19:127–134. doi: 10.1097/PDM.0b013e3181d527c5. [DOI] [PubMed] [Google Scholar]
- 12.Lyons-Weiler M., Hagenkord J., Sciulli C., Dhir R., Monzon F.A. Optimization of the Affymetrix GeneChip Mapping 10K 2.0 Assay for routine clinical use on formalin-fixed paraffin-embedded tissues. Diagn Mol Pathol. 2008;17:3–13. doi: 10.1097/PDM.0b013e31815aca30. [DOI] [PubMed] [Google Scholar]
- 13.Johnson N.A., Hamoudi R.A., Ichimura K., Liu L., Pearson D.M., Collins V.P., Du M.-Q. Application of array CGH on archival formalin-fixed paraffin-embedded tissues including small numbers of microdissected cells. Lab Invest. 2006;86:968–978. doi: 10.1038/labinvest.3700441. [DOI] [PMC free article] [PubMed] [Google Scholar]
- 14.Calhoun E.S., Gallmeier E., Cunningham S.C., Eshleman J.R., Hruban R.H., Kern S.E. Copy-number methods dramatically underestimate loss of heterozygosity in cancer. Genes Chromosomes Cancer. 2006;45:1070–1071. doi: 10.1002/gcc.20365. [DOI] [PubMed] [Google Scholar]
- 15.Tsiatis A.C., Norris-Kirby A., Rich R.G., Hafez M.J., Gocke C.D., Eshleman J.R., Murphy K.M. Comparison of Sanger sequencing, pyrosequencing, and melting curve analysis for the detection of KRAS mutations: diagnostic and clinical implications. J Mol Diagn. 2010;12:425–432. doi: 10.2353/jmoldx.2010.090188. [DOI] [PMC free article] [PubMed] [Google Scholar]
- 16.Mohapatra G., Betensky R.A., Miller E.R., Carey B., Gaumont L.D., Engler D.A., Louis D.N. Glioma test array for use with formalin-fixed, paraffin-embedded tissue: array comparative genomic hybridization correlates with loss of heterozygosity and fluorescence in situ hybridization. J Mol Diagn. 2006;8:268–276. doi: 10.2353/jmoldx.2006.050109. [DOI] [PMC free article] [PubMed] [Google Scholar]
- 17.Mohapatra G., Engler D.A., Starbuck K.D., Kim J.C., Bernay D.C., Scangas G.A., Rousseau A., Batchelor T.T., Betensky R.A., Louis D.N. Genome-wide comparison of paired fresh frozen and formalin-fixed paraffin-embedded gliomas by custom BAC and oligonucleotide array comparative genomic hybridization: facilitating analysis of archival gliomas. Acta Neuropathol. 2011;121:529–543. doi: 10.1007/s00401-010-0773-z. [DOI] [PMC free article] [PubMed] [Google Scholar]
- 18.Griffin C.A., Burger P., Morsberger L., Yonescu R., Swierczynski S., Weingart J.D., Murphy K.M. Identification of der(1;19)(q10;p10) in five oligodendrogliomas suggests mechanism of concurrent 1p and 19q loss. J Neuropathol Exp Neurol. 2006;65:988–994. doi: 10.1097/01.jnen.0000235122.98052.8f. [DOI] [PubMed] [Google Scholar]
- 19.Vogazianou A.P., Chan R., Bäcklund L.M., Pearson D.M., Liu L., Langford C.F., Gregory S.G., Collins V.P., Ichimura K. Distinct patterns of 1p and 19q alterations identify subtypes of human gliomas that have different prognoses. Neuro Oncol. 2010;12:664–678. doi: 10.1093/neuonc/nop075. [DOI] [PMC free article] [PubMed] [Google Scholar]
- 20.Idbaih A., Marie Y., Lucchesi C., Pierron G., Manié E., Raynal V., Mosseri V., Hoang-Xuan K., Kujas M., Brito I., Mokhtari K., Sanson M., Barillot E., Aurias A., Delattre J.Y., Delattre O. BAC array CGH distinguishes mutually exclusive alterations that define clinicogenetic subtypes of gliomas. Int J Cancer. 2008;122:1778–1786. doi: 10.1002/ijc.23270. [DOI] [PubMed] [Google Scholar]
- 21.Yin D., Ogawa S., Kawamata N., Tunici P., Finocchiaro G., Eoli M., Ruckert C., Huynh T., Liu G., Kato M., Sanada M., Jauch A., Dugas M., Black K.L., Koeffler H.P. High-resolution genomic copy number profiling of glioblastoma multiforme by single nucleotide polymorphism DNA microarray. Mol Cancer Res. 2009;7:665–677. doi: 10.1158/1541-7786.MCR-08-0270. [DOI] [PubMed] [Google Scholar]
Associated Data
This section collects any data citations, data availability statements, or supplementary materials included in this article.