

Abstract
We have previously shown that melanoma cells proliferate in response to the metabolic hormones TRH and TSH. The objective of the present study was to test the hypothesis that a third metabolic hormone, leptin, serves as a growth factor for melanoma. Using western blotting, indirect immunofluorescence, and RT-PCR, leptin receptors were found to be expressed by human melanoma cells. In contrast, cultured melanocytes expressed message for the receptor without detectable protein. Melanoma cells responded to treatment with leptin by activating the MAPK pathway and proliferating. Melanoma cells but not melanocytes, also expressed leptin protein, creating a potential autocrine loop. Examination of human melanoma tumors by immunohistochemistry revealed that melanomas and nevi expressed leptin at a high frequency. Melanomas also strongly expressed the leptin receptor, whereas nevi expressed this receptor to a much lesser degree. We conclude that leptin is a melanoma growth factor and that a leptin autocrine-loop may contribute to the uncontrolled proliferation of these cells.
Keywords: melanoma, leptin, metabolic hormones
Introduction
Cutaneous melanoma, the most aggressive form of skin cancer, develops from the malignant transformation of melanocytes located in the dermal/epidermal junction. These normally quiescent cells originate embryologically from pleuripotent neural crest cells, thus sharing this progenitor with cells of the neuroendocrine system. The endocrine features of melanoma have been an active topic of research in our laboratory over the past several years. We have reported that melanoma cells produce thyrotropin releasing hormone (TRH) and respond to this peptide hormone by proliferation, suggesting the presence of an autocrine loop (1). We have also demonstrated the expression of functional thyroid stimulating hormone (TSH) receptors by human melanoma cells, which exhibit a proliferative response to TSH through activation of the mitogen-activated protein kinase (MAPK) pathway (2). These findings raise the possibility that an even wider spectrum of metabolic hormones may play a significant role in melanoma pathobiology.
Over the past decade, considerable interest has been generated in the metabolic hormone leptin. This 16 kDa protein, encoded by the Ob (obese) gene, exhibits a wide range of physiological functions, with roles in energy balance, reproduction, immunity, and inflammation. Best understood is the secretion of leptin by adipocytes as a satiety signal to the hypothalamus, where neurons of the paraventricular nucleus express leptin receptors (3). Multiple forms of the leptin receptor (ObR), resulting from alternative mRNA splicing, have been described and are generally categorized as the long form (ObRb), several short forms (ObRa, c, d, and f), and the soluble form (ObRe) (4). ObRb is thought to function as the major signaling isoform and dominates in the hypothalamus where binding of leptin initiates production of TRH. TRH induces TSH production and secretion by the pituitary gland, the first step in the initiation of metabolic processes involving energy expenditure.
Leptin receptors have been described in various types of tumor cells, including breast, prostate, colon, endometrium, and others, and leptin has been implicated as a growth factor for these cancers (5–9). Based on these reports and our previous data regarding the endocrine nature of melanoma, we hypothesized that melanoma cells express functional leptin receptors. Here, we report that melanoma cells do indeed express these receptors which, in the presence of leptin, signal through the MAPK pathway and induce proliferation. Furthermore, we demonstrate that melanomas also express leptin, providing a potential autocrine growth pathway.
Materials and methods
Patient material
Sections of melanomas and nevi were obtained from the M. D. Anderson Cancer Center (MDACC) Melanoma Tumor Bank. Procurement of all patient materials was conducted with IRB approval and in accordance with HIPAA guidelines.
Antibodies and reagents
Antibodies to human leptin and ObR were obtained from Santa Cruz Biotechnology (Santa Cruz, CA) for western blotting, and from R&D Systems (Minneapolis, MN) for immunohistochemistry and IF. Antibodies to ERK, phosphorylated ERK, Stat3, and phosphorylated Stat3 were purchased from Cell Signaling Technology (Beverly, MA). Recombinant human leptin was obtained from Sigma (St. Louis, MO) and adipocyte mRNA from Clontech (Mountain View, CA).
Cell lines
The human melanoma cell lines WM793 and WM35 were generous gifts of Dr. Robert Kerbel (Sunnybrook Health Science Center, Toronto, ON, Canada). The TXM18 melanoma cell line was kindly provided by Dr. Janet Price (MDACC) and A375 melanoma cells were purchased from the American Type Culture Collection (Manassas, VA). Cells were grown in RPMI 1640 medium, supplemented with 10% fetal bovine serum (FBS). Primary melanocytes were derived from neonatal foreskin and were maintained as previously described (10).
Whole cell extracts and western blotting
Cells were washed with cold PBS and harvested into PBS with 1 mM phenylmethylsulfonyl fluoride. Cell pellets were then treated with lysis buffer (140 mM NaCl, 25 mM Tris HCl pH 7.4, and 1% NP-40) with freshly added protease inhibitor cocktail (BD Biosciences, San Jose, CA). The supernatants were collected after a 20-minute incubation and protein concentrations were measured. Proteins were separated by SDS-PAGE, transferred to a nitrocellulose membrane, and blocked for 1 hour in 5% nonfat dry milk in PBS. Primary antibody was diluted in 5% nonfat dry milk/PBS/0.1% Tween and incubated overnight at 4°C, followed by 45 minutes incubation with horseradish peroxidase labeled secondary antibody, again diluted in 5% nonfat dry milk/PBS/0.1% Tween. Membrane development was achieved with enhanced chemiluminescence (Amersham Pharmacia Biotech, Piscataway, NJ).
Indirect immunofluorescence
Cells grown on chamber slides were fixed with 2% paraformaldehyde on ice for 30 minutes, blocked with 5% serum in PBS for 30 minutes at room temperature, and incubated with primary antibody diluted in blocking solution for 2 hours at 4°C. This was followed by incubation with FITC-labeled secondary antibody for 1 hour at room temperature. Staining was observed and imaged with a Nikon Eclipse TE 2000-U microscope equipped with a Nikon digital DXM 1200F camera.
RT-PCR
RT-PCR was carried out using the GeneAmp RNA PCR Kit (Applied Biosystems, Foster City, CA) and oligonucleotide primers prepared by Sigma Genosys (The Woodlands, TX). Total RNA was extracted using TRIzol reagent (Invitrogen, Carlsbad, CA). Reverse transcription to cDNA, carried out using 2 ug of total RNA, took place at 42°C for 30 minutes. PCR primers and conditions are as follows:
| Leptin: | Forward: 5′-CACCAAAACCCTCATCAAGACA-3′ |
| Reverse: 5′-TAGAGAAGGCCAGCACGTGAA-3′ | |
| Conditions: 95°C 45 seconds; 58°C 45 seconds; 72°C 45 seconds, magnesium chloride 3.0 mM, 38 cycles. | |
| ObRb: | Forward: 5′-CCAGAAACGTTTGAGCATCT-3′ |
| Reverse: 5′-CAAAAGCACACCACTCTCTC-3′ | |
| Conditions: 94°C 60 seconds; 58°C 60 seconds; 72°C 60 seconds, magnesium chloride 5.0 mM, 35 cycles. |
DNA sequencing
Sequencing of PCR products was performed by the MDACC DNA Core Facility using an ABI Prism 3100 DNA Genetic Analyzer (Applied Biosystems), using Big Dye® v.3.1 dye terminator chemistry (Applied Biosystems). Forward and reverse DNA strands were sequenced for all samples.
Proliferation assay
Cells were plated at a density of 3 × 10⁴ per chamber of a two-chamber tissue culture slide. The following day, the melanoma cells were placed in serum-free media and the melanocytes in a minimal media consisting of RPMI 1640 with 10 ug/ml insulin, 5 mg/ml transferrin, and 10 nm hydrocortisone. Leptin was added at the desired concentration after six hours for an overnight incubation. Effects on proliferation were examined after 24 hours, by means of a commercially available BrdU immunocytochemistry assay (BrdU Staining Kit, Zymed, Carlsbad, CA). BrdU labeling reagent (Zymed) was added at a 1:100 dilution to the cultures the evening prior to the assay. On the following day, the cells were fixed with 70% ethanol and incubated in 3% H2O2 in methanol to block endogenous peroxidase activity. After permeabilization and blocking, the cells were incubated with biotinylated anti-BrdU antibody, followed by streptavidin peroxide, the chromogen diaminobenzidine (DAB), and a hematoxylin counterstain. To calculate the percentage of cells positive for BrdU, the stained sections were examined for brown DAB-stained nuclei. A minimum of 100 cells was counted from two different representative areas of the slide, and the mean and standard deviation calculated from these counts.
Immunohistochemistry
Tissue sections were deparaffinized in xylenes, and rehydrated in graded concentrations (100% to 85%) of ethanol. Sections were placed in Antigen Unmasking Solution (Vector Laboratories, Burlingame, CA) and microwaved intermittently for a total of 10 minutes, to maintain boiling temperature. After cooling, the slides were placed in 3% H2O2 in cold methanol for 15 minutes to block endogenous peroxidase activity. This step was followed by permeabilization with 0.05% Triton X-100 (Sigma, St. Louis, MO) in phosphate-buffered saline for 15 minutes. An avidin-biotin-peroxidase complex (ABC) kit (Vectastain, Vector Laboratories) was then used for antigen detection. After a 30-minute incubation with blocking serum, the primary antibody was applied and incubated for two hours at room temperature. The slides were then washed, incubated for 30 minutes with secondary biotinylated antibody, followed by a 30-minute incubation with the ABC reagent. The immunolabeling was developed with the chromogen 3-amino-9-ethylcarbazole (AEC). Hematoxylin was applied as a counter stain.
Immunolabeling was scored separately for two variables; first, for number of positive cells; second, for the overall intensity of immunoreactivity of the positive cells. Scoring for the number of positive tumor cells was defined as follows: “0”, less than 5% positive cells; “1”, 5–25% positive cells; “2”, 26–75% positive cells; and “3”, greater than 75% positive cells. Intensity scoring consisted of: “0”, no staining; “1”, weak staining; “2”, moderate staining; and “3”, intense staining. The slides were interpreted by two readers (AHD and JAE).
Statistical Analysis
Differences in the mean percentage of BrdU positive cells at different leptin concentrations were examined for significance using the unpaired t-test. IHC scores were compared between melanomas and nevi using the Mann-Whitney test. Minitab software was used for all computations and significance was set at p ≤ 0.05
Results
Expression of leptin receptors by melanocytic cells
Melanoma cell lines were first examined for ObR expression. Antibodies from a variety of sources were tested by immunoblotting, yielding positive results, but of relatively poor quality. The result of a representative blot, examining four human melanoma cell lines, is shown in Figure 1, revealing bands of the appropriate size for ObRb (~125 kDa) and ObRa (~ 100 kDa). To better demonstrate the presence of ObR expression, indirect immunofluorescence (IF) was performed using non-permeabilized cells grown on chamber slides. The MCF-7 breast cancer cell line, which has been previously reported to express ObR, was included as a positive control (8). As shown in Figure 2A, both of the melanoma cell lines included in this experiment expressed ObR whereas expression was notably absent or below the level of detection in melanocytes. For further confirmation of these findings, RT-PCR was performed using RNA from the same lines. Unlike the antibody used in the above experiments, which does not distinguish between the various isoforms, the PCR primers were specific for the long isoform ObRb. All lines, including the melanocytes, expressed message for ObRb (Fig. 2B), which was confirmed by DNA sequencing. Taken together, these findings convincingly demonstrate the expression of receptors for leptin by human melanoma cells. Although cultured melanocytes also express ObR message, it appears that translation is inhibited, as protein is not detected.
Figure 1.
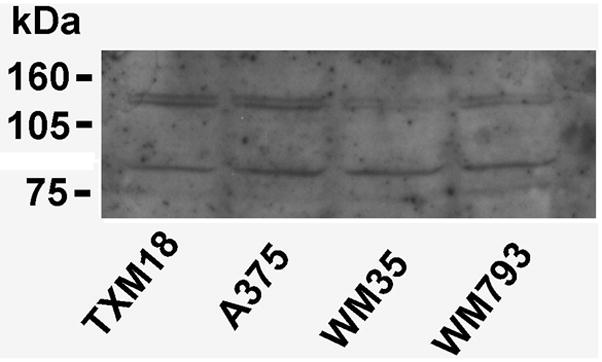
Expression of the leptin receptor by human melanoma cell lines by western blotting. The two bands represent the long (~ 125 kDa) and short (~ 100 kDa) isoforms of ObR.
Figure 2.

Detection of ObR by indirect immunofluorescence and RT-PCR. A. Two melanoma cells lines, WM35 and WM793, demonstrate strong staining with antibody to ObR, whereas melanocytes appear to be negative. The breast cancer line MCF-7 serves as a positive control. B. RT-PCR of RNA from the same cell lines shows message for ObRb in melanoma cells and melanocytes. (+), RT, followed by PCR; (−), PCR without RT, as a control for amplification of genomic DNA; M-cytes, melanocytes.
Activation of proliferation and pathway signaling in response to leptin
To explore the hypothesis that melanoma leptin receptors are functional and that leptin is a growth factor for these cells, cultured melanoma cells and melanocytes were exposed to increasing concentrations of leptin from 0 to 1000 ng/ml and examined for induction of proliferation by BrdU uptake. The melanoma cells were serum-starved for 6 hours prior to an overnight incubation with leptin. Because the melanocytes did not survive serum starvation, they were assayed instead in a minimal medium consisting of RPMI 1640 with 10 μg/ml insulin, 5 μg/ml transferrin, and 10 nm hydrocortisone (2). Both melanoma lines included in these experiments proliferated in response to leptin, with an optimal concentration of 100 ng/ml, which is a physiologically relevant level (Fig. 3). Melanocytes also responded to leptin with a proliferative response. However, in contrast to the melanoma cells, this response did not appear to be dose dependent, suggesting the presence of sparse surface receptors that were saturated at the lowest leptin concentration. Furthermore, the melanocyte proliferation rate was low compared to melanoma cells, remaining below 10%. The difference in melanocyte and melanoma cell proliferation was likely underestimated in these assays as the melanocytes had additional growth factors in their media as described above.
Figure 3.

Proliferative response of melanoma cells to leptin. Melanoma cells and melanocytes were treated overnight with escalating concentrations of leptin. Both melanoma cell lines demonstrate a dose-dependent proliferative response. Data are representative of duplicate experiments. Charted are the mean of two separate counts of BrdU-positive cells; error bars represent the standard deviation. Asterisks indicate a significant difference compared to the “0” leptin concentration.
Activation of the MAPK and signal transducer and activator of transcription 3 (STAT3) pathways by leptin have been reported in colon and breast cancer cell lines (8, 9). Both of these pathways are utilized for signaling by a portion of melanomas in a constitutive fashion, although MAPK activation, as evidenced by ERK phosphorylation, appears to be the more prevalent of the two. To establish the pattern of leptin signaling in melanoma, WM793 cells were serum starved overnight, and then treated with leptin 100 ng/ml for 2, 5, 10, 15, and 30 minutes. As anticipated, the phosphorylated forms of ERK (pERK) and STAT3 (pSTAT3) were detected in the baseline samples. An increase in the level of pERK was seen at the earliest timepoint, and peaked at 5 minutes (Fig 4). In contrast, no evidence for increased STAT3 phosphorylation was detected. Similar findings were seen with WM35 cells (data not shown). These results indicate that leptin preferentially activates the MAPK pathway in human melanoma cells, and that signaling through STAT3 is not a consequence of ObR activation in this system.
Figure 4.

Pathway activation by leptin in melanoma cells. WM793 cells were treated with leptin 100 ng/ml and assayed for ERK and STAT3 phosphorylation at the indicated timepoints. A. An increase in the amount of pERK is detected as early as two minutes after leptin exposure. In contrast, levels of pSTAT3 do not change over the time course. B. Enhanced ERK phosphorylation is confirmed by densitometry.
Production of leptin by melanoma cells
The most obvious source of leptin which might stimulate melanoma cells in vivo is the naturally circulating hormone produced by adipocytes in response to caloric intake. However, a potential alternative or complementary mechanism would be production and secretion of leptin by the tumor cells themselves as part of an autocrine growth stimulatory pathway. To explore the second alternative, the presence of leptin protein was examined in a panel of melanoma cell lines and melanocytes. Figure 5A demonstrates that leptin is indeed present in lysates of three of the four melanoma cell lines examined and is absent in melanocytes. To rule out the possibility that the leptin detected was exogenous and simply taken up from the serum in the culture media, RT-PCR and sequencing were performed to confirm the presence of leptin message in these cells. As demonstrated in Figure 5B, leptin message was found in melanoma cells, confirming that the hormone was produced endogenously and supporting the hypothesis of a leptin autocrine loop. Similar to the case with ObR, melanocytes produce message for leptin which is not translated into the protein.
Figure 5.
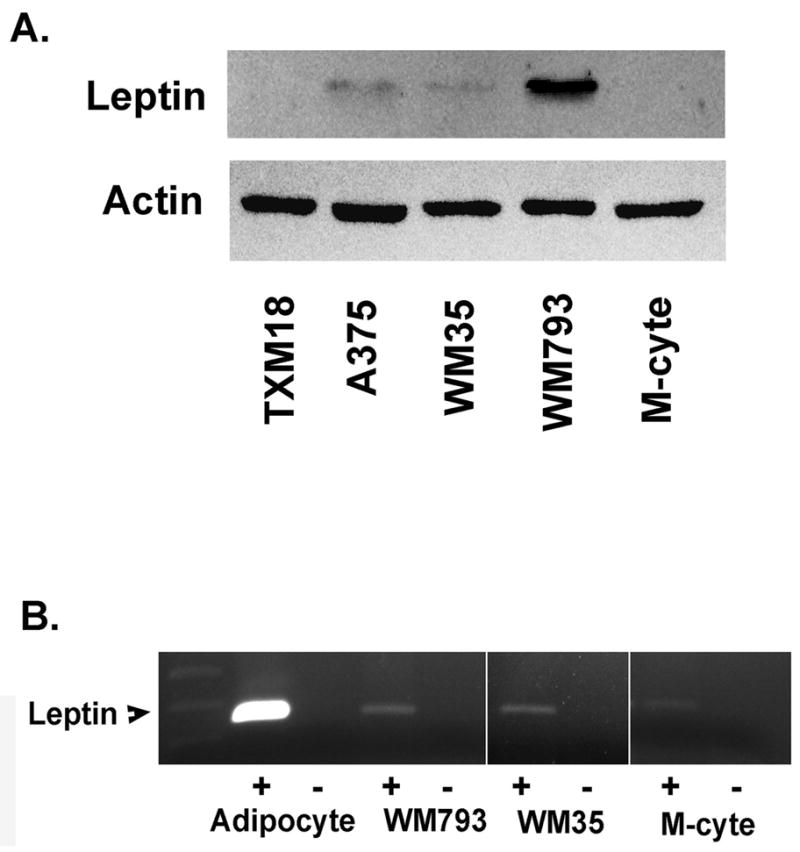
Production of leptin by melanoma cells and melanocytes. A. Leptin is demonstrated in lysates of three of four melanoma cell lines by western blotting. B. Leptin message is detected in WM793 and WM35 melanoma cells, as well as in melanocytes. Adipocyte mRNA serves as a positive control. (+), RT, followed by PCR; (−), PCR without RT, as a control for amplification of genomic DNA; M-cyte, melanocyte.
ObR and leptin expression by human melanoma and nevi
Finally, we examined ObR expression in sixteen human primary melanomas and fifteen benign nevi. This group of samples has been previously described in terms of maturation detected by the anti-leptin receptor antibody (11). Here, we have quantitated immunostaining for ObR and leptin, by both percent of positive cells and intensity of staining (see Methods), and compared expression in the two sample types (Fig. 6). As shown in Table 1, only one of the sixteen nevi (6.7%), expressed ObR in a high percentage of cells (score of 2 or 3) and 60% were completely negative; in contrast, 63% of melanomas had a high percentage score and 31% were negative (p = 0.009). The intensity scores were in agreement with these findings and bordered on significance (p = 0.054). Additional sections were available from all fifteen nevi and eleven of the melanomas for immunohistochemical study with antibody to leptin. In this regard, the two sample types were more similar. Although melanomas and nevi differed significantly in their percentage scores, expression was generally diffuse in both, with 73% of nevi and 100% of melanomas receiving a score of 2 or 3. Intensity scores for leptin did not significantly differ between the two sample types. These data suggest that while melanomas and nevi both produce a considerable amount of the leptin hormone, the receptor is found more frequently on the melanoma cells, providing the opportunity for dysregulated autocrine-stimulated growth in the malignant cells.
Figure 6.

Immunostaining of melanomas and nevi for ObR and leptin. Representative sections are shown. The melanoma expresses leptin and its receptor. The nevus is positive for leptin, as well, but negative for the receptor. AEC, 20x.
Table 1.
Comparison of IHC scores between nevi and melanomas
| Score | Nevi N (%) | Melanomas N (%) | Score | Nevi N (%) | Melanomas N (%) | ||
|---|---|---|---|---|---|---|---|
| ObR Percent | 0 | 9 (60.0) | 5 (31.2) | Leptin Percent | 0 | 4 (26.7) | 0 (0.0) |
| 1 | 5 (33.3) | 1 (6.2) | 1 | 0 (0.0) | 0 (0.0) | ||
| 2 | 1 (6.7) | 3 (18.8) | 2 | 6 (40.0) | 1 (9.1) | ||
| 3 | 0 (0.0) | 7 (43.8) | 3 | 5 (33.3) | 10 (90.9) | ||
| p = 0.009 | p = 0.004 | ||||||
|
| |||||||
| ObR Intensity | 0 | 6 (40.0) | 5 (31.2) | Leptin Intensity | 0 | 2 (13.3) | 0 (0.0) |
| 1 | 9 (60.0) | 3 (18.8) | 1 | 4 (26.7) | 1 (9.1) | ||
| 2 | 0 (0.0) | 1 (6.2) | 2 | 4 (26.7) | 4 (36.4) | ||
| 3 | 0 (0.0) | 7 (43.8) | 3 | 5 (33.3) | 6 (54.5) | ||
| p = 0.054 | p = 0.123 | ||||||
Discussion
In keeping with our previous data showing proliferative responses of melanoma cells to the metabolic hormones TRH and TSH, we now demonstrate a similar response to the hormone leptin. The unique aspect in this case is the fact that melanoma cells simultaneously express the leptin receptor and produce the hormone ligand, creating a potential autocrine loop by which dysregulated tumor growth can be supported. Furthermore, expression of leptin and ObR follows a progressive pattern across the spectrum of melanocytic cell types. Melanocytes express message for leptin and ObR, but little or no protein; nevi, as benign tumors, express high levels of leptin and low levels ObR; and melanoma cells express high levels of both. These findings lend credence to the concept that the proposed leptin autocrine loop is absent in normal cells, moderated in nevi, and uncontrolled in melanomas.
The pleuripotent nature of leptin is well-suited for exploitation by melanoma cells. Beyond its role in food intake and energy balance, leptin additionally functions as a pro-inflammatory “adipokine” with a broad range of activities including cytokine production, cellular immunity, and inflammation (12). Inflammatory processes, in particular, are highly relevant to melanoma progression. We have reported a strong correlation of tumor-expressed inducible nitric oxide synthase (iNOS) with shortened survival of Stage III melanoma patients (13). iNOS catalyzes the production of the inflammatory mediator nitric oxide (NO), which has been shown to protect melanoma cells from apoptosis (14). A stimulatory effect of leptin on nitric oxide production, secondary to enhanced expression of iNOS, is well-established, best demonstrated in vascular and neuronal systems (15–17). Similarly, expression of the inflammatory enzyme cyclooxygenase-2 (COX-2) by human melanomas predicts poor patient outcomes, and leptin has been shown to induce COX-2 in both normal and malignant cells (5, 18–20). Thus, a melanoma leptin autocrine loop may promote tumor growth through inflammatory mechanisms involving iNOS-, NO-, and COX-2-dependent pathways. Leptin may also promote tumor growth by signaling through normal endocrine pathways. Physiologic binding of leptin to its receptors on hypothalamic neurons leads to TRH production by these cells. We have previously shown that melanoma cells express TRH, as well, and that TRH induces proliferation of these cells (1). Our data now raise the possibility of leptin as an inducer of melanoma TRH production and secretion, accounting in part for its growth-promoting effects.
The elevation of circulating leptin levels in obese individuals has generated interest in a role for leptin in the development and progression of obesity-related cancers. Similar to our findings, data from breast cancer suggests that a high percentage of these tumors express both leptin and its receptor, although the clinical implications have not yet been established (21, 22). A small literature for prostate cancer also indicates that these tumors are capable of expressing both leptin and ObR (7). Furthermore, a case-control study revealed higher pre-diagnosis circulating leptin levels in prostate cancer patients relative to healthy individuals (23). In this study, these was no difference in body mass index between cases and controls raising the possibility that tumor-derived leptin contributed to the amount of circulating hormone. Little information exists to date regarding a role for leptin in the biology of melanoma, one of the few cancers not associated with obesity (24). Similar to prostate cancer, a small case-control study found elevated leptin levels to be associated with an increased risk for developing a melanoma, and the elevated leptin levels could not be attributed to obesity (25). One possibility is that individuals genetically predisposed to have higher circulating leptin levels, regardless of body mass, are at greater risk for the development of leptin-responsive tumors. Alternatively, the higher pre-diagnosis leptin levels seen in patients who develop these cancers may be a product of the developing tumor. If this is the case, serum leptin levels may serve as a screening tool and a marker of progression.
Taken together, there is mounting evidence for a role of leptin and ObR in cancer biology; our data now bring this process to the forefront in melanoma. Important issues for future research include the involvement of leptin signaling in melanoma inflammatory pathways and the possibility that tumor-derived leptin actually enters the circulation, elevating measurable levels and potentially functioning as a melanoma biomarker.
Acknowledgments
This work was supported by NIH K22 CA097983 (JAE); NIH P50 CA093459 (EAG, DGU, JAE); and NIH CA16672 (DNA Analysis Facility). Its contents are solely the responsibility of the authors and do not necessarily represent the official views of the National Institutes of Health.
References
- 1.Ellerhorst JA, Naderi AA, Johnson MK, Pelletier P, Prieto VG, Diwan AH, Johnson MM, Gunn DC, Yekell S, Grimm EA. Expression of thyrotropin releasing hormone by human melanoma and nevi. Clin Cancer Res. 2004;10:5531–5536. doi: 10.1158/1078-0432.CCR-03-0368. [DOI] [PubMed] [Google Scholar]
- 2.Ellerhorst JA, Sendi-Naderi A, Johnson MK, Cooke CP, Dang SM, Diwan AH. Human melanoma cells express functional receptors for thyroid stimulating hormone. Endocr Relat Cancer. 2006;13:1269–1277. doi: 10.1677/erc.1.01239. [DOI] [PubMed] [Google Scholar]
- 3.Fruhbeck G, Jebb SA, Prentice AM. Leptin: physiology and pathophysiology. Clin Physiol. 1998;18:399–419. doi: 10.1046/j.1365-2281.1998.00129.x. [DOI] [PubMed] [Google Scholar]
- 4.Fruhbeck G. Intracellular signalling pathways activated by leptin. Biochem J. 2006;393:7–20. doi: 10.1042/BJ20051578. [DOI] [PMC free article] [PubMed] [Google Scholar]
- 5.Gao J, Tian J, Lv Y, Shi F, Kong F, Shi H, Zhao L. Leptin induces functional activation of cyclooxygenase-2 through JAK2/STAT3, MAPK/ERK, and PI3K/AKT pathways in human endometrial cancer cells. Cancer Sci. 2009;100:389–395. doi: 10.1111/j.1349-7006.2008.01053.x. [DOI] [PMC free article] [PubMed] [Google Scholar]
- 6.Cirillo D, Rachiglio AM, la Montagna R, Giordano A, Normanno N. Leptin signaling in breast cancer: An overview. J Cell Biochem. 2008;105:956–964. doi: 10.1002/jcb.21911. [DOI] [PubMed] [Google Scholar]
- 7.Kim JH, Lee SY, Myung SC, Kim YS, Kim TH, Kim MK. Clinical significance of the leptin and leptin receptor expressions in prostate tissues. Asian J Androl. 2008;10:923–928. doi: 10.1111/j.1745-7262.2008.00438.x. [DOI] [PubMed] [Google Scholar]
- 8.Dieudonne MN, Machinal-Quelin F, Serazin-Leroy V, Leneveu MC, Pecquery R, Giudicelli Y. Leptin mediates a proliferative response in human MCF7 breast cancer cells. Biochem Biophys Res Commun. 2002;293:622–628. doi: 10.1016/S0006-291X(02)00205-X. [DOI] [PubMed] [Google Scholar]
- 9.Hardwick JCH, van den Brink GR, Offerhaus GJ, van Deventer SJH, Peppelenbosch MP. Leptin is a growth factor for colonic epithelial cells. Gastroenterology. 2001;121:79–90. doi: 10.1053/gast.2001.25490. [DOI] [PubMed] [Google Scholar]
- 10.Uffort DG, Grimm EA, Ellerhorst JA. NF-kappaB mediates mitogen-activated protein kinase pathway-dependent iNOS expression in human melanoma. J Invest Dermatol. 2009;129:148–154. doi: 10.1038/jid.2008.205. [DOI] [PMC free article] [PubMed] [Google Scholar]
- 11.Diwan AH, Dang SM, Prieto VG, Ellerhorst JA. Lack of maturation with anti-leptin receptor antibody in melanoma but not nevi. Mod Pathol. 2009;22:103–106. doi: 10.1038/modpathol.2008.166. [DOI] [PubMed] [Google Scholar]
- 12.Lago R, Gomez R, Lago F, Gomez-Reino J, Gualillo O. Leptin beyond body weight regulation – Current concepts concerning its role in immune function and inflammation. Cell Immunol. 2008;252:139–145. doi: 10.1016/j.cellimm.2007.09.004. [DOI] [PubMed] [Google Scholar]
- 13.Ekmekcioglu S, Ellerhorst JA, Prieto VG, Johnson MM, Broemeling L, Grimm E. Tumor inducible nitric oxide synthase (iNOS) predicts survival in stage III melanoma. Int J Cancer. 2006;119:861–866. doi: 10.1002/ijc.21767. [DOI] [PubMed] [Google Scholar]
- 14.Salvucci O, Carsana M, Bersani I, Tragni G, Anichini A. Antiapoptotic role of endogenous nitric oxide in human melanoma cells. Cancer Res. 2001;61:318–326. [PubMed] [Google Scholar]
- 15.Rodriguez A, Fortuno A, Gomez-Ambrosi J, Zalba G, Diez J, Fruhbeck G. The inhibitory effect of leptin on angiotensin II-induced vasoconstriction in vascular smooth muscle cells is mediated via a nitric oxide-dependent mechanism. Endocrinology. 2007;148:324–331. doi: 10.1210/en.2006-0940. [DOI] [PubMed] [Google Scholar]
- 16.Raso GM, Esposito E, Iacono A, Pacilio M, Coppola A, Bianco G, Diano S, Di Carlo R, Meli R. Leptin induces nitric oxide synthase type II in C6 glioma cells. Role for nuclear factor-κB in hormone effect. Neurosci Lett. 2006;396:121–126. doi: 10.1016/j.neulet.2005.11.022. [DOI] [PubMed] [Google Scholar]
- 17.Fruhbeck G. Pivotal role of nitric oxide in the control of blood pressure after leptin administration. Diabetes. 1999;48:903–908. doi: 10.2337/diabetes.48.4.903. [DOI] [PubMed] [Google Scholar]
- 18.Johansson CC, Egyhazi S, Masucci G, Harlin H, Mougiakakos D, Poschke I, Nilsson B, Garberg L, Tuominen R, Linden D, Stolt MF, Hansson J, Kiessling R. Prognostic significance of tumor iNOS and COX-2 in stage III malignant cutaneous melanoma. Cancer Immunol Immunother. 2008;58:1085–1094. doi: 10.1007/s00262-008-0631-1. [DOI] [PMC free article] [PubMed] [Google Scholar]
- 19.Inoue W, Poole S, Bristow AF, Luheshi GN. Leptin induces cyclooxygenase-2 via an interaction with interleukin-1 beta in the rat brain. Eur J Neurosci. 2006;24:2233–2245. doi: 10.1111/j.1460-9568.2006.05105.x. [DOI] [PubMed] [Google Scholar]
- 20.Ogunwobi O, Mutungi G, Beales IL. Leptin stimulates proliferation and inhibits apoptosis in Barrett’s esophageal adenocarcinoma cells by cyclooxygenase-2-dependent, prostaglandin-E2-mediated transactivation of the epidermal growth factor receptor and c-Jun NH2-terminal kinase activation. Endocrinology. 2006;147:4505–4516. doi: 10.1210/en.2006-0224. [DOI] [PubMed] [Google Scholar]
- 21.Garofalo C, Koda M, Cascio S, Sulkowska M, Kanczuga-Koda L, Golaszewska J, Russo A, Sulkowski S, Surmacz E. Increased expression of leptin and the leptin receptor as a marker of breast cancer progression: Possible role of obesity-related stimuli. Clin Cancer Res. 2006;12:1447–1453. doi: 10.1158/1078-0432.CCR-05-1913. [DOI] [PubMed] [Google Scholar]
- 22.Revillion F, Charlier M, Lhotellier V, Hornez L, Giard S, Baranzelli MC, Djiane J, Peyrat JP. Messenger RNA expression of leptin and leptin receptors and their prognostic value in 322 human primary breast cancers. Clin Cancer Res. 2006;12:2088–2094. doi: 10.1158/1078-0432.CCR-05-1904. [DOI] [PubMed] [Google Scholar]
- 23.Stattin P, Soderberg S, Hallmans G, Bylund A, Kaaks R, Stenman UH, Bergh A, Olsson T. Leptin is associated with increased prostate cancer risk: A nested case-referent study. J Clin Endocrinol Metab. 2001;86:1341–1345. doi: 10.1210/jcem.86.3.7328. [DOI] [PubMed] [Google Scholar]
- 24.Calle EE, Rodriguez C, Walker-Thurmond K, Thun MJ. Overweight, obesity, and mortality from cancer in a prospectively studied cohort of U.S. adults. N Engl J Med. 2003;348:1625–1638. doi: 10.1056/NEJMoa021423. [DOI] [PubMed] [Google Scholar]
- 25.Gogas H, Trakatelli M, Dessypris N, Terzidis A, Katsambas A, Chrousos GP, Petridou ET. Melanoma risk in association with serum leptin levels and lifestyle parameters: a case-control study. Ann Oncol. 2008;19:384–389. doi: 10.1093/annonc/mdm464. [DOI] [PubMed] [Google Scholar]