Abstract
An atomic-level insight into the functioning of articular cartilage would be useful to develop prevention strategies and therapies for joint diseases such as osteoarthritis. However, the composition and structure of cartilage, and their relationship to its unique mechanical properties are quite complex and pose tremendous challenges to most biophysical techniques. In this study, we present an investigation of the structure and dynamics of polymeric molecules of articular cartilage using time-resolved solid-state NMR spectroscopy during dehydration. Full-thickness cartilage explants were used in magic-angle spinning experiments to monitor the structural changes of rigid and mobile carbons. Our results reveal that the dehydration reduced the mobility of collagen amino acid residues and carbon sugar ring structures in glycosaminoglycans but had no effect on the trans-Xaa-Pro conformation. Equally interestingly, our results demonstrate that the dehydration effects are reversible, and the molecular structure and mobility are restored upon rehydration.
Keywords: Solid-state NMR, cartilage, dehydration effect, MAS, glycosaminoglycans
Introduction
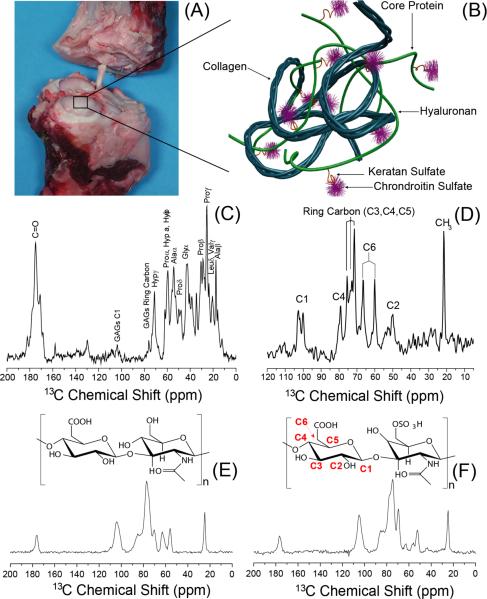
It is important to understand the mechanical and shock-absorbing strengths of cartilage in order to develop strategies to avoid rheumatic diseases and to slow their progression.1–3 While these intrinsic properties defining the function of cartilage should stem from the structural and dynamical organizations of its molecular constituents (~75% water, ~20% collagen, ~5% proteoglycans, and chondrocytes) (Figures 1A & 1B),1,4–7 it has been a major challenge to measure the molecular properties from an intact cartilage. The high-abundance of water, in particular, has been thought to play a major role in controlling the structure and dynamics of macromolecules and hence the function of cartilage in healthy and osteoarthritic joints.8,9 In this study, we report the effect of dehydration and rehydration of water in an intact cartilage at atomic-level resolution. To address this issue, we have developed a novel cell that controls the rate of dehydration during high-resolution nuclear magnetic resonance (NMR) experiments. Ramp-CP (cross-polarization)10 or INEPT (insensitive nuclei enhanced by polarization transfer)11,12 NMR experiments are used to identify molecular segments undergoing slow or fast molecular motions, and to monitor the changes in the dynamical structures of different molecules in cartilage.
Figure 1.
A bovine articular cartilage (A) and its molecular-level representation (B). 13C NMR spectra of cartilage obtained using Ramp-CP (C) and RINEPT (D) pulse sequences under 10 kHz MAS at 25 °C. Spectra were obtained using a Varian VNMRS 600 MHz solid-state NMR spectrometer and a 4 mm double resonance MAS probe. Other experimental parameters include a 2 ms ramp-cross-polarization time, a 80 kHz TPPM proton decoupling during acquisition, and a 3 s recycle delay were used. To obtain the spectrum (D), the RF-free time delays (i.e., all the tau periods in the –tau-180°-tau- sequence of RINEPT) to evolve the transverse magnetization under heteronuclear couplings in RINEPT were set to 500 ms delay to suppress resonances arising from rigid part of the molecules in cartilage. 13C Ramp-CP NMR spectra of hyaluronan (HA) (E) and chondroitin-6-sulfate (CS) (F) powder specimens obtained under 10 kHz MAS.
At the whole organ level, changes in the concentration or structure of water are implicated in cartilage thinning or lesion formation which can be visualized clinically by T2 or T2* weighted magnetic resonance imaging (MRI) of joints.9,13–24 At the molecular-level, cartilage becomes temporarily dehydrated during compression because water is squeezed out of extracellular matrix, causing negatively charged glycosaminoglycans (GAGs) to rearrange conformation, generating a swelling osmotic pressure to counter the compressive load.6,24,25 We hypothesized that dehydration primarily affects mobile atoms in GAGs and collagen, and that the effects of dehydration on molecular structure is reversible. The chemical structure of cartilage extracellular matrix molecules, such as collagen and GAGs, has been studied via microscopy,27 light scattering,28 viscometry,29 and atomic force microscopy (AFM).3,26 The NMR method used in this study enables the determination of molecular structure of these polymer-like components in situ, does not require extensive specimen preparation, and allows measurement of rigid and mobile molecular structures on a single specimen. By comparison, osmotic dehydration used in NMR and MRI studies requires 20–48 hours equilibration time.6,24 We expect that this approach can be applied to the analysis of any material where water is an important structural molecule including biological tissues, hydrogels, and thin films.
Materials and Methods
Preparation of bovine articular cartilage
Bovine articular cartilage specimen from a healthy young cow (about 6 months old) were obtained from a USDA-approved local slaughterhouse (Boyers Meat Processing, Canton, MI, USA) within 3 hours of death and frozen at −20 °C until used. Full-thickness cartilage specimens, including the calcified cartilage layer, were removed from undamaged sites on the femoral condyles using a sterile scalpel with care to not extract bone tissue and cut into ~1 mm × 2 mm rectangles. D2O-equilibrated cartilage was prepared by soaking bovine cartilage in calcium-buffered saline solution prepared with deuterium oxide (99.9% from Sigma Aldrich, St. Louis, MO, USA) for 72 hours with occasional mild shaking until use at −4°C. For the proteoglycan depletion, a cartilage specimen was incubated with 4 mM guanidine-HCl to remove the bulk of proteoglycan at room temperature for 48 hours, washed with excess PBS, and incubated in PBS enriched with 1 mg/ml trypsin (Sigma, St. Louis, MO, USA) for 12 hours at 25 °C with constant stirring to remove residual proteoglycans.
NMR spectroscopy
NMR experiments were carried out on a Varian VNMRJ 600 MHz solid-state NMR spectrometer equipped with a 4-mm triple-resonance MAS probe at room temperature (25 °C) under 10 kHz magic-angle spinning condition. A specially designed rotor (see Figure S1) was used for NMR measurements under a controlled dehydration process. 1H MAS spectra were recorded using a single pulse excitation. 13C MAS spectra were obtained using two different pulse sequences Ramp-CP and refocused-INEPT (RINEPT). A 2 ms contact time was used in the Ramp-CP pulse sequence, whereas 1 ms refocus delays were used in the evolution and refocusing periods of the RINEPT pulse sequence. A 80 kHz TPPM (two-pulse phase-modulation)30 was applied to decouple protons during signal acquisition.
Results and Discussion
It is highly important to preserve the frictionless motion between articular surfaces rendered by cartilage in order to avoid joint diseases like osteoarthritis. This unique property interestingly stems from the structural organization of molecular components constituting articular cartilage, particularly water, collagen and glycosaminoglycans. Therefore, there is a significant interest in understanding the high-resolution structural changes in collagen and GAGs (chondroitin sulfate, keratan sulfate and hyaluronan) due to dehydration and rehydration processes of cartilage.31,33 In this study, we report 13C MAS solid-state NMR measurements from an intact bovine cartilage at natural-abundance. Though cartilage contains different types of molecules with a varying abundance, its NMR spectrum can be simplified based on the difference in their time scale of motions as explained below.
RINEPT experiments reveal that GAGs in cartilage are highly mobile
Intact bovine cartilage explants were placed into a specially constructed NMR rotor, and the rotor was spun at the magic-angle. Two types of experiments that transfer magnetization from 1H to 13C were applied on this specimen: cross-polarization and RINEPT to selectively enhance 13C signal from rigid and mobile molecules from the cartilage tissue, respectively. The proton to carborn-13 polarization transfer from was achieved by the combined effects of C-H scalar (or J) and dipolar couplings in the RINEPT pulse sequence. The scalar coupling is a constant under the MAS condition, while dipolar coupling depends on the orientation of the related chemical bonds with respect to the external magnetic field. Modulation of CH and 1H-1H dipolar coupling under MAS and the distribution of dipolar couplings in the specimen will render the magnetization transfer extremely inefficient in the RINEPT pulse sequence. Therefore, to achieve a better magnetization transfer from proton to 13C, the strong C-H dipolar coupling (~35 kHz in a rigid specimen) needs to be suppressed to the order of J coupling (< 100 Hz); the strong 1H-1H dipolar couplings influencing the evolution of transverse magnetization also need to be suppressed for a better efficiency of the RINEPT sequence. The suppression of C-H and 1H-1H dipolar couplings could be due to the internal molecular motion or by fast MAS spinning. Under our 10 kHz MAS experimental condition, the 13C chemical shift spectral lines observed from the RINEPT experiment therefore should arise from highly mobile molecular constituents of cartilage; where the dynamics should have suppressed the C-H (and also 1H-1H) dipolar couplings to the order of the J-coupling during the RF-free delays used in RINEPT (tau=0.5 ms). On the other hand, the cross relaxation rate in the Ramp-CP pulse sequence depends on the strength of the C-H dipolar coupling. For the molecules with a weak dipolar coupling, the cross relaxation rate is too slow and insufficient for the 13C signal enhancement during the spin-lock time of the ramp-CP pulse sequence. Therefore, the spectral lines observed using the ramp-CP pulse sequence should arise from immobile molecular constituents of cartilage. Thus, by comparing spectra obtained using Ramp-CP and RINEPT pulse sequences, rigid and mobile structures present in cartilage can be identified.
As shown in Figures 1C and 1D, the two 13C chemical shift spectra of cartilage are significantly different; all experimentally measured chemical shift values and resonance assignment are summarized in Tables S1 and S2. The 13C Ramp-CP spectrum (Figure 1C) exhibits peaks (such as the peaks at 75, 105, and 182 ppm) primarily from collagen with some contribution from the rigid glycosaminoglycan's chain. On the other hand, the 13C spectrum obtained using the RINEPT pulse sequence (Figure 1D) consists of peaks from the sugar ring carbons of the mobile GAGs. Therefore, our NMR results suggest that cartilage GAGs undergo fast motions (microsecond time scale) whereas the motion of collagen falls in a slower time scale (millisecond time scale). The close resemblance of the 13C RINEPT spectrum (Figure 1D) with the 13C-Ramp-CP MAS spectrum of a pure powder specimen of chondroitin sulfate (Figures 1F) indicates that this type of glycosaminoglycan is more abundantly present in cartilage than hyaluronan (Figures 1E). Specifically, the spectral lines observed in the 50–60 and 70–80 ppm regions in Figures 1D and 1F are similar. This finding is in excellent agreement with previous reports in the literature.32,34–36 The large scale of observed motions for GAGs is mainly because more water molecules are associated with highly charged GAGs than with collagen. A recent study reported the feasibility of 1H-based HRMAS experiments on bovine patellar cartilage demonstrating the high mobility of GAG molecules in a fully-hydrated cartilage specimen.37 These results are also in excellent agreement with previous solid-state NMR studies based on the measurement of C-H dipolar couplings and 13C chemical shift anisotropy that predicted only 10–20% of water molecules are associated with collagen even though cartilage contains 70–80% water.5,31,38
Time-resolved MAS experiments to monitor slow dehydration process are feasible
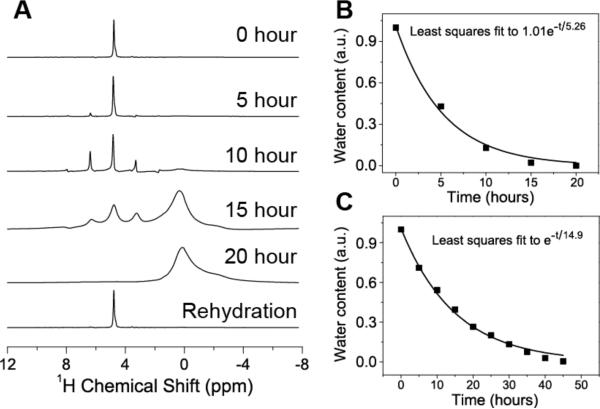
Since water plays an important role in the function of cartilage and the fraction of water molecules associated with collagen is far lower than that associated with GAGs, it is important to understand the water-dependent structural dynamics of these biopolymer constituents. To this end, we performed time-resolved MAS experiments to monitor the effects of dehydration and rehydration on cartilage. The dehydration of cartilage was achieved during specimen spinning because a 0.1 mm diameter hole was drilled into the cap of the sample rotor, which generated a negative pressure inside the rotor (Figure S1 given in the Supplementary Information). The dehydration rate was easily controlled by using a polyethylene insert inside the end cap to adjust the size and length of the hole on the cap. 1H (Figure 2), 13C (Figures 3–6), and 31P (data not included as they did not provide any useful information) MAS NMR experiments were performed to investigate the water-dependent structural changes in normal bovine cartilage. The hydration level in the cartilage was monitored from the intensity of the water 1H peak observed at 4.7 ppm from a series of 1H MAS spectra of cartilage obtained using a single pulse excitation (Figure 2). As shown in Figure 2, an exponential decay of water content was observed, and spectra of fully-hydrated cartilage (that is the specimen before dehydration) and rehydrated cartilage were identical (Figure 3). The reduction in the signal intensity, the appearance of spinning side bands from the water resonance, and the appearance of additional peaks in the spectra indicate the disappearance of free water and the decreased molecular mobility due to dehydration. These experimental results suggest that the dehydration process of a cartilage specimen inside an MAS rotor can be controlled and therefore the measurement of the extent of water on individual molecules can be probed as discussed below.
Figure 2.
(A) 1H NMR spectra of cartilage recorded at different times of dehydration and rehydration at PBS buffer for 2 minutes. Time dependence of water content in wet cartilage specimen during fast (B) and slow (C) dehydration processes. Spectra given in (C) were obtained with a slow dehydration process by inserting polyethylene in the hole of the rotor. The water content was measured by calculating the area of water peak in the 1H NMR spectrum that was obtained using a single 5 μs excitation pulse, 100 ms data acquisition and a 10 s recycle delay.
Figure 3.
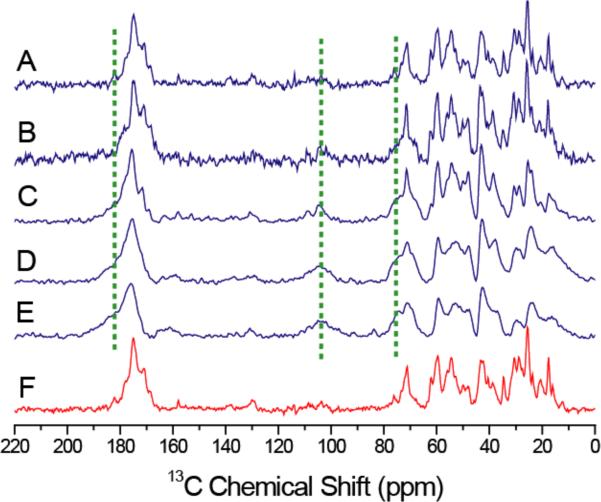
13C Ramp-CP NMR spectra of cartilage recorded under 10 kHz MAS conditions for (A) 0 (100 % hydration), (B) 5 (~50 % hydration), (C) 10 (~15 % hydration), (D) 15 (~2 % hydration), and (E) 20 (<1% hydration) hours of dehydration, and (F) after 30 hours of equilibration in calcium PBS buffer (100 % hydration). It should be noted that the extent of hydration mentioned here is an approximate value as 5 hours of data acquisition was used to obtain each 13C spectrum. Other experimental parameters are as given in Figure 1 caption.
Figure 6.
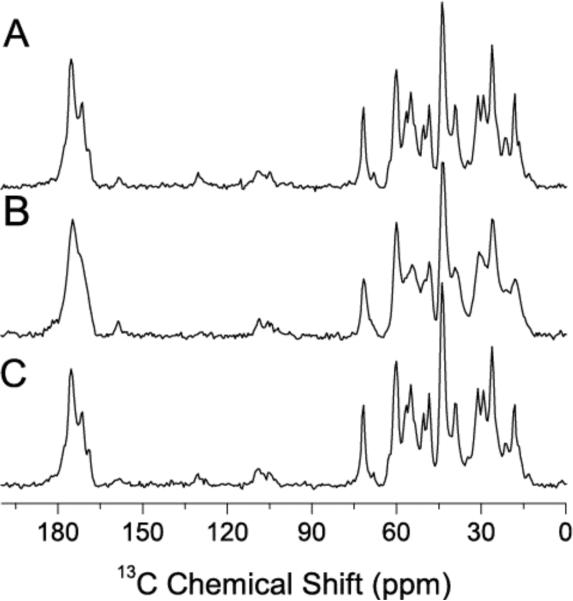
13C Ramp-CP NMR spectra of cartilage obtained under MAS after enzymatic removal of proteoglycan in (A) hydrated, (B) dehydrated, and (C) rehydrated states.
Changes in the intensity and width of peaks in 13C spectra were used as NMR markers to measure any dehydration-induced changes in the molecular structure of cartilage as explained below. For comparison, another series of 13C NMR spectra was measured from cartilage with the distal end cap tightly sealed to prevent evaporation. No spectral changes were observed for even after 24 hours of spinning the specimen (data not shown). Since the main component in the mineral of cartilage is hydroxyapatite, 31P NMR was used to probe the phosphate mineral in calcified cartilage during the dehydration process; but 31P spectra dominated by a peak from the phosphate buffer did not provide any valuable information (data not included). 13C spectra of cartilage with deuterium exchange and Raman spectroscopy (Figure S2) on cartilage were also performed to monitor the dehydration process.
Dehydration reduces the mobility but without denaturing the molecular components and their structure in cartilage
Since Ramp-CP and RINEPT experiments can be used to monitor the dynamics of molecules in cartilage, a series of 13C spectra were obtained as a function of a controlled dehydration process from a cartilage specimen. At the same time, 13C isotropic chemical shift values can be used to understand the backbone conformation. The recorded 13C Ramp-CP and RINEPT spectra on cartilage are given in Figures 3 and 4 respectively. The observed GAGs peaks in the Ramp-CP spectra are indicated using dashed lines. The dehydration of the cartilage specimen did not change the observed isotropic chemical shift values in Ramp-CP spectra (Figure 3) suggesting that the main triple-helical conformation of collagen does not depend on the amount of water associated. For example, the presence of peaks in the carbonyl region (~170 ppm) and a 17.5 ppm peak from 13Cβ Ala strongly suggest the triple-helical structure of collagen in cartilage remains even when it was dehydrated.5 In addition, a 5.2 ppm difference between 13Cβ (30.5 ppm) and 13Cγ (25.3 ppm) chemical shifts of Pro residue observed in this study confirms the presence of a trans-Xaa-Pro conformation in collagen.13 However, the broadening of spectral lines observed with dehydration suggests a reduction in the dynamics of collagen and possibly a slight increase in the conformational disorder. The 13Cγ (25.3 ppm) peak from hydroxyproline is highly sensitive to the hydration level as this residue plays an important role due to its extra hydrogen-bonding capability. The excellent agreement between our results obtained from an intact cartilage and that from collagen fibrils38 suggests that the structural and dynamical properties of collagen are similar in both types of specimens. The increase in collagen flexibility observed in these specimens, as more water molecules bind to polar groups of collagen when the hydration level is increased, not only contributes to the viscoelastic and mechanical properties of cartilage but also the key in the calcium phosphate biomineralization process.
Figure 4.
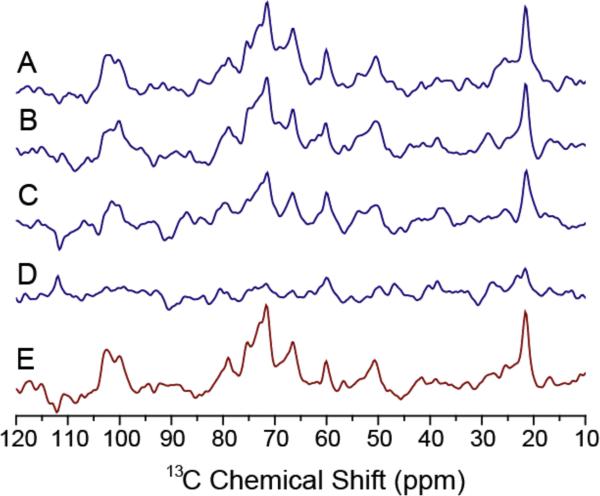
Carbon-13 NMR spectra of cartilage obtained using the RINEPT pulse sequence under 10 kHz MAS for (A) 0 (100 % hydration), (B) 5 (~50 % hydration), (C) 10 (~15 % hydration), and (D) 15 (~2 % hydration) hours of dehydration, and (E) after 30 hours of equilibration in calcium PBS buffer (100 % hydration). Other experimental parameters are as given in Figure 1 caption.
The increasing appearance of peaks at 75, 105 and 182 ppm in the spectra suggest that the mobility of GAGs is considerably reduced so that the cross-polarization is more efficient due to stronger C-H dipolar couplings as water is removed from cartilage (indicated by dashed lines in Figure 3). For example, the signal intensity of GAGs at ~75 ppm increased and overlapped with the peak of Hyp Cγ from collagen at ~ 71 ppm as a consequence of dehydration as shown in Figure 3E. Further, two broad peaks from C2–C6 peaks of GAGs appeared at 71 ppm and 76 ppm. The appearance of C1 peaks from GAGs at ~ 110 ppm is clear after ~10 hours of dehydration. This observation is understandable as more water is associated with the charged GAG molecules and the dehydration process is expected to have a significant effect on the spectral lines from GAGs.
The close resemblance of the spectrum of a rehydrated specimen to that of the initial fully-hydrated cartilage specimen (before the dehydration process) is very interesting. In fact, the peaks arising from GAGs also disappear due to rehydration of the specimen due to the increased motion that considerably suppresses the cross-polarization. This observation suggests that the macromolecular assembly enable the dehydration and rehydration processes without resulting in a major damage to their structures or the molecular architecture of cartilage. This dehydration/rehydration behavior of the whole cartilage system can be compared to the action of sponge towards dehydration and absorption of water. Our results also suggest that the dynamics of collagen and GAGs can be controlled by dehydration and rehydration processes. Therefore, the dynamics of collagen and GAGs play a major role in the function of cartilage.
RINEPT reveals the reduction in the mobility of GAGs
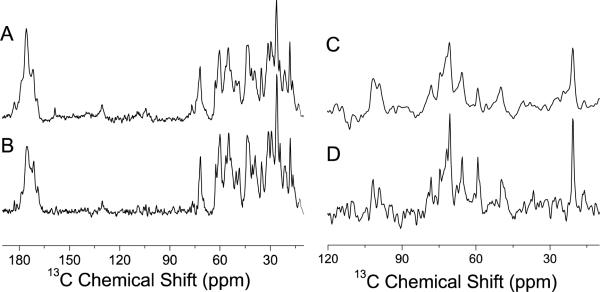
As mentioned above, the 1H/13C RINEPT sequence was used to detect mobile carbon structures, with the main contributions arising from chondroitin sulfate, the most abundant GAG in cartilage, with minor contributions from keratin sulfate and hyaluronan. Since GAGs are associated with a large amount of water molecules, the removal of water molecules through dehydration decreased the overall intensity of spectral lines and increased the line width as shown in Figure 4. There was no observable 13C signal after 30 hours of dehydration (~87% water loss estimated from 1H spectra). These data further confirm the increasing rigidity of polysaccharide chains of GAGs with dehydration; the rigid molecules do not respond to RINEPT but do respond to Ramp-CP as explained earlier.32,25,39 Interestingly, the 13C RINEPT spectrum of cartilage after rehydration (see Figure 4E) is very similar (if not identical) to the fully-hydrated intact cartilage (Figure 1D). To further confirm this observation, spectra were obtained from a cartilage specimen that was rehydrated using D2O (Figure 5). The spectra of the D2O hydrated specimens resemble that of the native specimen and narrowing of spectral lines were observed as the H/D exchange suppress the residual proton dipolar couplings. This observation suggests that the removal of water molecules does not denature cartilage while the rehydration process (even as short as 2 minutes rehydration) fully restores the architecture of cartilage back to normal. This further suggests that any dehydration-induced changes in the structure and dynamics of molecules and intermolecular interactions are reversible upon hydration. Therefore, we believe that this complete reversibility of the flexibility of GAGs and collagen molecules play important roles in the viscoelasticity and mechanical properties of cartilage.
Figure 5.
13C Ramp-CP NMR spectra of (A) hydrated cartilage and (B) cartilage exchanged in PBS buffer made with D2O. 13C RINEPT NMR spectra of cartilage in PBS buffer (C) and in PBS buffer made with D2O (D).
Removal of GAGs does not alter collagen structure but influence its flexibility
In order to fully understand the dehydration effect on collagen structure present in cartilage and to probe the interactions between collagen and GAGs, we removed the proteoglycan using a published procedure.4013C Ramp-CP MAS spectra of GAGs-removed cartilage specimens were obtained (Figure 6). Though the NMR spectra of fully-hydrated intact (Figure 3A) and GAGs-free (Figure 6A) cartilage are similar, significant differences can be seen in spectra of corresponding dehydrated specimens (see Figures 3B–E and Figure 6B). For example, the broad peaks from GAGs appearing ~75 ppm and ~185 ppm due to dehydration in an intact cartilage (as seen in Figures 3B–E) are absent in GAGs-removed cartilage (Figure 6B). The relatively narrow spectral lines in the GAGs-free specimen (Figure 6B) suggest that the presence of GAGs introduces additional heterogeneity to the dynamically disordered collagen upon dehydration. On the other hand, the spectra of rehydrated specimens (shown in Figures 3F and 6C) are similar as well. Therefore, the observed similarities and differences between these spectra of specimens with and without GAGs suggest that the removal of GAGs does not change the structure of collagen in cartilage but the change in the flexibility of collagen molecules is influenced by GAGs in cartilage.
Conclusions
Understanding the molecular structure of cartilage extracellular matrix molecules continues to be a significant challenge. We chose bovine articular cartilage as a model system for these NMR experiments because the molecular structure of cartilage extracellular matrix molecules depends on the extensive interactions that occur in situ. High-resolution MAS solid-state NMR experiments in combination with time-resolved hydration/rehydration processes were used to probe the dynamical structures of molecular components of cartilage at atomic-level resolution. As demonstrated by the experimental results in this study, the use of Ramp-CP and RINEPT preparation pulse sequences is a powerful method to differentiate the rigid and mobile molecular components present in intact cartilage, and to selectively detect and characterize the type of GAGs in cartilage. Though it is possible to directly obtain 13C MAS spectra of GAGs from cartilage, the use of the RINEPT pulse sequence under MAS enhances the sensitivity of detection. Results from our study show that the dehydration process affected both rigid and mobile structures of molecular components, with most of the changes appearing from a change in the time scale of motions for collagen and the GAG ring structure. Not only did this study provide insights into the structural role of water in cartilage, but also served as a model for studying dehydration effects in tissues, hydrogels or thin films. Particularly, a combination of HRMAS and RINEPT would be a powerful approach in the high-resolution dynamical structural studies of cartilage, tissues and bone materials.7,41–47 It is worth noting that unlike other techniques that require enzymatic digestion, extraction, fixation, cryopreservation or cryosectioning, the NMR methods described here require little specimen preparation and minimal amounts of tissue.
Supplementary Material
Acknowledgements
This research was supported by NIH (AR056657 and RR023597) and CRIF-NSF. We thank Dr. Karen Esmonde-White for helping us with the interpretation of Raman spectra and critical reading of the manuscript
Footnotes
Supporting Information Details about the rotor used to perform MAS experiments during the dehydration process (Figure S1), Raman spectrum (Figure S2), and chemical shift values (Tables ST1 and ST2) are included. This material is available free of charge via the internet at http://pubs.acs.org.
References
- (1).Cohen NP, Foster RJ, Mow VC. J. Orthop. Sports Phys. Ther. 1998;28:203–15. doi: 10.2519/jospt.1998.28.4.203. [DOI] [PubMed] [Google Scholar]
- (2).Kirk TB, Wilson AS, Stachowiak GW. J. Orthop. Rheumatol. 1993;6:21–28. [Google Scholar]
- (3).Kumar P, Oka M, Toguchida J, Kobayashi M, Uchida E, Nakamura T, Tanaka K. J. Anat. 2001;199:241–50. doi: 10.1046/j.1469-7580.2001.19930241.x. [DOI] [PMC free article] [PubMed] [Google Scholar]
- (4).Naji L, Kaufmann J, Huster D, Schiller J, Arnold K. Carbohydr. Res. 2000;327:439–46. doi: 10.1016/s0008-6215(00)00064-1. [DOI] [PubMed] [Google Scholar]
- (5).Huster D, Schiller J, Arnold K. Magn. Reson. Med. 2002;48:624–32. doi: 10.1002/mrm.10272. [DOI] [PubMed] [Google Scholar]
- (6).Zernia G, Huster D. NMR Biomed. 2006;19:1010–9. doi: 10.1002/nbm.1061. [DOI] [PubMed] [Google Scholar]
- (7).Duer MJ, Friscić T, Murray RC, Reid DG, Wise ER. Biophys. J. 2009;96:3372–8. doi: 10.1016/j.bpj.2008.12.3954. [DOI] [PMC free article] [PubMed] [Google Scholar]
- (8).Saitô H, Yokoi M. J. Biochem. 1992;111:376–82. doi: 10.1093/oxfordjournals.jbchem.a123765. [DOI] [PubMed] [Google Scholar]
- (9).Shapiro EM, Borthakur A, Kaufman JH, Leigh JS, Reddy R. Osteoarthr. Cartilage. 2001;9:533–8. doi: 10.1053/joca.2001.0428. [DOI] [PubMed] [Google Scholar]
- (10).Metz G, Wu XL, Smith SO. J. Magn. Reson. A. 1994;110:219–227. [Google Scholar]
- (11).Morris GA, Freeman R. J. Am. Chem. Soc. 1979;101:760–762. Ramamoorthy, A.; Chandrakumar, N. J. Magn. Reson. 1992, 100, 60–68. [Google Scholar]
- (12).Elena B, Lesage A, Steuernagel S, Böckmann A, Emsley L. J. Am. Chem. Soc. 2005;127:17296–302. doi: 10.1021/ja054411x. [DOI] [PubMed] [Google Scholar]
- (13).Shinar H, Navon G. NMR Biomed. 2006;19:877–893. doi: 10.1002/nbm.1068. [DOI] [PubMed] [Google Scholar]
- (14).Witschey WRT, Borthakur A, Fenty M, Kneeland BJ, Lonner JH, McArdle EL, Sochor M, Reddy R. Magn. Reson. Med. 2010;63:1376–82. doi: 10.1002/mrm.22272. [DOI] [PMC free article] [PubMed] [Google Scholar]
- (15).Borthakur A, Mellon E, Niyogi S, Witschey W, Kneeland JB, Reddy R. NMR Biomed. 2006;19:781–821. doi: 10.1002/nbm.1102. [DOI] [PMC free article] [PubMed] [Google Scholar]
- (16).Welsch GH, Mamisch TC, Hughes T, Zilkens C, Quirbach S, Scheffler K, Kraff O, Schweitzer ME, Szomolanyi P, Trattnig S. Invest. Radiol. 2008;43:619–26. doi: 10.1097/RLI.0b013e31817e9122. [DOI] [PubMed] [Google Scholar]
- (17).Domayer SE, Welsch GH, Dorotka R, Mamisch TC, Marlovits S, Szomolanyi P, Trattnig S. Semin. Musculoskel. R. 2008;12:302–17. doi: 10.1055/s-0028-1100638. [DOI] [PubMed] [Google Scholar]
- (18).Reddy R, Insko EK, Noyszewski EA, Dandora R, Kneeland JB, Leigh JS. Magn. Reson. Med. 1998;39:697–701. doi: 10.1002/mrm.1910390505. [DOI] [PubMed] [Google Scholar]
- (19).Keinan-Adamsky K, Shinar H, Navon G. Magn. Reson. Med. 2006;55:532–40. doi: 10.1002/mrm.20775. [DOI] [PubMed] [Google Scholar]
- (20).Borthakur A, Hancu I, Boada FE, Shen GX, Shapiro EM, Reddy R. J. Magn. Reson. 1999;141:286–90. doi: 10.1006/jmre.1999.1923. [DOI] [PubMed] [Google Scholar]
- (21).Shinar H, Seo Y, Ikoma K, Kusaka Y, Eliav U, Navon G. Magn. Reson. Med. 2002;48:322–30. doi: 10.1002/mrm.10195. [DOI] [PubMed] [Google Scholar]
- (22).Regatte RR, Kaufman JH, Noyszewski EA, Reddy R. J. Magn. Reson. Imag. 1999;10:961–7. doi: 10.1002/(sici)1522-2586(199912)10:6<961::aid-jmri8>3.0.co;2-a. [DOI] [PubMed] [Google Scholar]
- (23).Regatte RR, Akella SVS, Wheaton AJ, Lech G, Borthakur A, Kneeland JB, Reddy R. Acad. Radiol. 2004;11:741–9. doi: 10.1016/j.acra.2004.03.051. [DOI] [PubMed] [Google Scholar]
- (24).Saar G, Shinar H, Navon G. Eur. Biophys. J. 2007;36:529–38. doi: 10.1007/s00249-006-0098-y. [DOI] [PubMed] [Google Scholar]
- (25).Cowman MK, Matsuoka S. Carbohydr. Res. 2005;340:791–809. doi: 10.1016/j.carres.2005.01.022. [DOI] [PubMed] [Google Scholar]
- (26).Giannotti MI, Rinaudo M, Vancso GJ. Biomacromolecules. 2007;8:2648–52. doi: 10.1021/bm700592j. [DOI] [PubMed] [Google Scholar]
- (27).Guilak F, Ratcliffe A, Mow VC. J. Orthop. Res. 1995;13:410–21. doi: 10.1002/jor.1100130315. [DOI] [PubMed] [Google Scholar]
- (28).Moger CJ, Arkill KP, Barrett R, Bleuet P, Ellis RE, Green EM, Winlove CP. J. Biomech. Eng. 2009;131:031008. doi: 10.1115/1.3049478. [DOI] [PubMed] [Google Scholar]
- (29).Hardingham TE. Biochem. J. 1979;177:237–47. doi: 10.1042/bj1770237. [DOI] [PMC free article] [PubMed] [Google Scholar]
- (30).Bennett AE, Rienstra CM, Auger M, Lakshmi KV, Griffin RG. J. Chem. Phys. 1995;103:6951–6958. [Google Scholar]
- (31).Huster D. Annu. Rep. NMR Spectrosc. 2008;64:127–159. [Google Scholar]
- (32).Schulz J, Pretzsch M, Khalaf I, Deiwick A, Scheidt HA, Salis-Soglio G, Bader A, Huster D. Calcif. Tissue Int. 2007;80:275–85. doi: 10.1007/s00223-007-9007-3. [DOI] [PubMed] [Google Scholar]
- (33).Salzbrenner F, Böhme J, Scheidt HA, Gründer W, Rammelt S, Schulz-Siegemund M, Huster D. NMR Biomed. 2011 doi: 10.1002/nbm.1649. in press. [DOI] [PubMed] [Google Scholar]
- (34).Cowman MK, Hittner DM, Feder-Davis J. Macromolecules. 1996;29:2894–2902. [Google Scholar]
- (35).Schiller J, Naji L, Huster D, Kaufmann J, Arnold K. Magma. 2001;13:19–27. doi: 10.1007/BF02668647. [DOI] [PubMed] [Google Scholar]
- (36).Scheidt HA, Schibur S, Magalhães A, de Azevedo ER, Bonagamba TJ, Pascui O, Schulz R, Reichert D, Huster D. Biopolymers. 2010;93:520–32. doi: 10.1002/bip.21386. [DOI] [PubMed] [Google Scholar]
- (37).Ling W, Regatte RR, Schweitzer ME, Jerschow A. NMR Biomed. 2008;21:289–95. doi: 10.1002/nbm.1193. [DOI] [PubMed] [Google Scholar]
- (38).Reichert D, Pascui O, DeAzevedo ER, Bonagamba TJ, Arnold K, Huster D. Magn. Reson. Chem. 2004;42:276–84. doi: 10.1002/mrc.1334. [DOI] [PubMed] [Google Scholar]
- (39).Huckerby TN, Nieduszynski IA, Giannopoulos M, Weeks SD, Sadler IH, Lauder RM. FEBS J. 2005;272:6276–86. doi: 10.1111/j.1742-4658.2005.05009.x. [DOI] [PubMed] [Google Scholar]
- (40).Verbruggen G, Luyten FP, Veys EM. J. Rheumatol. 1985;12:665–74. [PubMed] [Google Scholar]
- (41).Santos RA, Wind RA, Bronnimann CE. J. Magn. Reson. B. 1994;105:183–187. doi: 10.1006/jmrb.1994.1120. [DOI] [PubMed] [Google Scholar]
- (42).Best SM, Duer MJ, Reid DG, Wise ER, Zou S. Magn. Reson. Chem. 2008;46:323–9. doi: 10.1002/mrc.2168. [DOI] [PubMed] [Google Scholar]
- (43).Wise ER, Maltsev S, Davies ME, Duer MJ, Jaeger C, Loveridge N, Murray RC, Reid DG. Chem. Mater. 2007;19:5055–5057. [Google Scholar]
- (44).Mukherjee S, Song Y, Oldfield E. J. Am. Chem. Soc. 2008;130:1264–1273. doi: 10.1021/ja0759949. [DOI] [PubMed] [Google Scholar]
- (45).Zhu P, Xu J, Sahar N, Morris MD, Kohn DH, Ramamoorthy A. J. Am. Chem. Soc. 2009;131:17064–17055. doi: 10.1021/ja9081028. [DOI] [PMC free article] [PubMed] [Google Scholar]
- (46).Xu J, Zhu P, Gan Z, Sahar N, Tecklenburg M, Morris MD, Kohn DH, Ramamoorthy A. J. Am. Chem. Soc. 2010;132:11504–11509. doi: 10.1021/ja101961x. [DOI] [PMC free article] [PubMed] [Google Scholar]
- (47).Hu Y-Y, Rawal A, Schmidt-Rohr K. Proc. Natl. Acad. Sci. USA. 2010;107:22425–22429. doi: 10.1073/pnas.1009219107. [DOI] [PMC free article] [PubMed] [Google Scholar]
Associated Data
This section collects any data citations, data availability statements, or supplementary materials included in this article.


