

Abstract
OBJECTIVES
Further validation of an index predicting mortality among community-dwelling older adults.
DESIGN, SETTING, AND PARTICIPANTS
We compared performance of the index in predicting mortality among 22,057 new respondents to the National Health Interview Survey (NHIS, years 2001-2004) to 24,139 respondents from the original development and validation cohorts (years 1997-2000). We also tested its performance over extended follow-up (up to 9 years) using the original cohorts. Follow-up mortality data were available through 2006.
MEASUREMENTS
We calculated risk scores for each respondent based on the presence or absence of 11 factors (function, illnesses, behaviors, demographics) that make up the index. Using the Kaplan Meier method, we computed 5-year mortality estimates for the new and original cohort respondents and 9-year mortality estimates for the original cohorts.
RESULTS
New respondents were similar to original cohort respondents but were slightly more likely to be aged 85+, report diabetes, and/or a BMI of 25+. The model performed as well in the new cohort as it had in the original cohorts. New respondents with risk scores of 0-1 had a 2% risk of 5-year mortality while respondents who scored 18+ had a 69% risk of 5-year mortality (range 3% to 71% risk of 5-year mortality among the development cohort). The index also demonstrated excellent calibration and discrimination in predicting 9-year mortality (range 7% risk for scores of 0-1 to 92% risk for scores of 18+, original validation cohort extended).
CONCLUSIONS
These results further justify use of this index to estimate patient life expectancy in clinical decision-making.
Keywords: mortality prediction, life expectancy, prevention, older adults
INTRODUCTION
The ability to predict patient life expectancy is becoming increasingly important in deciding which medical services to recommend for older adults. Experts recommend that patient life expectancy be considered in decisions around cancer screening,1,2 diabetes management,3 deciding whether or not a patient should go for certain surgeries (e.g., abdominal aortic aneurysm repair,4 joint replacements5), among other clinical decisions. To help clinicians, researchers, and policy makers estimate patient life expectancy, we previously developed and validated an index to predict 5-year mortality among adults aged 65 and older using data from the 1997-2000 National Health Interview Survey (NHIS), a nationally representative sample of non-institutionalized adults. Outcome data on mortality were available from the National Death Index (NDI) through December 31, 2002.6 We developed the index by randomly selecting two-thirds of the sample for the development cohort and used the remaining one-third of the sample to validate our results.
Our index predicted mortality as well in the validation cohort as it did in the development cohort. 6 Vital to clinicians; however, is whether the index can accurately predict mortality when used on their own patients. The best way to demonstrate the precision of our index among patients would be to test the model in a clinical setting. However, such validation generally takes years, significant resources, and a large number of clinic patients. Meanwhile, we can gain important new information about the performance of the index by testing its predictive abilities on new respondents to the NHIS and by testing how well the index predicts mortality over longer follow-up periods.7 These data are important, since prognostic indices often fail to perform as well in new settings as they did in the original development and validation cohort, and yet few prognostic models are validated after initial publication.8
Recently, the National Center for Health Statistics (NCHS) publicly released data from NHIS survey years 2001-2004 linked with mortality files through December 31, 2006. They also updated mortality information through 2006 for survey years 1997-2000. These new data allow our index to be validated further and answer the questions: 1) how well does the model work on a new group of subjects? and 2) how well does the model work when a different time interval is used? Demonstrating that the mortality index performs well in these new settings would further justify the use of the index for estimating patient life expectancy.
METHODS
The NHIS is conducted annually and is the principal source of information on the health of the civilian non-institutionalized population of the United States. 9 The NHIS, conducted by the National Center for Health Statistics, collects information on individuals’ general health status, distribution of acute and chronic illness, functional limitation, access to and use of medical services, and insurance coverage. The survey, redesigned in 1997, consists of several components, including a Family and Sample Adult Core that remain largely unchanged from year to year. The Sample Adult Core collects detailed health information from one randomly selected adult who was at home at the time of the survey. Data on mortality of NHIS participants is ascertained from a probabilistic match between NHIS and National Death Index (NDI) death certificate records. In brief, the NDI uses social security number, sex, last name, first initial, and/or information on date of birth to identify potential matches between NDI records and NHIS respondents. NCHS then assigns a score to each potential match reflecting the degree of agreement between identifying data in NHIS and in NDI records. Greater weight is placed on more important identifying factors such as social security number. A cut-off score is used to define whether the highest scoring potential match is likely a true match.9 Methods of matching correctly identify an estimated 99% of all living NHIS respondents and 97% of those who died.10 The mean participation rate for NHIS years 1997-2004 was 73.9% (range 80.4% in 1997 to 69.6% in 1999).
Brief Review of Development of the Mortality Index
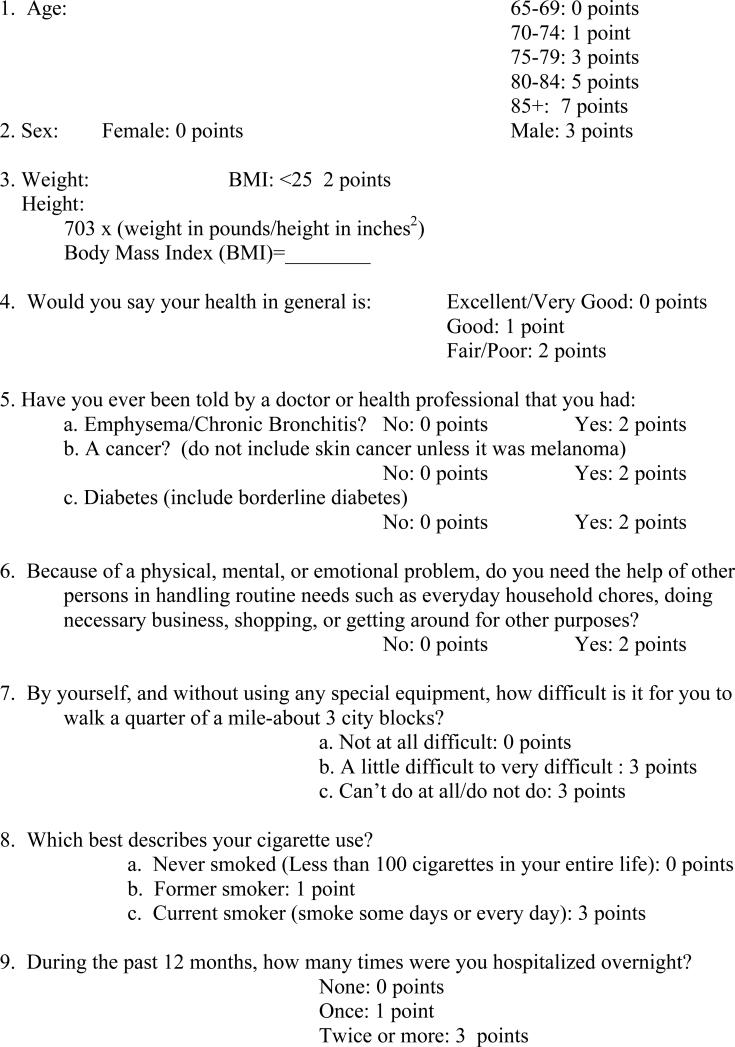
As described previously, we used data from National Health Interview Survey (NHIS) years 1997-2000 with follow-up from the NDI through December 31, 2002 to develop our index.6 We initially considered 41 risk factors associated with mortality available in the NHIS. We chose not to consider race/ethnicity or socioeconomic variables in the development of our index since the association of these variables with mortality may be partly due to differences in quality of care and we did not want to develop an index where decision-making around resources would be based on patient income or race. We used Cox proportional hazards regression models and backwards elimination to determine which factors were most significantly and independently associated with mortality. Our final model included 11 factors: sex, age (65-69, 70-74, 75-79, 80-84, and ≥85), smoking status (current, former, never [<100 cigarettes in lifetime]), body mass index-BMI (<25 or 25+), dependency in at least one instrumental activity of daily living (IADL: handling household chores, doing necessary business, shopping or getting around for other purposes); any reported difficulty with walking ¼ mile, hospitalizations in the past year (0, 1, ≥2), and whether a doctor ever told them they had: emphysema/chronic bronchitis (we combined these variables into one for a diagnosis of chronic obstructive pulmonary disease or COPD), diabetes (including borderline), and/or cancer (excluding non-melanomatous skin cancer). Based on the final model's beta coefficients we assigned points for each factor. A mortality risk score was then calculated for each respondent based on the presence or absence of these risk factors. The risk of 5-year mortality was determined for each risk score for adults in the development cohort and then compared to adults in the validation cohort. A copy of the index with point values can be found in Appendix A.
Appendix A.
Five-year Mortality Index for Adults Aged 65 and Older.
|
Current Study Sample
For the current study, we considered the following populations: 1) we included a new validation cohort with the respondents to NHIS survey years 2001-2004 with follow-up to 2006 to test the accuracy of our model in new subjects (n=23,790), 2) we retained our original cohort, which included the development and validation cohorts from survey years1997-2000 with follow-up to 2002 for reference and comparison (n=25,488), and 3) we the extended follow-up of our development and original validation cohort, up to 9 years, to evaluate the model's ability to discriminate when applied to longer time intervals.
We excluded 1,130 respondents from our original cohort and 1,428 respondents from our new validation cohort because these individuals had insufficient identifying data to link with the NDI. Although, the NHIS does not directly ask participants about a history of dementia, we further excluded 219 individuals from our original cohort and 305 individuals from our new validation cohort who answered affirmatively to a question about having dementia, to focus on older adults able to provide valid self-report. Our final sample includes 24,139 respondents from our original cohort and 22,057 respondents from our new validation cohort. In our initial report, our original cohort included 24,115 respondents rather than 24,139. With the additional follow-up time, NHIS was able to generate a valid match with the NDI for 49 additional adults; however, there were 25 adults previously included for whom there was now insufficient data to determine vital status (explaining the net gain of 24 respondents from our initial study). 6 Although proxy respondents were not permitted for survey years 1997-2000, we chose to include 498 proxy respondents in our new validation cohort in order to improve the generalizability of the index in clinical populations.
Survival Outcomes
Respondents were assigned a vital status code (0=assumed alive; 1=assumed deceased) based on their status as of December 31, 2006. NCHS provides sampling weights that account for adults who were not matched successfully, which are used in mortality analyses to produce nationally representative estimates. We measured survival time from the date of the respondents’ interview until death or end of the follow-up period (12/31/2006), whichever came first.
Statistical Analysis
We compared the prevalence of each factor of interest (age, sex, BMI, perceived health, history of COPD, cancer [excluding non-melanomatous skin cancer], diabetes, IADL dependency, difficulty walking a quarter mile, tobacco use, and hospitalizations in the past year) between the original cohort and the new validation cohort using chi-square statistics. Some proportions for the original cohort differ slightly from our initial report, since we are now reporting on data from the entire sample rather than just the development cohort, and we have follow-up data for more individuals, which affect the sampling weights. Due to the size of our sample, we decided a priori to consider only p values of <0.0001 to be significant. Using the points assigned for each risk factor determined from the original validation cohort, we calculated a mortality risk score for each respondent in the new validation cohort. We excluded respondents missing data on one or more of the factors of interest (n=1,083 or 4.5%), leaving 20,974 respondents for analyses using our new validation cohort. We also recalculated mortality through 2002 for respondents in the original cohort. When we developed the index, we excluded individuals missing data on any of the 41 factors considered for the model (n=2,894 or 12.0%), leaving an analytic sample of 21,221 respondents. Our results vary slightly from our initial report since we were able to include 1,894 more participants in our original cohort (n=23,115). We stratified risk scores into quintiles and calculated estimates for 5-year mortality by quintile using the Kaplan-Meier method. We used descriptive statistics to compare estimated 5-year mortality between the development cohort, the original validation cohort, and the new validation cohort. We also calculated estimates for 5-year mortality for finer gradations of the raw point scores and plotted calibration curves. Calibration curves illustrate how well the predicted outcomes in the new validation cohort and the original validation cohort compare with the observed outcomes from the development cohort.6 In addition, we used the Kaplan-Meier method to calculate estimated 9-year mortality for individuals in our extended follow-up development cohort compared to individuals in our extended follow-up original validation cohort (data from survey years 1997-2000 with extended follow-up through 2006) and plotted calibration curves.
The NHIS uses a complex sampling design involving stratification, clustering, and multistage sampling. Therefore, we used SAS-callable SUDAAN software (version 9.0) for all analyses. Results from all analyses are weighted to reflect US population estimates and to adjust for non-response and mortality non-linkage; we present sample sizes (n) whenever possible. Currently, SUDAAN software does not have the capability to compute a c-statistic from a Cox model to assess model discrimination. Therefore, as we did in our initial report, we used a SAS macro designed by Harrell et al. to calculate a c-index for censored data to test the performance of the model in the new validation cohort.11
RESULTS
Population Characteristics
Respondents to the new validation cohort were similar to the original cohort respondents; however the new respondents were slightly more likely to be 85 years or older, report a diabetes diagnosis and/or a BMI of 25 or more (Table 1). Also, mortality was slightly lower in the new validation cohort (19% [18%-20%]) than in the original cohort after similar follow-up time (21% [20%-22%], p=0.01). At the time of our initial report, which included follow-up data through 2002, there were 4,061 deaths among respondents in the original cohort. Through 2006, there were a total of 8,387 deaths among respondents in the original cohort (4,326 more). There were 3,622 deaths through 2006 in the new validation cohort.
Table 1.
Demographic and Health Status Characteristics for Survey Years 1997-2004 of the National Health Interview Survey.*
| Demographics | Weighted % with Characteristic: Development and Original Validation Cohorts from 1997-2000 NHIS (n=24,139)* | Weighted % with Characteristic: New Validation Cohort from 2001-2004 NHIS (n=22,057) | P value | |
|---|---|---|---|---|
| Age, y | <0.0001 | |||
| 65-69 | 28.8 | 28.7 | ||
| 70-74 | 27.1 | 25.3 | ||
| 75-79 | 21.8 | 21.5 | ||
| 80-84 | 13.5 | 14.8 | ||
| 85+ | 8.8 | 9.7 | ||
| Male sex | 42.4 | 42.7 | 0.58 | |
| Smoking Status | 0.0001 | |||
| Never | 49.4 | 50.4 | ||
| Former | 39.7 | 40.2 | ||
| Current | 10.9 | 9.5 | ||
| Body Mass Index 25+ kg/m2 | 56.1 | 59.8 | <0.0001 | |
| Comorbid Conditions | Cancer | 13.9 | 14.8 | 0.02 |
| Diabetes mellitus | 15.8 | 18.4 | <.0001 | |
| COPD† | 10.2 | 9.9 | .30 | |
| Overnight hospitalizations in past year | 0.003 | |||
| None | 82.2 | 81.3 | ||
| One | 12.5 | 12.6 | ||
| Two or more | 5.2 | 6.1 | ||
| Perceived health | 0.55 | |||
| Excellent/very good | 39.9 | 39.5 | ||
| Good | 34.4 | 35.0 | ||
| Fair/poor | 25.7 | 25.5 | ||
| Functional measures | Dependent in at least one IADL† | 11.6 | 11.7 | 0.73 |
| Difficulty walking several blocks | 41.0 | 43.2 | 0.001 | |
Proportions have changed slightly from our initial report since mortality information was available for more participants.
Abbreviations: COPD-Chronic Obstructive Pulmonary Disease; IADL-Instrumental Activity of Daily Living
Validation of 5-year mortality using the new validation cohort enrolled in 2001-2004
When we applied our mortality index to the new validation cohort, we found excellent calibration with our development and original validation cohorts (Figure 1/Table 2). The risk of 5-year mortality was similar for each quintile and for finer gradations of risk scores for both the new validation cohort and the development and original validation cohorts. The risk of 5-year mortality was 4% for the lowest risk quintiles for both the new validation cohort and the original validation cohort. The risk of 5-year mortality for the highest risk quintiles was 51% for the new validation cohort and 49% for the original validation cohort. Risk of 5-year mortality was also similar between the new validation cohort and the original validation cohort for the intermediate risk quintiles.
Figure 1.

Calibration of the 5-Year Mortality Index
Table 2.
Validation of the Index: 5- year Mortality in the Development, Original Validation, and the Prospective Validation Cohorts by Risk Group.*
| Development Cohort | Original Validation Cohort | New Validation Cohort | ||||
|---|---|---|---|---|---|---|
| n (15,389) | Mortality 5-year % (95% confidence interval) | N (7,726) | Mortality 5-year % (95% confidence interval) | n (20,974) | Mortality 5-year % (95% confidence interval) | |
| Quintile of Risk | ||||||
| 1 | 3,126 | 5 (4-6) | 1,513 | 4 (3-6) | 4,127 | 4 (3-5) |
| 2 | 2,609 | 8 (7-9) | 1,295 | 9(7-10) | 3,287 | 7 (6-8) |
| 3 | 3,659 | 14 (13-16) | 1,860 | 14 (13-16) | 4,991 | 12 (11-13) |
| 4 | 2,863 | 27 (25-29) | 1,486 | 29 (27-32) | 4,012 | 25 (23-27) |
| 5 | 3,132 | 50 (48-52) | 1,572 | 49 (46-52) | 4,557 | 51 (49-53) |
| Point Score | ||||||
| 0-1 | 591 | 3 (2-5) | 302 | 5 (3-8) | 838 | 2 (1-3) |
| 2-3 | 1,441 | 5 (4-7) | 706 | 3 (2-5) | 1,876 | 4 (3-5) |
| 4-5 | 2,411 | 6 (6-8) | 1,105 | 7 (5-9) | 3,064 | 6 (5-7) |
| 6-7 | 2,556 | 10 (9-12) | 1,374 | 11 (9-12) | 3,433 | 9 (7-10) |
| 8-9 | 2,393 | 15 (14-17) | 1,181 | 16 (14-18) | 3,194 | 13 (12-15) |
| 10-11 | 2,007 | 25 (23-28) | 1,019 | 26 (23-29) | 2,825 | 23 (20-25) |
| 12-13 | 1,611 | 34 (32-36) | 808 | 35 (32-39) | 2,243 | 35 (32-38) |
| 14-15 | 1,128 | 45 (42-48) | 589 | 45 (40-50) | 1,601 | 43 (39-47) |
| 16-17 | 699 | 56 (52-60) | 353 | 56 (50-61) | 1,022 | 59 (54-63) |
| 18+ | 550 | 71 (67-75) | 289 | 65 (59-71) | 878 | 69 (63-73) |
In these analyses we only included individuals with complete data for all factors of interest.
Data from the new validation cohort continues to demonstrate that the model performs well and has excellent discrimination. Adults with the lowest risk scores (0-1) had only a 2% risk of 5-year mortality while those with the highest risk scores (18+) had a 69% risk of 5-year mortality. In the original validation cohort, those with the lowest risk scores (0-1) had a 5% risk of 5-year mortality while those with the highest risk scores (18+) had a 65% risk of 5-year mortality. Similar to the development and original validation cohorts, the c-index of the model applied to the new validation cohort was 0.75, indicating good discrimination. The discrimination of the model improves at risk scores above 7.
Extended follow-up of original development and validation cohorts (9-year mortality)
The index further demonstrates excellent calibration and discrimination in predicting 9-year mortality (Table 3/Figure 2). In the extended follow-up original validation cohort, individuals with the lowest risk (0-1) have only a 7% risk of mortality in 9 years while those who score 10-11 points have a 52% risk of 9-year mortality, and those who score 18 or greater have a 92% risk of 9-year mortality. The Figure in Appendix B demonstrates the Kaplan Meier curves for the quintiles of risk for 9-year mortality.
Table 3.
Probability of 9- year Mortality in the Development and Original Validation Cohorts Using the Index.
| Development Cohort – Extended Follow-up | Original Validation Cohort-Extended Follow-up | |||
|---|---|---|---|---|
| n=15,389 | Mortality 9-year % (95% confidence interval) | N=7,726 | Mortality 9-year % (95% confidence interval) | |
| Quintile of Risk | ||||
| 1 | 3,126 | 13 (11-14) | 1,513 | 10 (8-12) |
| 2 | 2,609 | 20 (18-22) | 1,295 | 21 (18-24) |
| 3 | 3,659 | 32(30-34) | 1,860 | 32 (29-35) |
| 4 | 2,863 | 54(51-57) | 1,486 | 53 (50-57) |
| 5 | 3,132 | 75 (73-77) | 1,572 | 77 (73-80) |
| Point Score | ||||
| 0-1 | 591 | 11 (8-16) | 302 | 7 (4-13) |
| 2-3 | 1,441 | 12 (10-14) | 706 | 8 (6-11) |
| 4-5 | 2,411 | 17 (15-19) | 1,105 | 16 (13-19) |
| 6-7 | 2,556 | 25 (22-27) | 1,374 | 26 (23-29) |
| 8-9 | 2,393 | 35 (32-38) | 1,181 | 33 (29-37) |
| 10-11 | 2,007 | 53 (50-57) | 1,019 | 52 (48-56) |
| 12-13 | 1,611 | 60 (57-63) | 808 | 58 (53-62) |
| 14-15 | 1,128 | 71 (67-74) | 589 | 75 (69-80) |
| 16-17 | 699 | 82 (77-86) | 353 | 83 (76-88) |
| 18+ | 550 | 89 (84-92) | 289 | 92 (86-96) |
*In these analyses we only included individuals with complete data for all factors of interest.
Figure 2.

Calibration of the Development and Original Validation Cohort with 9-year Mortality
Appendix B.

Probability of 9-year Survival by Quintiles of Risk.
DISCUSSION
We validated our 11-item mortality index in an independent sample of community-dwelling US adults aged 65 and older. Our index demonstrates excellent calibration as shown by similar mortality rates in the new validation cohort, as compared to the development and original validation cohorts. Our index also demonstrates strong discrimination, as shown by increasing risk of 5 and 9-year mortality by point score. This study further validates the use of our index in predicting life expectancy when using NHIS or related datasets, such as MEPS, and strengthens the likelihood that the index will accurately predict mortality among patients, although the index still needs to be validated in a clinical setting. The ability to predict patient life expectancy is important for providing high quality care to older adults.
Ideally older adults who have the life expectancy to potentially benefit from medical interventions would receive these services while those with limited life expectancies would be spared needless interventions. However, physicians find predicting patient life expectancy difficult and may feel uncomfortable discussing life expectancy with their patients.12 Conversely, patients may prefer that their physicians discuss their life expectancy when counseling them on medical interventions.13 Our mortality index can be used to help physicians and older patients with their medical decision-making and it can be used by researchers studying the use of clinical services by patient life expectancy.
It is particularly important to note how well the index performed in predicting 9-year mortality. Although the ability to predict 5-year mortality is important for deciding on many clinical interventions such as mammography screening or determining goals for glycemic control among older persons with diabetes,1,3,14 the ability to identify individuals with nearly 10-years life expectancy may even be more helpful in other situations. For example, most experts agree that older men need at least 10 years life expectancy to potentially benefit from prostate cancer screening if there is a benefit.2 Similarly, older adults need close to 10 years life expectancy to potentially benefit from colon cancer screening.1 Moreover, it is thought than older woman need at least five years but potentially 15 years life expectancy to potentially benefit from radiation therapy after breast conserving surgery in early stage breast cancer.15 In addition, estimating 10-year life expectancy may be important to cardiologists when deciding whether to use a bioprosthesis or a mechanical valve in aortic valve replacement among older adults.16 To date, this is the only validated population-based mortality index that has shown the ability to predict both 5-year and 9-year mortality.
As an example of when our index may be useful, consider a 75 year old male in fair health, with a history of diabetes, at least one IADL dependency, and difficulty walking a quarter of a mile. Using our index, his risk score equals 15. Based on our data this man has a 42% chance of mortality in 5 years and a 75% chance of mortality in 9 years. Given these estimates, it would be reasonable to aim for less intense glycemic goals in this patient to avoid complications of hypoglycemia and it would be reasonable for this patient to forgo colon and prostate cancer screening.1-3 However, a 75 year old male in excellent health, who never smoked, and without any functional limitations would have a risk score of 6 and only have an 8% chance of 5-year mortality and a 26% chance of 9 year mortality. It may be reasonable to discuss colon cancer screening and statins for primary prevention with this patient.1,17 Having a better understanding of patient life expectancy beyond patient age may help clinicians decide where best to focus care of individual patients.
We did find a slight decline in 5-year mortality from years 1997-2000 to years 2001-2004 which may reflect temporal trends towards increased longevity, especially among the oldest adults.18 Despite an overall decline in mortality, our index was still useful in defining which older adults were at greater risk of mortality in 5 to 9 years, with those scoring 18 or more points having a 69% risk of 5-year mortality and a 92% risk of 9-year mortality.
The index does have several limitations. As we noted in our initial report, since the index was developed among community-dwelling adults who can provide self-report, it cannot be generalized for nursing home residents or those with dementia.6 In this study, we included respondents whose answers were given by proxy, and found the model performed as well as in the original development and validation cohorts. This finding has important implications in geriatrics because family members often accompany patients to appointments and may help patients complete survey questions.19,20 Although we tested the index in a new cohort, we still used NHIS data, which is a carefully designed survey that has employed the same general sampling and collection procedures since 1997. Ideally, the index will be validated in a clinical setting or even in a new survey setting using different procedures. It would also be important to validate the index in populations outside the US.
We found that the index demonstrated less discrimination at lower point scores since there is little increase in 5-year mortality among adults who score 0-7 points. However, this should not affect the usefulness of the index since older adults who have less than a 10% chance of mortality in 5-years or about a 25% chance or less chance of mortality in 9 years are likely appropriate candidates for most medical interventions. The discrimination of the index at lower risk scores improves when the index is used to predict 9-year mortality rather than 5-year mortality. Furthermore, it may be reasonable based on our findings to group adults who score from 0-7 at low risk of mortality in 5-9 years, those who score 8-13 at medium risk of mortality in 5-9 years, and those who score 14 or more at high risk of mortality in 5-9 years.
It may seem initially surprising that older adults with BMIs of 25 or less have greater mortality than adults with higher BMIs. However, many studies have also found no association between mortality and obesity among the oldest adults.21;22 Even in further review of our data, we were unable to detect an upper BMI cutoff statistically associated with an increased risk of mortality among adults aged 65 and older. It is possible that some fat mass may serve as nutritional reserve for older adults. It is also possible that adults who were susceptible to the adverse effects of obesity succumbed before old age or that adults who had been obese were losing weight due to severe illness. In addition, the effects of obesity on mortality may be mediated through other factors included in our index.21-23
In summary, we have further demonstrated the utility of an index to predict five and nine year mortality among community dwelling US adults aged 65 and older. The predictive abilities of the index remained accurate even when testing the index on a completely new population of older adults. This index may be useful to researchers, clinicians, and patients who would like to understand the impact of life expectancy when deciding on recommending or accepting medical interventions.
ACKNOWLEDGMENTS
Sponsor's Role:
Dr. Schonberg's time was supported by a Paul B. Beeson Career Development Award in Aging supported by the National Institute on Aging K23 [K23AG028584] and The John A. Hartford Foundation, The Atlantic Philanthropies, The Starr Foundation, and the American Federation for Aging Research. The sponsors played no role in the design, methods, subject recruitment, data collection, analysis and preparation of paper.
Conflict of Interest: none disclosed.
| Elements of Financial/Personal Conflicts | Schonberg MA | Davis RB | McCarthy EP | Marcantonio ER | ||||
|---|---|---|---|---|---|---|---|---|
| Yes | No | Yes | No | Yes | No | Yes | No | |
| Employment or Affiliation | X | x | x | x | ||||
| Grants/Funds | X | x | x | x | ||||
| Honoraria | X | x | x | x | ||||
| Speaker Forum | X | x | x | x | ||||
| Consultant | X | x | x | x | ||||
| Stocks | X | x | x | x | ||||
| Royalties | X | x | x | x | ||||
| Expert Testimony | X | x | x | x | ||||
| Board Member | X | x | x | x | ||||
| Patents | X | x | x | x | ||||
| Personal Relationship | X | x | x | x | ||||
REFERENCES
- 1.Walter LC, Covinsky KE. Cancer screening in elderly patients: a framework for individualized decision making. JAMA. 2001;285(21):2750–2756. doi: 10.1001/jama.285.21.2750. [DOI] [PubMed] [Google Scholar]
- 2.Wolf AM, Wender RC, Etzioni RB, et al. American Cancer Society guideline for the early detection of prostate cancer: update 2010. CA Cancer J Clin. 60(2):70–98. doi: 10.3322/caac.20066. [DOI] [PubMed] [Google Scholar]
- 3.Huang ES, Zhang Q, Gandra N, Chin MH, Meltzer DO. The effect of comorbid illness and functional status on the expected benefits of intensive glucose control in older patients with type 2 diabetes: a decision analysis. Ann Intern Med. 2008;149(1):11–19. doi: 10.7326/0003-4819-149-1-200807010-00005. [DOI] [PMC free article] [PubMed] [Google Scholar]
- 4.Mohan IV, Harris PL. When not to operate for abdominal aortic aneurysms. Semin Interv Cardiol. 2000;5(1):15–9. [PubMed] [Google Scholar]
- 5.Karuppiah SV, Banaszkiewicz PA, Ledingham WM. The mortality, morbidity and cost benefits of elective total knee arthroplasty in the nonagenarian population. Int Orthop. 2008;32(3):339–43. doi: 10.1007/s00264-007-0324-y. [DOI] [PMC free article] [PubMed] [Google Scholar]
- 6.Schonberg MA, Davis RB, McCarthy EP, Marcantonio ER. Index to Predict 5-Year Mortality of Community-Dwelling Adults Aged 65 and Older Using Data from the National Health Interview Survey. J Gen Intern Med. 2009;24(10):1115–1122. doi: 10.1007/s11606-009-1073-y. [DOI] [PMC free article] [PubMed] [Google Scholar]
- 7.Justice AC, Covinsky KE, Berlin JA. Assessing the generalizability of prognostic information. Ann Intern Med. 1999;130(6):515–524. doi: 10.7326/0003-4819-130-6-199903160-00016. [DOI] [PubMed] [Google Scholar]
- 8.Laupacis A, Sekar N, Stiell IG. Clinical prediction rules: A review and suggested modifications of methodological standards. JAMA. 1997;277(6):488–494. [PubMed] [Google Scholar]
- 9.National Health Interview Survey [February 14, 2011];National Center for Health Statistics. [Public use data file and documentation]. Available at: http://www.cdc.gov/nchs/data_access/data_linkage/mortality/nhis_linkage_public_use.htm.
- 10.Horm J. Multiple causes of death for the national health interview survey.. Record linkage techniques—Proceedings of an International Workshop and Exposition, 1997; National Research Council, Washington D.C.. 1997. [Google Scholar]
- 11.Harrell FE, Jr, Lee KL, Mark DB. Multivariable prognostic models: issues in developing models, evaluating assumptions and adequacy, and measuring and reducing errors. Stat Med. 1996;15(4):361–387. doi: 10.1002/(SICI)1097-0258(19960229)15:4<361::AID-SIM168>3.0.CO;2-4. [DOI] [PubMed] [Google Scholar]
- 12.Schonberg MA, Ramanan RA, McCarthy EP, Marcantonio ER. Decision making and counseling around mammography screening for women aged 80 or older. J Gen Intern Med. 2006;21(9):979–985. doi: 10.1111/j.1525-1497.2006.00487.x. [DOI] [PMC free article] [PubMed] [Google Scholar]
- 13.Lewis CL, Kistler CE, Amick HR, et al. Older adults’ attitudes about continuing cancer screening later in life: a pilot study interviewing residents of two continuing care communities. BMC Geriatr. 2006;6:10. doi: 10.1186/1471-2318-6-10. [DOI] [PMC free article] [PubMed] [Google Scholar]
- 14.Brown AF, Mangione CM, Saliba D, Sarkisian CA. Guidelines for improving the care of the older person with diabetes mellitus. J Am Geriatr Soc. 2003;51(5 Suppl Guidelines):S265–80. doi: 10.1046/j.1532-5415.51.5s.1.x. [DOI] [PubMed] [Google Scholar]
- 15.Clarke M, Collins R, Darby S, et al. Effects of radiotherapy and of differences in the extent of surgery for early breast cancer on local recurrence and 15-year survival: an overview of the randomised trials. Lancet. 2005;366(9503):2087–106. doi: 10.1016/S0140-6736(05)67887-7. [DOI] [PubMed] [Google Scholar]
- 16.Logeais Y, Langanay T, Corbineau H, Roussin R, Rioux C, Leguerrier A. Aortic valve replacement in the elderly: bioprosthesis or mechanical valve? Ann Thorac Surg. 1998;66(6 Suppl):S77–81. doi: 10.1016/s0003-4975(98)01112-6. [DOI] [PubMed] [Google Scholar]
- 17.Glynn RJ, Koenig W, Nordestgaard BG, Shepherd J, Ridker PM. Rosuvastatin for primary prevention in older persons with elevated C-reactive protein and low to average low-density lipoprotein cholesterol levels: exploratory analysis of a randomized trial. Ann Intern Med. 152(8):488–96. W174. doi: 10.1059/0003-4819-152-8-201004200-00005. [DOI] [PMC free article] [PubMed] [Google Scholar]
- 18.Rau R, Soroko E, Jasilionis D, Vaupel JW. Continued reductions in mortality at advanced ages. Population Dev. Rev. 2008;34:747–768. [Google Scholar]
- 19.Clayman ML, Roter D, Wissow LS, Bandeen-Roche K. Autonomy-related behaviors of patient companions and their effect on decision-making activity in geriatric primary care visits. Soc Sci Med. 2005;60(7):1583–91. doi: 10.1016/j.socscimed.2004.08.004. [DOI] [PubMed] [Google Scholar]
- 20.Dalton JM. Development and testing of the theory of collaborative decision-making in nursing practice for triads. J Adv Nurs. 2003;41(1):22–33. doi: 10.1046/j.1365-2648.2003.02502.x. [DOI] [PubMed] [Google Scholar]
- 21.Janssen I, Mark AE. Elevated body mass index and mortality risk in the elderly. Obes Rev. 2007;8(1):41–59. doi: 10.1111/j.1467-789X.2006.00248.x. [DOI] [PubMed] [Google Scholar]
- 22.Lantz PM, Golberstein E, House JS, et al. Socioeconomic and behavioral risk factors for mortality in a national 19-year prospective study of US adults. Soc Sci Med. 2010;70:1558–1566. doi: 10.1016/j.socscimed.2010.02.003. [DOI] [PMC free article] [PubMed] [Google Scholar]
- 23.Alley DE, Metter J, Griswold ME, et al. Changes in weight at the end of life: Characterizing weight loss by time to death in a cohort study of older men. Am J Epidemiol. 2010;172:558–565. doi: 10.1093/aje/kwq168. [DOI] [PMC free article] [PubMed] [Google Scholar]