

Abstract
Alterations in microdamage morphology and accumulation are typically attributed to impaired remodeling, but may also result from changes in microdamage initiation and propagation. Such alterations are relevant for cancellous bone with high metabolic activity and numerous bone quality changes. This study investigates the role of trabecular microarchitecture on morphology and accumulation of microdamage in human cancellous bone. Trabecular bone cores from donors of varying ages and bone volume fraction (BV/TV) were separated into high and low BV/TV groups. Samples were subjected to no load or uniaxial compression to 0.6% (pre-yield) or 1.1% (post-yield) strain. Microdamage was stained with lead uranyl acetate and specimens were imaged via microcomputed tomography to quantify microdamage and determine its morphology in three-dimensions (3D). Donors with high BV/TV had greater post yield strain and were tougher than low BV/TV donors. High BV/TV bone had less microdamage than low BV/TV bone under post- but not pre-yield loading. Microdamage under both loading conditions showed significant correlations with microarchitecture and BV/TV, but the key predictor was structure model index (SMI). As SMI increased (more trabecular rods), microdamage morphology became crack-like. Thus, low BV/TV and increased SMI have strong influences on microdamage accumulation in bone through altered initiation.
INTRODUCTION
Microdamage accumulation and its morphology are considered risk factors for osteoporotic fractures [1–4]. Previous studies emphasized reduced turnover resulting from defective bone remodeling as the key contributor to microdamage accumulation [1,5,6]. However, changes in microdamage accumulation and morphology may also result from osteoporotic bone’s enhanced propensity to form microdamage [1,5]. Accumulation of microdamage due to altered initiation may help to understand the fragility of cancellous bone that is metabolically active and exposed to severe loading [7].
For example, the human knee joint sustains loading equal to 2 to 3 times the body weight during everyday activities including walking and running [8,9]. Patients of varying ages facing non-vertebral fractures (e.g. tibial fractures) display overlaps in bone mineral density (BMD) with non-fracture patients, and based on BMD, the majority of them are not even diagnosed as fracture-prone [10–12]. Overlaps in BMD between fracture and non-fracture patients suggest that loading interacts with factors other than bone quantity to cause fracture. These factors may include changes in bone quality, increased tendency to fall, and impaired reflexes [13–14].
Alterations in 3D microarchitecture including changes in shape and connectivity of trabeculae can interact with applied loading and cause microdamage accumulation reported in aging bone [1,3,4,15]. Current imaging modalities for microdamage characterization are limited to 2D histological sectioning, making it difficult to examine the influence of microstructure on microdamage. Only a single study has shown the correlation between microarchitecture and in vivo microdamage quantities using 2D histology [1]. However, from this study the contribution of defective remodeling and applied loading to in vivo microdamage cannot be differentiated because in vivo microdamage results from both processes. Here, we apply controlled in vitro loading and use a non-invasive microcomputed tomography (microCT) technique to measure microdamage quantity and characterize its morphology [16] as linear microcracks or diffuse damage. These two microdamage morphologies are known to have differing effects on bone fragility [17–19]. The in vitro loading protocol also gives us the ability to isolate and measure microdamage at specific stages of fracture including initiation and propagation.
Thus, the goal of this study was to investigate the role of microarchitecture on morphology and accumulation of microdamage induced due to applied loading in trabecular bone. Cancellous bone cores from adult human tibial plateaus of varying age, bone volume fraction (BV/TV), and BMD, were subjected to compressive loading to specific strain values. Cores were stained with lead uranyl acetate and imaged via microCT to study mechanically induced microdamage with respect to 3D microstructure. We hypothesized that changes in trabecular microarchitecture coupled with altered BV/TV would influence the morphology and quantity of induced microdamage.
METHODS
Specimen Preparation
3 cylindrical cancellous bone cores (7.5 mm diameter, 10.5 mm length) from tibial plateaus of 26 human donors (age 18 to 97) were obtained using a drill press and low-speed diamond blade saw (model 11-1180; Buehler, Lake Bluff, IL). Donors were confirmed free of human immunodeficiency virus, Hepatitis B, and bone metabolic diseases (National Disease Research Exchange and International Institute for the Advancement of Medicine). Specimens were frozen in saline-soaked gauze at −80°C when not in use. Cores were scanned by microCT (model vivaCT 40; Scanco Medical AG, Switzerland) at 17.5 μm voxel resolution. Optimal threshold to detect bone was determined empirically from 2D evaluations of multiple specimens. Consistent with previous work [16], volumetric BMD, BV/TV, connectivity density (Conn.D), structure model index (SMI, indicator of the relative amount of plate- or rod-like trabeculae in bone), trabecular number (Tb.N), trabecular thickness (Tb.Th), and trabecular separation (Tb.Sp) were computed on a central 8 mm3 cubic volume of each core to avoid boundary artifacts.
Mechanical Testing
1 core per donor served as a control, and 2 cores underwent uniaxial unconfined compression tests [20,21] conducted to 0.6% or 1.1% apparent-level strain using a servo-hydraulic testing system (model 858; MTS, Eden Prairie, MN) with TestStar II software. 0.6% and 1.1% strains provide pre- and post-yield testing, respectively, since the yield point of human cancellous bone is ~0.8% apparent-level strain [16,22]. Loading to pre- and post-yield levels isolates events related to microdamage initiation and propagation, respectively [20,21]. Tests were performed under constant flow of saline at 37°C. Each specimen was glued using cyanoacrylate to brass end-caps and loaded at 0.05 mm/s. An extensometer (model 634.31F-24; MTS, Eden Prairie, MN) was placed centrally along the specimen length with knife edges attached to the end-caps. The output of the extensometer was used as a measure of the deformation in bone cores to calculate strain. This method is suitable for small cancellous bone cores and yields strain values that are similar to other methods [20,21,23]. Collected load data was converted into stress based on the overall specimen cross section area. Stress and strain data were used for calculation of several parameters. For both loading states, elastic modulus (slope of best-fit line between 0.1% and 0.3% strain [9]) was calculated. For post-yield loading, the following variables were determined: yield point (using the 0.2% offset method [20]), ultimate point (point of maximum load), post-yield strain (difference between ultimate and yield strain), post-yield strain energy (area under the curve between yield and ultimate point), and toughness (a measurement of bone’s ability to resist initiation and propagation of microcracks, calculated as area under the stress-strain curve) using Excel (version 11; Microsoft, Redmond, WA) and MATLAB (version 7.9; MathWorks, Natick, MA).
Microdamage Analysis
Cores were stained for microdamage with lead uranyl acetate. The staining procedure, developed from a previous protocol [24], involves a 14 day submersion in an equal mixture of 20% lead acetate in 70% acetone and 8% uranyl acetate in 70% acetone, followed by 7 days in 1% ammonium sulfide in acetone [16,24]. The central cubic region of stained specimens was scanned by microCT at 17.5 μm resolution. Optimal threshold to detect microdamage was determined empirically based on 2D evaluations of multiple specimens. Ratios of damaged volume to bone volume (measure of microdamage quantity) and damaged surface area to damaged bone volume (measure of microdamage morphology where high values refer to “crack-like” and low values refer to “diffuse-like” damage morphology; see Appendix for additional details) were calculated from microCT data at 3 levels of interest. The first level (global) included the entire central cubic region and is illustrative of average trabecular morphometry and BV/TV of the whole specimen. The second level (minimum BV/TV region) was determined by dividing the central cubic region (2 mm × 2 mm × 2 mm) along the specimen length into 4 equally sized volumes (0.5 mm × 2 mm × 2 mm). Of these 4, the volume with the smallest BV/TV was selected to represent the minimum BV/TV values per core. This method of selecting minimum BV/TV is based on a previous study [25] that demonstrated an improved prediction of cancellous bone fragility by minimum BV/TV than global BV/TV. For trabecular level analysis (third level), microdamage morphology, at the level of individual trabeculae, was characterized for a subset of specimens from high and low BV/TV groups that were subjected to pre- or post-yield loading.
Statistical Analyses
The stain did not permeate completely in 3 post-yield tested cores, and these were removed from analyses. The median BV/TV value (0.1230) in the post-yield group was selected as the threshold between high and low BV/TV. Kolmogorov-Smirnov normality tests on the dataset indicated that several variables of interest were not normally distributed (S-Figure 1). Thus, non-parametric Mann Whitney Rank Sum tests were run to determine differences between groups. Since high and low BV/TV groups demonstrated a significant difference in BMD, high and low BV/TV groups also refer to high and low BMD groups, respectively. Spearman correlation tests were run between microarchitecture and microdamage measurements made at all 3 levels of interest. Forward stepwise regression tests were performed to determine the most influential variable predicting microdamage quantity and morphology. All statistical analyses were performed using SigmaStat (version 2.03; SPSS, Chicago, IL).
RESULTS
There was 22.4 times more and 9.7 times more microdamage in post-yield (0.0590±0.0609) and pre-yield (0.0255±0.0252) groups than in non-loaded controls (0.0026±0.0038), respectively, indicating that loading induced microdamage (p<0.001). There was no significant difference (p<0.001) between total microdamage quantity and total quantity minus the amount measured in controls for both groups. Thus, the quantity measured in controls was not subtracted from post- or pre-yield microdamage quantities in this study. Additionally, donor age showed no correlation with microdamage (Figure 1).
Figure 1.
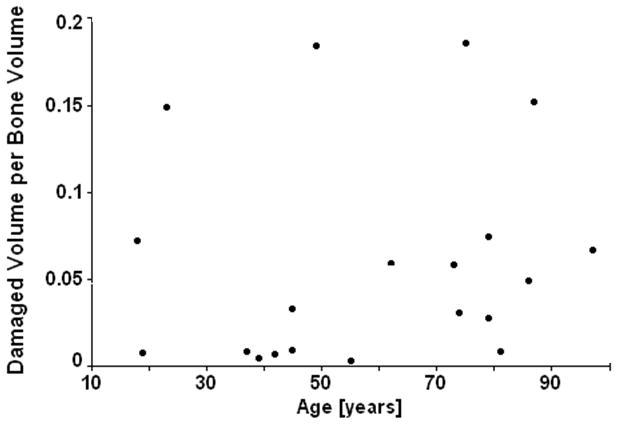
There is no age-related affect on microdamage accumulation.
BV/TV was correlated with several mechanical parameters (Table 1). There was greater ultimate strain (p<0.01), post yield strain (p=0.07), post yield strain energy (p=0.09), and toughness (p=0.07) in the high BV/TV group compared to low BV/TV group under post-yield loading. The last 3 parameters were considered marginally significant because the difference between the means was greater than twice the standard error of the mean. BMD was greater in high BV/TV donors than in low BV/TV donors (p<0.05). BMD was positively correlated with BV/TV (p<0.05), but was not correlated with mechanical properties or other variables. There was no difference in elastic modulus measured under pre-yield loading between high and low BV/TV groups (p>0.5). There was 2.3 times more microdamage formed under post-yield than under pre-yield loading (p=0.06). Under post-yield loading, low BV/TV specimens had 85.4% more microdamage than high BV/TV specimens (p<0.05). This difference in the microdamage amount between the two groups increased to 120% when measured in the region of minimum BV/TV (p<0.01). There was no difference in microdamage quantity at the global level or in the region of minimum BV/TV between the high and low BV/TV groups under pre-yield loading.
Table 1.
Spearman correlation coefficients (r) between BV/TV and compressive mechanical properties in human tibial cancellous bone subjected to post-yield loading. P-values are shown below correlation coefficients in italics. NS = not significant
| r | |
|---|---|
| Elastic Modulus [N/mm2] | 0.538 0.07 |
| Yield Stress [N/mm2] | 0.636 <0.05 |
| Yield Strain | −0.063 NS |
| Ultimate Stress [N/mm2] | 0.664 <0.05 |
| Ultimate Strain | 0.081 NS |
| Post Yield Strain | 0.270 NS |
| Post Yield Strain Energy [mJ/mm3] | 0.531 0.07 |
| Toughness [mJ/mm3] | 0.629 <0.05 |
In the post-yield group, several microarchitectural properties were correlated with BV/TV and microdamage quantity both globally and in the region of minimum BV/TV (Table 2). Forward stepwise regression to predict microdamage quantity as a dependent variable using all microarchitectural properties and as donor age as independent variables returned only SMI as the predictor for microdamage quantity, globally (p<0.01) and in the region of minimum BV/TV (p<0.01, Figure 2A). There were no significant correlations under pre-yield loading.
Table 2.
Spearman correlation coefficients between microarchitectural variables and microdamage quantity measured (A) globally and (B) in the region of minimum BV/TV in human tibial cancellous bone in the post-yield group. P-values are shown below correlation coefficients in italics. NS = not significant
| BV/TV | Conn.D [1/mm3] | SMI | Tb.N [1/mm] | Tb.Th [mm] | Tb.Sp [mm] | |
|---|---|---|---|---|---|---|
| BV/TV | - | 0.63 <0.001 |
−0.71 <0.001 |
0.41 0.06 |
0.47 <0.05 |
−0.48 <0.05 |
| Conn.D [1/mm3] | - | −0.28 NS |
0.67 <0.001 |
−0.08 NS |
−0.65 <0.001 |
|
| SMI | - | −0.44 <0.05 |
−0.52 <0.01 |
0.48 <0.05 |
||
| Tb.N [1/mm] | - | 0.10 NS |
−0.95 <0.001 |
|||
| Tb.Th [mm] | - | −0.11 NS |
||||
| Microdamage (A) | −0.49 <0.05 |
−0.31 NS |
0.63 <0.05 |
−0.42 0.06 |
−0.26 NS |
0.45 <0.05 |
| Microdamage (B) | −0.58 <0.01 |
−0.54 <0.01 |
0.66 <0.01 |
0.21 NS |
−0.01 NS |
0.45 <0.05 |
Figure 2.

(A) Variation of damaged volume per bone volume as a function of SMI. (B) Variation of damaged surface area per damaged volume as a function of SMI.
At the trabecular level there was a positive correlation between SMI of individual trabeculae, calculated similarly as SMI of whole bone specimens, and surface-to-volume ratio of microdamage (representative of microdamage morphology) in the post- (p<0.05, Figure 2B) and pre-yield groups (p<0.01). Low surface-to-volume values represented diffuse damage and high values represented linear microcracks (see Appendix for additional details). The amount of microdamage present as linear microcracks in low BV/TV bone was negatively correlated with post yield strain energy (p=0.06) and toughness (p=0.09) while the amount of microdamage present as diffuse damage showed no such correlations.
DISCUSSION
Microdamage accumulation has been related to the reduced ability of bone to repair damage [1,6,26]. In the peripheral skeleton, high surface-to-volume ratio of cancellous bone and low surface-to-volume ratio of cortical bone paired with similar bone formation rates results in an overall higher metabolic activity and turnover rate in cancellous bone [27]. Consequently, unlike cortical bone, impaired removal of microdamage may not be a major factor of its accumulation in cancellous bone. Unlike in vivo studies where microdamage results from loading and impaired removal [1,28], our study included controlled in vitro loading, allowing us to measure load induced microdamage. In contrast to aging, we found that low BV/TV and changes in bone architecture predisposed cancellous bone to accumulate microdamage. Thus, in cancellous bone, low BV/TV and changes in bone microarchitecture may have a greater role in the accumulation of microdamage than impaired removal.
Consistent with literature showing low BV/TV as a predictor of fracture risk [29], we found low BV/TV bone was less able to resist fracture and formed more microdamage than high BV/TV bone. Accumulation of microdamage in low BV/TV cancellous bone may play a vital role in bone fragility. High turnover generates conditions for increased risk of trabecular buckling [30]; our results show that changes in microarchitectural properties associated with low BV/TV produces crack-like microdamage in trabecular rods, which are prone to buckling and bending [31]. Similar to previous data showing that linear microcracks are associated with fragile bones [17], we found their accumulation in low BV/TV bone is associated with reduced post yield strain energy and toughness. No such correlations were found for diffuse damage. Thus, linear microcrack initiation contributes to the structural weakness of low BV/TV bone while diffuse damage has no adverse effects.
Although more microdamage was found in low BV/TV bone, BV/TV was not the main contributor to its accumulation. Microarchitecture was more significant, where SMI was the most influential variable and explained 40% of the measured microdamage (Figure 3). SMI describes the relative amounts of rods and plates in a 3D structure, with high values indicating more rods than plates. SMI is more strongly correlated with BV/TV than with other variables, showing low BV/TV bone tends to have more rod-like trabeculae. Furthermore, we found that there were stronger relationships between microdamage and microarchitecture in the region of minimum BV/TV than at the global level. Trabecular network and BV/TV are not homogeneous across cancellous bone where the arrangement and spatial density of trabeculae vary within a specific anatomical location [32]. Also, bone failure occurs in the weakest subregion of trabecular bone, defined by the minimum BV/TV [25]. Similar to our findings, it was demonstrated that minimum BV/TV is more predictive of mechanical failure than apparent BV/TV or microstructure [25]. Consequently, our results suggest there may be a coupling between BV/TV and microarchitecture that explains increased propensity of bone with low BV/TV to accumulate microdamage. Also, while BMD was correlated with BV/TV, it had no relationship with microdamage, further illustrating the importance of bone quality over quantity.
Figure 3.
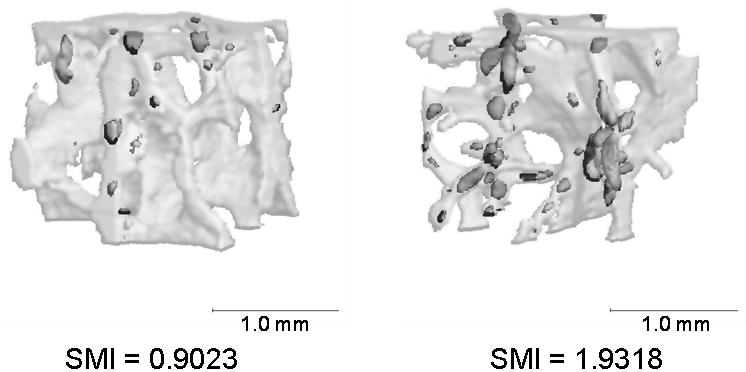
Representative images of bone with low and high SMI values. Bone with higher SMI accumulates more microdamage. Images shown are central volumetric cubes with stained regions represented by dark grey and the whole bone volume represented by light grey.
Changes in SMI also explain the formation of specific microdamage morphologies. We found that plate- and rod-like trabeculae form more diffuse- and more crack-like, microdamage, respectively. SMI explained 42% and 37% of the microdamage morphology in post- and pre-yield groups, respectively. Diffuse damage, seen here in trabecular plates, is known to be self limiting and, in cortical bone, allows bone to dissipate energy without fracturing [33,34]. In contrast, linear microcracks coalesce to cause fracture [34] and are more commonly seen in osteoporotic bone [35,36], which fractures due to failure of trabecular rods [31,32,34,37].
In contrast to post-yield loading, under pre-yield loading trabecular microarchitecture influenced microdamage morphology but had no affect on its accumulation. There were no differences in pre-yield microdamage initiation between high and low BV/TV groups. These results suggest that microarchitecture and BV/TV do not affect the initial onset of microdamage in bone. Other components of bone quality such as mineralization may be responsible for microdamage initiation [15]. However, once formed, microdamage propagates under post-yield loading, in which 3D structure plays a critical role and disproportionally affects low BV/TV bone [1,38,39].
Our results must be considered in light of several limitations. The lead uranyl acetate-based microCT technique may not be able to fully resolve a linear microcrack that is shorter than microCT resolution. However, pure linear microcracks are rarely found in bone because a microdamage zone develops around them during growth that allows lead uranyl acetate to permeate into a wider volume [24] and makes it possible to detect microdamage via microCT. Additionally, quantification of linear microcracks and diffuse damage is possible by using the surface-to-volume ratio of the microdamage where a high ratio represents linear microcracks and a low ratio represents diffuse damage [40] (see Appendix and S-Figure 2). Also, a central cubic region away from the edges of the cut cylindrical specimens was analyzed to avoid the measurement of microdamage produced due to sample preparation. Although small, our sample size was similar to other studies [1,25,39], and we selected donors of varying ages and BV/TV levels so that the results of our study would not be limited to a particular group.
Finally, it is possible that other factors including local mineralization level and the extent of collagen crosslinks influence microdamage formation independently of or in combination with microstructure. For example, work from our own group shows that non-enzymatic glycation of collagen in bone affects microdamage formation and morphology [40]. Non-enzymatic glycation level in bone is coupled to mineralization levels [41] and both these parameters may further interact and vary with BV/TV and SMI.
In conclusion, we found that microdamage accumulation in human tibial trabecular bone is associated with low BV/TV, a less dense trabecular network, and with rod-like trabeculae. The results indicate that loss of bone manifests its effect on microdamage via SMI, and that microarchitecture based bone quality parameters are important determinants of microdamage in cancellous bone. In vivo measurement of trabecular architecture via different imaging modalities can thus provide an estimate of in vivo microdamage accumulation and bone fragility.
Supplementary Material
Acknowledgments
We acknowledge the Imaging Core Facility at the Center for Biotechnology and Interdisciplinary Studies at Rensselaer Polytechnic Institute for use of the vivaCT 40 and Dr. Simon Tang for help with the staining protocol. Funding source: National Institutes of Health grant AG20618.
References
- 1.Arlot ME, Burt-Pichat B, Roux JP, Vashishth D, Bouxsein ML, Delmas PD. Microarchitecture influences microdamage accumulation in human vertebral trabecular bone. J Bone Miner Res. 2008;23:1613–8. doi: 10.1359/jbmr.080517. [DOI] [PMC free article] [PubMed] [Google Scholar]
- 2.Vashishth D. Hierarchy of Bone Microdamage at Multiple Length Scales. Int J Fatigue. 2007;29:1024–1033. doi: 10.1016/j.ijfatigue.2006.09.010. [DOI] [PMC free article] [PubMed] [Google Scholar]
- 3.Schaffler MB, Choi K, Milgrom C. Aging and matrix microdamage accumulation in human compact bone. Bone. 1995;17:521–25. doi: 10.1016/8756-3282(95)00370-3. [DOI] [PubMed] [Google Scholar]
- 4.Fazzalari NL, Forwood MR, Smith K, Manthey BA, Herreen P. Assessment of cancellous bone quality in severe osteoarthrosis: bone mineral density, mechanics, and microdamage. Bone. 1998;22:381–8. doi: 10.1016/s8756-3282(97)00298-6. [DOI] [PubMed] [Google Scholar]
- 5.Burr DB, Forwood MR, Fyhrie DP, Martin RB, Schaffler MB, Turner CH. Bone microdamage and skeletal fragility in osteoporotic and stress fractures. J Bone Miner Res. 1997;12:6–15. doi: 10.1359/jbmr.1997.12.1.6. [DOI] [PubMed] [Google Scholar]
- 6.Waldorff EI, Goldstein SA, McCreadie BR. Age-dependent microdamage removal following mechanically induced microdamage in trabecular bone in vivo. Bone. 2007;40:425–32. doi: 10.1016/j.bone.2006.08.011. [DOI] [PubMed] [Google Scholar]
- 7.Kimmel DB, Jee WS. A quantitative histologic study of bone turnover in young adult beagles. Anat Rec. 1982;203:31–45. doi: 10.1002/ar.1092030104. [DOI] [PubMed] [Google Scholar]
- 8.Mundermann A, Dyrby CO, D'Lima DD, Colwell CW, Jr, Andriacchi TP. In vivo knee loading characteristics during activities of daily living as measured by an instrumented total knee replacement. J Orthop Res. 2008;26:1167–72. doi: 10.1002/jor.20655. [DOI] [PubMed] [Google Scholar]
- 9.Kuster MS, Wood GA, Stachowiak GW, Gachter A. Joint load considerations in total knee replacement. J Bone Joint Surg Br. 1997;79:109–13. doi: 10.1302/0301-620x.79b1.6978. [DOI] [PubMed] [Google Scholar]
- 10.Cummings SR, Black DM, Nevitt MC, Browner WS, Cauley JA, Genant HK, Mascioli SR, Scott JC, Seeley DG, Steiger P, et al. Appendicular bone density and age predict hip fracture in women. The Study of Osteoporotic Fractures Research Group. Jama. 1990;263:665–8. [PubMed] [Google Scholar]
- 11.Sornay-Rendu E, Boutroy S, Munoz F, Delmas PD. Alterations of cortical and trabecular architecture are associated with fractures in postmenopausal women, partially independent of decreased BMD measured by DXA: the OFELY study. J Bone Miner Res. 2007;22:425–33. doi: 10.1359/jbmr.061206. [DOI] [PubMed] [Google Scholar]
- 12.Schuit SC, van der Klift M, Weel AE, de Laet CE, Burger H, Seeman E, Hofman A, Uitterlinden AG, van Leeuwen JP, Pols HA. Fracture incidence and association with bone mineral density in elderly men and women: the Rotterdam Study. Bone. 2004;34:195–202. doi: 10.1016/j.bone.2003.10.001. [DOI] [PubMed] [Google Scholar]
- 13.Schnitzler CM. Bone quality: a determinant for certain risk factors for bone fragility. Calcif Tissue Int. 1993;53(Suppl 1):S27–31. doi: 10.1007/BF01673398. [DOI] [PubMed] [Google Scholar]
- 14.Schultz AB, Ashton-Miller JA, Alexander NB. What leads to age and gender differences in balance maintenance and recovery? Muscle Nerve Suppl. 1997;5:S60–64. [PubMed] [Google Scholar]
- 15.Judex S, Boyd S, Qin YX, Miller L, Muller R, Rubin C. Combining high-resolution micro-computed tomography with material composition to define the quality of bone tissue. Curr Osteoporos Rep. 2003;1:11–9. doi: 10.1007/s11914-003-0003-x. [DOI] [PubMed] [Google Scholar]
- 16.Tang SY, Vashishth D. A non-invasive in vitro technique for the three-dimensional quantification of microdamage in trabecular bone. Bone. 2007;40:1259–64. doi: 10.1016/j.bone.2006.10.031. [DOI] [PMC free article] [PubMed] [Google Scholar]
- 17.Diab T, Condon KW, Burr DB, Vashishth D. Age-related change in the damage morphology of human cortical bone and its role in bone fragility. Bone. 2006;38:427–31. doi: 10.1016/j.bone.2005.09.002. [DOI] [PubMed] [Google Scholar]
- 18.Vashishth D, Koontz J, Qiu SJ, Lundin-Cannon D, Yeni YN, Schaffler MB, Fyhrie DP. In vivo diffuse damage in human vertebral trabecular bone. Bone. 2000;26:147–52. doi: 10.1016/s8756-3282(99)00253-7. [DOI] [PubMed] [Google Scholar]
- 19.Wenzel TE, Schaffler MB, Fyhrie DP. In vivo trabecular microcracks in human vertebral bone. Bone. 1996;19:89–95. doi: 10.1016/8756-3282(96)88871-5. [DOI] [PubMed] [Google Scholar]
- 20.Keaveny TM, Pinilla TP, Crawford RP, Kopperdahl DL, Lou A. Systematic and random errors in compression testing of trabecular bone. J Orthop Res. 1997;15:101–10. doi: 10.1002/jor.1100150115. [DOI] [PubMed] [Google Scholar]
- 21.Tang SY, Zeenath U, Vashishth D. Effects of non-enzymatic glycation on cancellous bone fragility. Bone. 2007;40:1144–51. doi: 10.1016/j.bone.2006.12.056. [DOI] [PMC free article] [PubMed] [Google Scholar]
- 22.Hernandez CJ, Gupta A, Keaveny TM. A biomechanical analysis of the effects of resorption cavities on cancellous bone strength. J Bone Miner Res. 2006;21:1248–55. doi: 10.1359/jbmr.060514. [DOI] [PMC free article] [PubMed] [Google Scholar]
- 23.Fyhrie DP, Vashishth D. Bone stiffness predicts strength similarly for human vertebral cancellous bone in compression and for cortical bone in tension. Bone. 2000;26:169–73. doi: 10.1016/s8756-3282(99)00246-x. [DOI] [PubMed] [Google Scholar]
- 24.Schaffler MB, Pitchford WC, Choi K, Riddle JM. Examination of compact bone microdamage using back-scattered electron microscopy. Bone. 1994;15:483–8. doi: 10.1016/8756-3282(94)90271-2. [DOI] [PubMed] [Google Scholar]
- 25.Nazarian A, Stauber M, Zurakowski D, Snyder BD, Muller R. The interaction of microstructure and volume fraction in predicting failure in cancellous bone. Bone. 2006;39:1196–202. doi: 10.1016/j.bone.2006.06.013. [DOI] [PubMed] [Google Scholar]
- 26.Nagaraja S, Lin AS, Guldberg RE. Age-related changes in trabecular bone microdamage initiation. Bone. 2007;40:973–80. doi: 10.1016/j.bone.2006.10.028. [DOI] [PubMed] [Google Scholar]
- 27.Parfitt AM. Misconceptions (2): turnover is always higher in cancellous than in cortical bone. Bone. 2002;30:807–9. doi: 10.1016/s8756-3282(02)00735-4. [DOI] [PubMed] [Google Scholar]
- 28.Burr DB, Turner CH, Naick P, Forwood MR, Ambrosius W, Hasan MS, Pidaparti R. Does microdamage accumulation affect the mechanical properties of bone? J Biomech. 1998;31:337–45. doi: 10.1016/s0021-9290(98)00016-5. [DOI] [PubMed] [Google Scholar]
- 29.Hui SL, Slemenda CW, Johnston CC., Jr Age and bone mass as predictors of fracture in a prospective study. J Clin Invest. 1988;81:1804–9. doi: 10.1172/JCI113523. [DOI] [PMC free article] [PubMed] [Google Scholar]
- 30.Parfitt AM. High bone turnover is intrinsically harmful: two paths to a similar conclusion. The Parfitt view. J Bone Miner Res. 2002;17:1558–9. doi: 10.1359/jbmr.2002.17.8.1558. author reply 1560. [DOI] [PubMed] [Google Scholar]
- 31.Muller R, Gerber SC, Hayes WC. Micro-compression: a novel technique for the nondestructive assessment of local bone failure. Technol Health Care. 1998;6:433–44. [PubMed] [Google Scholar]
- 32.Hildebrand T, Laib A, Muller R, Dequeker J, Ruegsegger P. Direct three-dimensional morphometric analysis of human cancellous bone: microstructural data from spine, femur, iliac crest, and calcaneus. J Bone Miner Res. 1999;14:1167–74. doi: 10.1359/jbmr.1999.14.7.1167. [DOI] [PubMed] [Google Scholar]
- 33.Diab T, Vashishth D. Morphology, localization and accumulation of in vivo microdamage in human cortical bone. Bone. 2007;40:612–8. doi: 10.1016/j.bone.2006.09.027. [DOI] [PMC free article] [PubMed] [Google Scholar]
- 34.Diab T, Vashishth D. Effects of damage morphology on cortical bone fragility. Bone. 2005;37:96–102. doi: 10.1016/j.bone.2005.03.014. [DOI] [PubMed] [Google Scholar]
- 35.Grote HJ, Amling M, Vogel M, Hahn M, Posl M, Delling G. Intervertebral variation in trabecular microarchitecture throughout the normal spine in relation to age. Bone. 1995;16:301–8. doi: 10.1016/8756-3282(94)00042-5. [DOI] [PubMed] [Google Scholar]
- 36.Ding M, Hvid I. Quantification of age-related changes in the structure model type and trabecular thickness of human tibial cancellous bone. Bone. 2000;26:291–5. doi: 10.1016/s8756-3282(99)00281-1. [DOI] [PubMed] [Google Scholar]
- 37.Sobelman OS, Gibeling JC, Stover SM, Hazelwood SJ, Yeh OC, Shelton DR, Martin RB. Do microcracks decrease or increase fatigue resistance in cortical bone? J Biomech. 2004;37:1295–303. doi: 10.1016/j.jbiomech.2003.12.034. [DOI] [PubMed] [Google Scholar]
- 38.Kosmopoulos V, Keller TS. Predicting trabecular bone microdamage initiation and accumulation using a non-linear perfect damage model. Med Eng Phys. 2008;30:725–32. doi: 10.1016/j.medengphy.2007.02.011. [DOI] [PubMed] [Google Scholar]
- 39.Nagaraja S, Couse TL, Guldberg RE. Trabecular bone microdamage and microstructural stresses under uniaxial compression. J Biomech. 2005;38:707–16. doi: 10.1016/j.jbiomech.2004.05.013. [DOI] [PubMed] [Google Scholar]
- 40.Tang SY, Vashishth D. Non-enzymatic glycation alters microdamage formation in human cancellous bone. Bone. 2009;9:9. doi: 10.1016/j.bone.2009.09.003. [DOI] [PMC free article] [PubMed] [Google Scholar]
- 41.Saito M, Marumo K. Collagen cross-links as a determinant of bone quality: a possible explanation for bone fragility in aging, osteoporosis, and diabetes mellitus. Osteopros Int. 2010;21:195–214. doi: 10.1007/s00198-009-1066-z. [DOI] [PubMed] [Google Scholar]
Associated Data
This section collects any data citations, data availability statements, or supplementary materials included in this article.