

Summary
The global regulator H‐NS of Escherichia coli controls genes related to stress response, biofilm formation and virulence by recognizing curved DNA and by silencing acquired genes. Here, we rewired H‐NS to control biofilm formation using protein engineering; H‐NS variant K57N was obtained that reduces biofilm formation 10‐fold compared with wild‐type H‐NS (wild‐type H‐NS increases biofilm formation whereas H‐NS K57N reduces it). Whole‐transcriptome analysis revealed that H‐NS K57N represses biofilm formation through its interaction with the nucleoid‐associated proteins Cnu and StpA and in the absence of these proteins, H‐NS K57N was unable to reduce biofilm formation. Significantly, H‐NS K57N enhanced the excision of defective prophage Rac while wild‐type H‐NS represses excision, and H‐NS controlled only Rac excision among the nine resident E. coli K‐12 prophages. Rac prophage excision not only led to the change in biofilm formation but also resulted in cell lysis through the expression of toxin HokD. Hence, the H‐NS regulatory system may be evolved through a single‐amino‐acid change in its N‐terminal oligomerization domain to control biofilm formation, prophage excision and apoptosis.
Introduction
Biofilm formation converts single cells into a complex heterogeneous community (Stewart and Franklin, 2008) attached to a surface and requires precise regulation of many genes (Karatan and Watnick, 2009). For example, genes related to stress response, quorum sensing (QS), motility, fimbriae, metabolism and transport are differentially regulated in Escherichia coli biofilms (Domka et al., 2007). It is important to control biofilm formation for engineering and medical applications such as reducing corrosion (Jayaraman et al., 1999), facilitating remediation (Wood, 2008) and reducing disease (Jayaraman and Wood, 2008).
The histone‐like nucleoid structuring protein H‐NS is widely conserved in Gram‐negative bacteria (Tendeng and Bertin, 2003) and is a global regulator that represses transcription (Dorman, 2004) by recognizing intrinsically curved DNA sequences (Rimsky, 2004). H‐NS is a small protein (137 amino acids) that is very abundant with more than 20 000 copies per cell (Rimsky, 2004). H‐NS regulates the transcription of many environmental responsive genes; for example, H‐NS represses the locus of enterocyte effacement (LEE) in enteropathogenic and enterohemorrhagic E. coli (EHEC) by binding LEE regulatory DNA (Mellies et al., 2007) and decreases resistance to high osmolarity and low pH in E. coli K‐12 (Hommais et al., 2001). H‐NS consists of an N‐terminal oligomerization domain (1–64 aa), a C‐terminal DNA‐binding domain (90–137 aa), and a flexible linker (65–89 aa) between both domains (Dorman, 2004). Interactions between the N‐terminus of H‐NS and other nucleoid‐associated proteins enhance their activities (Fang and Rimsky, 2008) as H‐NS increases repression by Hha of the haemolysin operon (Madrid et al., 2007) and protects StpA from Lon‐mediated proteolysis, which results in increased viability of stationary phase cells (Johansson and Uhlin, 1999). To date, little is known about H‐NS and its effect on biofilm formation; however, H‐NS regulates genes related to biofilm formation in a temperature‐dependent manner (White‐Ziegler and Davis, 2009), and the deletion of hns decreases biofilm formation (Belik et al., 2008).
H‐NS also silences genes acquired from lateral transfer in that H‐NS recognizes foreign DNA with AT‐rich content compared with the resident genome (Navarre et al., 2007). Prophage genes are obtained from lateral transfer and are common in most bacterial genomes contributing as much as 10–20% of a bacterium's genome (Casjens, 2003). Escherichia coli K‐12 has six cryptic prophage and three prophage‐like elements (http://www.ecogene.org/), which have lost some functions essential for lytic growth such as excision, tail formation and the production of phage particles, yet these loci retain some functional genes (Blattner et al., 1997). H‐NS completely or partially binds prophage and prophage‐like DNA in E. coli (Oshima et al., 2006), and the H‐NS–Hha complex tightly silences foreign DNA (Baños et al., 2009). However, the specific function of H‐NS for prophage gene regulation remains unclear.
Previously, we discovered that the global regulator Hha decreases biofilm formation and regulates the cryptic prophages CP4‐57 and DLP12 (García‐Contreras et al., 2008). Deletions of single genes of these prophages increased or decreased biofilm formation significantly, and Hha induced excision of CP4‐57 (Wang et al., 2009). Although Hha decreases biofilm formation (García‐Contreras et al., 2008) and H‐NS increases biofilm formation (Belik et al., 2008), Hha can be functionally equivalent to the N‐terminal domain of H‐NS as demonstrated by a chimeric Hha–H‐NS protein with Hha fused to the N‐terminus of H‐NS, which complements some of the hns‐induced phenotypes (Rodríguez et al., 2005). Thus, both Hha and H‐NS control prophage excision as well as influence biofilm formation.
Directed evolution is a useful tool to engineer proteins for industrial applications as well as to explore natural evolutionary processes (Otten and Quax, 2005). Since cell communication and biofilm formation are important for bacterial survival in microbial consortia (Jayaraman and Wood, 2008), bacteria may readily evolve global regulators for enhanced fitness. Illustrating this concept, we evolved the E. coli QS regulator SdiA to control biofilm formation via the extracellular signals indole and N‐acylhomoserine lactone (Lee et al., 2009).
The aims of this study were to investigate how the global regulator H‐NS influences biofilm formation and to determine whether H‐NS may be evolved to reduce biofilm formation as well as to derive new insights for how the structure of H‐NS impacts its function. We identified an H‐NS variant with a single‐amino‐acid substitution in the N‐terminal oligomerization domain that reduces biofilm formation as a result of its interaction with nucleoid‐associated proteins Cnu and StpA, that induces Rac prophage excision, and that induces toxin HokD which leads to cell lysis.
Results
Hha decreases biofilm formation and H‐NS increases biofilm formation
Previously, we reported that hha is highly induced in biofilm cells of E. coli (Ren et al., 2004a) and that Hha decreases biofilm formation by repressing the transcription of rare codon tRNAs and by repressing the transcription of fimbrial genes (García‐Contreras et al., 2008). Deletion of hns decreases biofilm formation in E. coli (Belik et al., 2008), although its deletion increases biofilm formation in Actinobacillus pleuropneumoniae (Dalai et al., 2009). Consistently, we found that producing Hha in BW25113 hha hns reduced biofilm formation after 24 h, while producing H‐NS in the same host increased biofilm formation. Producing both Hha and H‐NS resulted in an intermediate amount of biofilm formation (Fig. 1A).
Figure 1.
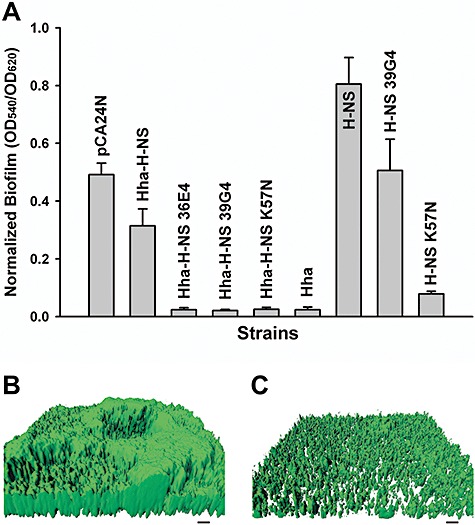
Biofilm formation with H‐NS variants. Normalized biofilm formation for BW25113 hha hns cells producing the Hha–H‐NS variants from pCA24N using 1 mM IPTG in 96‐well polystyrene plates in LB at 37°C after 24 h (A). Hha and H‐NS amino acid substitutions are shown in Table 1 for Hha–H‐NS 36E4, Hha–H‐NS 39G4 and Hha–H‐NS K57N. Hha–H‐NS indicates simultaneous expression of both wild‐type Hha and H‐NS; Hha and H‐NS indicate wild‐type proteins expressed individually; H‐NS 39G4 indicates expression of H‐NS with H‐NS amino acid substitution taken from Hha–H‐NS 39G4; and H‐NS K57N indicates expression of H‐NS with the K57N substitution. Each data point is the average of at least twelve replicate wells from two independent cultures, and one standard deviation is shown. Biofilm formation of BW25113 hha hns cells producing wild‐type H‐NS (B) and H‐NS K57N (C) from pCA24N using 1 mM IPTG on glass in flow cells after 48 h in LB medium. Scale bars represent 10 µm.
Random mutagenesis of Hha–H‐NS and biofilm screening
To reconfigure H‐NS and Hha to control biofilm formation, we utilized the hha hns host so that there was no background Hha or H‐NS in these cells since Hha and H‐NS interact to control phenotypes (Madrid et al., 2007). To mutagenize randomly both hha and hns via epPCR, a pCA24N‐based vector was used to express hha and hns from a single promoter; hence, all the changes in phenotype were due to plasmid‐encoded Hha–H‐NS variants. The maximum error rate was determined to be 0.8% by sequencing three random colonies. A total of 2104 colonies were screened for altered biofilm formation, which resulted in the identification of three variants that decreased biofilm formation more than 12‐fold compared with wild‐type Hha–H‐NS (Fig. 1A).
Hha–H‐NS 36E4 had three substitutions in Hha (Y11H, E25G and L40Q) and four substitutions in H‐NS (R12C, K57I, P72T and D131V) (Table 1), whereas both Hha–H‐NS 39G4 and Hha–H‐NS K57N had completely inactivated Hha along with three substitutions and one substitution in H‐NS respectively (Table 1). Since Hha was inactivated in two of the best mutants, the reduction in biofilm formation must be from changes in H‐NS. To eliminate any possible chromosomal mutation effects, all the pCA24N‐hha hns plasmids identified during the initial biofilm formation screens were re‐transformed into BW25113 hha hns, and the changes in biofilm formation were confirmed; hence, the changes in biofilm formation are due to the changes in the hha hns genes on the plasmids.
Table 1.
Protein sequences of the Hha–H‐NS epPCR variants.
| Hha–H‐NS variants | Substitutions |
|---|---|
| Hha–H‐NS 36E4 | Hha: Y11H, E25G and L40Q |
| H‐NS: R12C, K57I, P72T and D131V | |
| Hha–H‐NS 39G4 | Hha: T23S, Y33 frame shift and N38X |
| H‐NS: N9I, R12C and T25M | |
| Hha–H‐NS K57N | Hha: A2 frame shift and L6X |
| H‐NS: K57N |
Hha–H‐NS 39G4 has a frameshift at Y33 in Hha due to the insertion of one base pair, and Hha–H‐NS K57N has a frameshift at A2 in Hha due to the deletion of one base pair. X indicates termination.
To study the effects on H‐NS alone, each mutation in hns that was found along with mutations in hha was introduced into pCA24N‐hns to investigate whether the biofilm reduction of both Hha–H‐NS 39G4 and Hha–H‐NS K57N variants come from only the mutations in H‐NS. Without Hha, H‐NS 39G4 (H‐NS N9I, R12C and T25M) lost its biofilm reduction activity, but H‐NS K57N maintained its significant reduction in biofilm formation (10‐fold) compared with wild‐type H‐NS (Fig. 1A). Hence, these results show that the global regulator H‐NS may be evolved to alter E. coli biofilm formation dramatically and switched from a protein that stimulates biofilm formation to one that reduces it.
To corroborate the static (96‐well) biofilm results, we also conducted flow cell biofilm experiments using cells expressing either wild‐type H‐NS (Fig. 1B) or H‐NS K57N (Fig. 1C) in Luria–Bertani (LB) medium after 48 h. COMSTAT analysis (Table S1) shows biomass was decreased by 9.6‐fold for H‐NS K57N, and the mean biofilm thickness (7.1‐fold) and substratum coverage were also decreased (3.3‐fold) compared with cells expressing wild‐type H‐NS. Therefore, both static and flow cell biofilm experiments confirm that H‐NS K57N reduces biofilm formation on glass (flow cell) as well as polystyrene (96‐well plate) surfaces.
Saturation mutagenesis at position K57 of H‐NS
Since two of the three sets of mutations in hns involve the K57 codon and one mutant had only one amino acid substitution in H‐NS (K57N) (Table 1), we investigated the importance of position K57 of H‐NS for biofilm formation by substituting all possible amino acids via saturation mutagenesis. After screening 300 colonies to ensure with a probability of 99% that all possible codons were utilized (Rui et al., 2004), we identified two variants (substitutions K57S and K57G) that show similar or less biofilm reduction relative to H‐NS K57N but still decrease biofilm formation significantly compared with wild‐type H‐NS. Hence, it is clear that position K57 of H‐NS is important for decreasing biofilm formation and that the K57N substitution is optimal.
H‐NS K57N decreases biofilm formation via Cnu and StpA
To discern how H‐NS K57N decreases biofilm formation, a whole‐transcriptome study of biofilm cells of H‐NS K57N versus wild‐type H‐NS was performed (hha hns/pCA24N‐hns K57N versus hha hns/pCA24N‐hns), and cnu was identified as induced by overproducing H‐NS K57N (Table S2). qRT‐PCR of biofilm cells of H‐NS K57N versus wild‐type H‐NS in BW25113 hha hns after 7 h confirmed that H‐NS K57N induces cnu transcription by 5.7‐fold (ΔΔCT = −2.5 ± 0.2, where CT is the threshold cycle of the target genes). Ori‐C binding protein Cnu (YdgT) (Kim et al., 2005) belongs to the Hha/YmoA family (Paytubi et al., 2004), complements partially for some of the hha‐induced phenotypes such as repression of the haemolysin operon (Paytubi et al., 2004), and interacts with H‐NS (Bae et al., 2008). Therefore, we hypothesized that the reduction in biofilm formation from H‐NS K57N was due to production of Cnu.
To determine the function of Cnu in biofilm formation, biofilm formation of the cnu deletion strain was tested. Deletion of cnu increased biofilm formation 12‐fold compared with wild‐type BW25113 strain after 7 h, and this phenotype was complemented in that cnu expression reduced biofilm formation more than threefold compared with the empty pCA24N control after 7 h (Fig. 2A). Thus, Cnu decreases biofilm formation like Hha. To see if H‐NS K57N controls biofilm formation via Cnu, we compared biofilm formation with the cnu deletion (BW25113 cnu) and wild‐type BW25113 in the presence of H‐NS K57N after 7 h and 24 h (Fig. 2B). Without Cnu, H‐NS K57N did not decrease biofilm formation, while it decreased biofilm formation for wild‐type BW25113 after 24 h (Fig. 2B).
Figure 2.
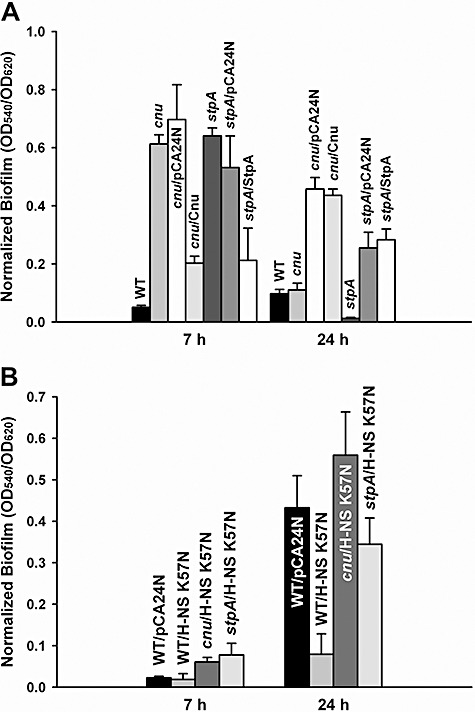
Biofilm formation with H‐NS K57N with Cnu and StpA. Normalized biofilm formation in 96‐well polystyrene plates in LB at 37°C after 7 h and 24 h for wild‐type BW25113 (WT), cnu deletion (cnu), cnu complementation (cnu/Cnu), stpA deletion (stpA), complemented stpA (stpA/StpA), and cnu or stpA deletion with the empty pCA24N (cnu/pCA24N and stpA/pCA24N, respectively) (A), and for H‐NS K57N with the cnu deletion (cnu/H‐NS K57N), with a stpA deletion (stpA/pCA24N), for wild‐type BW25113 (WT/H‐NS K57N) and for wild‐type BW25113 with the empty pCA24N (WT/pCA24N) (B). Each data point is the average of at least twelve replicate wells from two independent cultures, and one standard deviation is shown. H‐NS K57N, Cnu and StpA were produced using 1 mM IPTG.
Moreover, stpA, which encodes an H‐NS paralogue (Zhang et al., 1996), was induced threefold by H‐NS K57N in the whole‐transcriptome study (Table S2). Deletion of stpA decreases biofilm formation (Belik et al., 2008), indicating that StpA derepresses biofilm formation in E. coli K‐12. We obtained similar biofilm results after 24 h in that the stpA deletion reduced biofilm formation (Fig. 2A) and this phenotype could be complemented at 24 h (Fig. 2A). However, deletion of stpA increased biofilm formation and StpA overproduction reduced biofilm formation after 7 h; thus, StpA controls biofilm formation differently according to the stage of biofilm development. To see whether H‐NS K57N controls biofilm formation through StpA, we expressed H‐NS K57N in the stpA mutant and compared biofilm formation in wild‐type BW25113 with H‐NS K57N and found, like Cnu, the absence of StpA abolished biofilm repression by H‐NS K57N after 7 h and reduced the effect after 24 h (Fig. 2B). Therefore, StpA is necessary for H‐NS K57N to repress biofilm formation. Taken together, these results indicate that H‐NS K57N represses biofilm formation by interacting with nucleoid‐associated proteins Cnu and StpA.
H‐NS K57N induces Rac prophage excision through IntR and wild‐type H‐NS represses excision of Rac
The whole‐transcriptome study also showed that H‐NS K57N significantly repressed 28 genes in Rac prophage compared with wild‐type H‐NS (12‐ to 4100‐fold, Table S2); hence, we hypothesized that H‐NS K57N induced Rac excision so that these genes were no longer present, which resulted in their low signal. To investigate the impact of H‐NS on Rac prophage excision, pCA24N‐hns K57N was expressed in BW25113 hha hns for 24 h and the chromosome was sequenced at the Rac prophage location. We found that Rac was excised by homologous recombination between two repeat DNA sequences (5′‐TTGTTCAGGTTGTATTGTTCTTTCTT‐3′) flanking Rac prophage (Fig. 3A). Moreover, we quantified Rac excision by qPCR to find H‐NS K57N induced Rac excision 11‐fold after 7 h and 58‐fold after 24 h compared with wild‐type H‐NS in planktonic cells (Fig. 3B). Similarly, H‐NS K57N induced Rac excision 5.8 ± 0.0‐fold after 7 h and 1.7 ± 0.2‐fold after 24 h in biofilm cells.
Figure 3.
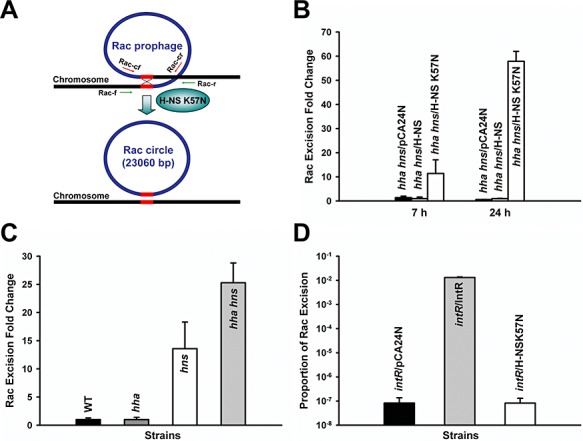
Excision of Rac prophage. Rac prophage in E. coli has two conserved attachment sites (5′‐TTGTTCAGGTTGTATTGTTCTTTCTT‐3′, 26 bp) at the left and the right ends of Rac indicated as red lines (A). Rac excision is induced by H‐NS K57N, and circularized to form a phage‐like circle. Rac excision and phage‐like circle were verified by DNA sequencing using primers Rac up and Rac down (Table S3) and by PCR using primer sets; green arrows indicate primers for Rac excision (Rac‐f and Rac‐r) and red arrows for the Rac circle (Rac‐cf and Rac‐cr) (Table S3). Excision of Rac in LB at 37°C for BW25113 hha hns cells producing H‐NS K57N and wild‐type H‐NS after 7 h and 24 h (B), for BW25113, BW25113 hha, BW25113 hns and BW25113 hha hns without a plasmid after 15 h (C), and for BW25113 intR producing H‐NS K57N and IntR after 24 h (D). The number of chromosomes was quantified by qPCR using a reference gene, purA, using primers purA‐f and purA‐r and the number of chromosomes devoid of Rac was quantified using primers Rac‐f and Rac‐r (Table S3). Each data point is the average of at least four replicates from each of two independent cultures, and one standard deviation is shown. H‐NS K57N, H‐NS and IntR were produced using 1 mM IPTG.
Since H‐NS represses genes obtained laterally (Navarre et al., 2007), and since we used the double hha hns deletion strain as a host, we tested the excision of Rac in wild‐type BW25113, BW25113 hha, BW25113 hns and BW25113 hha hns without plasmids to see if hns and hha control excision of Rac. As shown in Fig. 3C, hns deletion and hha hns double deletion induced the excision of Rac more than 13‐fold compared with wild‐type BW25113, while hha deletion did not increase Rac excision. This demonstrates that H‐NS silences the excision of Rac, which was acquired from lateral transfer. Hha induces the excision of another prophage, CP4‐57, in E. coli (Wang et al., 2009), but Hha does not control the excision of Rac (Fig. 3C). Therefore, the K57N substitution in H‐NS enhances Rac excision from the E. coli K‐12 chromosome (Fig. 3B), whereas wild‐type H‐NS represses Rac excision (Fig. 3C).
Integrase is required for lambdoid prophage excision by interacting with excisionase (Cho et al., 2002), and its gene is usually placed adjacent to the attachment site on the chromosome in order to interact with its DNA‐target. Similarly, Rac intR is found next to the Rac attachment site in E. coli K‐12 (Casjens, 2003). To see whether H‐NS K57N leads to Rac excision through IntR (recall there are eight other prophage elements in E. coli which may contribute), Rac excision by H‐NS K57N was tested in the deletion of intR. Without IntR, Rac was not excised with H‐NS K57N, and producing IntR highly enhanced Rac excision, indicating IntR is necessary to excise Rac prophage and required by H‐NS K57N (Fig. 3D).
Only Rac excision is controlled by H‐NS and H‐NS K57N
Since H‐NS K57N increases Rac prophage excision, we investigated whether wild‐type H‐NS and H‐NS K57N repress excision of the other five prophages (DLP12, e14, Qin, CPS‐53 and CPZ‐55) and three prophage‐like elements (CP4‐6, CP4‐44 and CP4‐57) in E. coli K‐12 BW25113 using qPCR. Rac and e14 were highly excisable, while the other prophages were difficult to excise (Fig. S1A) since they lack excisionase activity; for example, DLP12 xis in E. coli K‐12 is no longer functional (Lindsey et al., 1989). Deletion of hns did not increase the excision of any prophage except Rac whose excision was increased by 13‐fold (Fig. S1A). The Rac excision rate by cells producing wild‐type H‐NS in the hha hns double mutant (Fig. S1B) was not restored to that of the wild‐type strain (Fig. S1A), probably due to the non‐native promoter used to produce H‐NS from pCA24N‐hns (the T5‐lac promoter) since H‐NS functions as a repressor of its own transcription by interacting with its own promoter (Dersch et al., 1993; Ueguchi et al., 1993). Nevertheless, in the hha hns double mutant, only Rac excision among the nine prophages was enhanced significantly (58‐fold) by H‐NS K57N (Fig. S1B) relative to wild‐type H‐NS. Hence, wild‐type H‐NS represses only Rac excision in E. coli K‐12, and the evolved H‐NS can strongly induce only the excision of Rac prophage.
Rac prophage deletion changes biofilm formation
Previously, we discovered prophage CP4‐57 controls biofilm formation (Wang et al., 2009). To see the impact of Rac deletion on biofilm formation, we studied the effect of Rac deletion on temporal biofilm formation (Fig. S2). At early times (less than 13 h), Rac deletion (BW25113 Δrac) increased biofilm formation up to threefold compared with wild‐type BW25113, but at later times, biofilm formation was unchanged; these results are similar to the effect of cryptic prophage CP4‐57 on biofilm formation (Wang et al., 2009). Conversely, in the hha hns double deletion background, Rac deletion (BW25113 hha hnsΔrac) showed two‐ to threefold less biofilm formation (Fig. S2).
Excision of Rac prophage by H‐NS K57N enhances cell death and lysis
From the whole‐transcriptome study of H‐NS K57N biofilm cells versus wild‐type H‐NS biofilm cells, we observed that several ribosomal subunit genes (rplBCDKNPRVW, 50S ribosomal subunits; rpsEGHKL, 30S ribosomal subunits) were repressed by H‐NS K57N (Table S2). To investigate how H‐NS K57N affects cell growth, we measured the growth of cells during production of H‐NS K57N and wild‐type H‐NS in BW25113 hha hns (Fig. 4A) and found that with H‐NS K57N, growth was delayed compared with wild‐type H‐NS.
Figure 4.
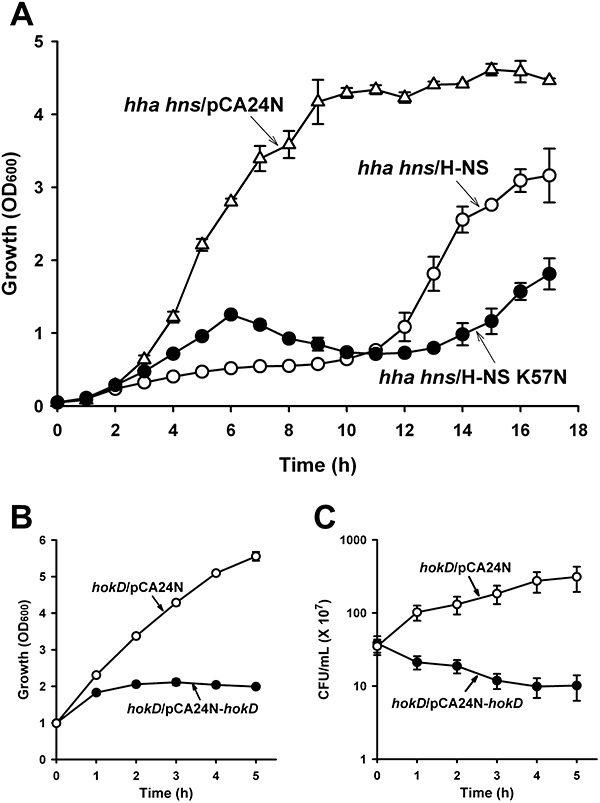
Growth during expression of H‐NS K57N and toxicity of HokD. Growth in LB at 37°C for BW25113 hha hns cells producing H‐NS K57N (hha hns/H‐NS K57N) and wild‐type H‐NS (hha hns/H‐NS) using 1 mM IPTG (A). Growth (B) and cell viability (cfu ml−1) (C) for BW25113 hokD producing HokD (hokD/HokD) using 1 mM IPTG at a turbidity of 1.0 at 600 nm. Each data point is the average of at least two independent cultures.
We hypothesized that this reduction in growth with H‐NS K57N was due to increased cell lysis as a result of Rac prophage excision, so we measured cell lysis using extracellular DNA (eDNA) as an indicator (Fig. 5). As a control, hha hns/pCA24N did not cause cell lysis, and wild‐type H‐NS (hha hns/pCA24N‐hns) also showed very low cell lysis (0.8%); however, H‐NS K57N (hha hns/pCA24N‐hns K57N) increased cell lysis 28‐fold versus wild‐type H‐NS (to 23%). Therefore, H‐NS K57N induces cell lysis, whereas wild‐type H‐NS does not.
Figure 5.
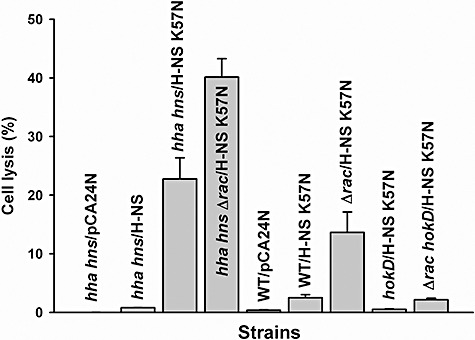
Cell lysis by H‐NS K57N in wild‐type BW25113 (WT), BW25113 hha hns (hha hns), BW25113 Δrac (Δrac), BW25113 hokD (hokD) and BW25113 Δrac hokD (Δrac hokD) in LB at 37°C after 11 h. Extracellular DNA (eDNA) and intracellular DNA (iDNA) were quantified by qPCR using reference gene purA via the purA‐f and purA‐r primers. Cell lysis was calculated by dividing the amount of eDNA by the sum of eDNA and iDNA. Each data point is the average of at least four replicates from two independent cultures, and one standard deviation is shown. H‐NS K57N and H‐NS were produced using 1 mM IPTG.
We then investigated the role of Rac prophage for the increased lysis with H‐NS K57N since some defective prophages such as DLP12 and Qin in E. coli K‐12 retain a two‐component cell lysis cassette (holin‐endolysin) (Srividhya and Krishnaswamy, 2007), since excision of Rac prophage is increased dramatically by H‐NS K57N (Fig. 3B), and since Rac prophage addition is lethal to a Rac‐ host upon conjugative transfer due to expression of the Rac killing gene kil (Conter et al., 1996). Surprisingly, we found production of H‐NS K57N in the Rac deletion strain (hha hnsΔrac/pCA24N‐hns K57N) was even more effective at causing cell lysis (increase of 1.8‐fold relative to hha hns/pCA24N‐hns K57N) (Fig. 5). Consistent results were obtained with BW25113 Δrac with H‐NS K57N versus wild‐type BW25113 with production of H‐NS K57N (5.5‐fold increase in cell lysis). Therefore, deletion of Rac prophage makes the cell more susceptible to lysis by H‐NS K57N so as Rac is excised, the cell becomes more sensitive to H‐NS K57N; this may explain the odd growth phenotype seen upon producing H‐NS K57N (Fig. 4A).
H‐NS K57N induces cell death and lysis via HokD
To further examine the mechanism of cell lysis by H‐NS K57N, we investigated other induced/repressed genes of the whole‐transcriptome analysis results and found several genes inside Qin prophage that were induced (Table S2). Qin harbours important genes related to cell division and cell lysis; for example, dicC controls cell division inhibition proteins (Béjar et al., 1986), dicF inhibits ftsZ (Faubladier and Bouché, 1994), and hokD (relF) induces cell death (Gerdes et al., 1986). Since HokD has been identified as a homologue of the Hok (host killing) protein of R1 plasmid (Gerdes et al., 1986), causes cell death by leading to loss of the cell membrane potential (Gerdes et al., 1997) and its gene was induced slightly (1.6‐fold) by H‐NS K57N in the whole‐transcriptome analysis (Table S2), we focused on HokD to investigate the cell lysis mechanism by H‐NS K57N. HokD overexpression decreased cell growth (Fig. 4B) as well as decreased cell viability (Fig. 4C), demonstrating that HokD is toxic and finally leads to cell death. Moreover, when H‐NS K57N was expressed in the absence of HokD using both hokD/pCA24N‐hns K57N and Δrac hokD/pCA24N‐hns K57N, cell lysis by H‐NS K57N was reduced (Fig. 5). Corroborating these cell lysis results, transcription of hokD was induced by 4.3‐fold (ΔΔCT = −2.1 ± 0.4) as shown by qRT‐PCR with planktonic cells of H‐NS K57N versus wild‐type H‐NS in BW25113 hha hns after 1 h by adding 1 mM IPTG at a turbidity of 0.5 at 600 nm. Furthermore, since Rac excision and deletion led to more cell lysis by H‐NS K57N, HokD may be induced by H‐NS K57N in the absence of Rac. As expected, qRT‐PCR confirmed that hokD transcription is induced by 3.3‐fold (ΔΔCT = −1.7 ± 0.1) upon Rac deletion (BW25113 Δrac versus wild‐type BW25113) as well as induced by 2.2‐fold (ΔΔCT = −1.1 ± 0.1) upon producing H‐NS K57N (hha hnsΔrac/pCA24N‐hns K57N versus hha hns/pCA24N‐hns K57N) after 11 h. Hence, H‐NS K57N induces expression of hokD along with Rac excision, which results in cell lysis.
Discussion
In this study, we demonstrate that the global regulator H‐NS of E. coli may be evolved to control three important cellular phenotypes: biofilm formation, Rac prophage excision and cell lysis. We screened biofilm variants in the absence of endogenous Hha and H‐NS and identified an H‐NS variant with a single‐amino‐acid change, H‐NS K57N, which reduces biofilm formation by 10‐fold (Fig. 1). The mechanism by which H‐NS K57N reduces biofilm formation is through its interaction with Cnu and StpA (Table S2 and Fig. 2A and B). Cnu is an Hha paralogue, and StpA is an H‐NS paralogue, and both are nucleoid‐associated proteins. Here, we also show that Cnu reduces biofilm formation like Hha. Both Cnu and StpA have the ability to associate with H‐NS by interacting with the N‐terminus of H‐NS (Bae et al., 2008; Leonard et al., 2009). Therefore, our results imply that the altered H‐NS may interact closely with Cnu and StpA to reduce biofilm reduction.
The N‐terminus of H‐NS includes three helical segments, H1 (1–8 aa), H2 (12–19 aa) and H3 (23–47 aa) (Fang and Rimsky, 2008), and plays an important role in forming homo‐ or hetero‐oligomers of H‐NS with Hha, Cnu and StpA. In this study, the K57N substitution of H‐NS occurred at a filament‐like region in the N‐terminus which is near a flexible linker, but not in the helical segments. This substitution replaces the positively charged, long side‐chain of lysine with a neutrally charged, short side‐chain of asparagine. The K57N substitution of H‐NS may influence oligomerization of H‐NS, cause a conformational change of the flexible linker, or cause a conformational change of the C‐terminus, all of which would affect the DNA binding properties of H‐NS. It is interesting that only a single‐amino‐acid substitution causes such dramatic physiological changes in the cell (biofilm formation, Rac prophage excision and cell lysis).
The role of H‐NS is to silence foreign DNA (Navarre et al., 2007) by binding to curved DNA which is commonly found at promoters (Dorman, 2004). Prophages are genes laterally acquired that play an important role in the diversification of the genome (Oshima et al., 2006), and repression of the Rac prophage excision by H‐NS is the first report of this activity by H‐NS (Fig. S1A). Moreover, we found that the reconfigured H‐NS K57N protein induces Rac prophage excision, which is opposite to wild‐type H‐NS (Fig. 3B). When Rac was deleted from the chromosome, it influenced biofilm formation by increasing biofilms as early as 13 h (BW25113 Δrac versus wild‐type BW25113) and by decreasing biofilms with the deletion of hha and hns (BW25113 hha hnsΔrac versus BW25113 hha hns) (Fig. S2). Also, deletion of Rac enhanced cell lysis by H‐NS K57N (Fig. 5). Note Rac is one of the most excisable prophages in E. coli K‐12 (Fig. S1A). By regulating excision and integration of Rac prophage via H‐NS, E. coli cells may enhance fitness in response to the environmental changes in terms of biofilm formation and cell lysis.
H‐NS K57N induces cell lysis by regulating a small toxic membrane protein HokD (Fig. 5). Previously, the function of HokD in E. coli was unclear, since the regulation element of the upstream part of hokD seems to be missing compared with hok in the R1 plasmid (Pedersen and Gerdes, 1999). However, our whole‐transcriptome study and qRT‐PCR results show that HokD is induced by H‐NS K57N (Table S2), that HokD is required for H‐NS K57N to increase cell lysis (Fig. 5), and that hokD expression is related to Rac excision. Rac prophage may repress cell lysis by inhibiting HokD when Rac is in the chromosome, but if E. coil experiences some environmental stress, cells may kill themselves by expressing toxin proteins such as HokD that is induced due to Rac excision. The protein engineering of H‐NS to form variant K57N thus represents one of the first examples of creating a global regulator to control prokaryotic apoptosis.
H‐NS represses virulence genes in EHEC (Mellies et al., 2007), and several virulence genes are located in prophages; for example, Shiga toxin 1 (stx1) and 2 (stx2) genes are in cryptic prophage CP‐933V and bacteriophage BP‐933W, respectively, in E. coli O157:H7 EDL933 (Perna et al., 2001). CP‐933R in O157:H7 EDL933, Sp10 in O157 Sakai and Rac in K‐12 are located at identical positions in the three genomes and have identical attachment sites (Casjens, 2003). Our preliminary data show that transcription of virulence genes, stx1A in CP‐933V, stx2A in BP‐933W and espB in LEE, is repressed up to eightfold by producing wild‐type H‐NS, while stx1A is induced by producing H‐NS K57N in EHEC. These results indicate that H‐NS and the evolved H‐NS influence expression of virulence genes in EHEC. Since wild‐type H‐NS represses the excision of Rac prophage (Fig. S1A) and H‐NS K57N increases excision (Fig. S1B), it is possible that H‐NS may affect virulence by controlling prophage excision in EHEC.
In this study, we demonstrate that the global regulator H‐NS may be evolved readily, which is similar to our results in which we evolved the QS signal regulator SdiA of E. coli to respond to homoserine lactones and to control indole concentrations (Lee et al., 2009). Evolution of global regulators may cause widespread changes in the regulatory system in bacteria, including apoptosis, prophage excision and biofilm formation as we show here; hence, this study implies that bacteria may evolve global regulators for the beneficial use of foreign genes that were originally introduced by prophage.
Experimental procedures
Bacterial strains and growth conditions
Escherichia coli K‐12 BW25113, its isogenic mutants and the plasmids that were used in this study are listed in Table 2. We used the Keio collection (Baba et al., 2006) for isogenic mutants and the ASKA library (Kitagawa et al., 2005) for overexpressing genes. BW25113 hha hns was used as the host for screening plasmids containing hha hns alleles that were created via error‐prone polymerase change reaction (epPCR) and was constructed using P1 transduction as described previously (Maeda et al., 2008). The gene deletions were confirmed by PCR using primers hha up, hha down, hns up and hns down (Table S3), which flank each gene of interest and confirm both the insertion and elimination of the KmR gene. All strains were initially streaked from −80°C glycerol stocks on LB agar plates and were cultured at 37°C in LB (Sambrook et al., 1989). Kanamycin (50 µg ml−1) was used for pre‐culturing isogenic knockout mutants, and chloramphenicol (30 µg ml−1) was used for maintaining pCA24N‐based plasmids. Genes were expressed from pCA24N using 1 mM isopropyl‐β‐d‐thiogalactopyranoside (IPTG) (Sigma, St Louis, MO, USA).
Table 2.
Escherichia coli K‐12 bacterial strains and plasmids used in this study.
| Strains and plasmids | Genotype/relevant characteristics | Source |
|---|---|---|
| Strains | ||
| BW25113 | lacIqrrnBT14ΔlacZWJ16hsdR514 ΔaraBADAH33ΔrhaBADLD78 | Baba et al. (2006) |
| BW25113 cnu | BW25113 ΔcnuΩ KmR | Baba et al. (2006) |
| BW25113 hha | BW25113 ΔhhaΩ KmR | Baba et al. (2006) |
| BW25113 hns | BW25113 ΔhnsΩ KmR | Baba et al. (2006) |
| BW25113 hokD | BW25113 ΔhokDΩ KmR | Baba et al. (2006) |
| BW25113 intR | BW25113 ΔintRΩ KmR | Baba et al. (2006) |
| BW25113 stpA | BW25113 ΔstpAΩ KmR | Baba et al. (2006) |
| BW25113 hha hns | BW25113 ΔhhaΔhnsΩ KmR | This study |
| BW25113 Δrac | BW25113 Δrac | This study |
| BW25113 Δrac hokD | BW25113 ΔracΔhokDΩ KmR | This study |
| BW25113 hha hnsΔrac | BW25113 ΔhhaΔhnsΔracΩ KmR | This study |
| Plasmids | ||
| pCA24N | CmR; lacIq, pCA24N | Kitagawa et al. (2005) |
| pCA24N‐cnu | CmR; lacIq, pCA24N PT5‐lac::cnu+ | Kitagawa et al. (2005) |
| pCA24N‐hha | CmR; lacIq, pCA24N PT5‐lac::hha+ | Kitagawa et al. (2005) |
| pCA24N‐hns | CmR; lacIq, pCA24N PT5‐lac::hns+ | Kitagawa et al. (2005) |
| pCA24N‐hokD | CmR; lacIq, pCA24N PT5‐lac::hokD+ | Kitagawa et al. (2005) |
| pCA24N‐intR | CmR; lacIq, pCA24N PT5‐lac::intR+ | Kitagawa et al. (2005) |
| pCA24N‐hha hns | CmR; lacIq, pCA24N PT5‐lac::hha+hns+ | This study |
| pHKT3 | TetR, RFP+ | Tomlin et al. (2004) |
KmR, CmR and TetR are kanamycin, chloramphenicol and tetracycline resistance respectively.
Construction of pCA24N‐hha hns
hns was amplified using PCR from BW25113 chromosomal DNA using primers hns‐SalI‐f and hns‐HindIII‐r (Table S3), which were designed to have SalI and HindIII restriction recognition sites respectively. The PCR product was cloned into pCA24N‐hha using SalI and HindIII downstream of hha in the plasmid. The hha hns transcriptional fusion in pCA24N was confirmed by DNA sequencing using primers seq‐f1 and seq‐f2 (Table S3).
epPCR for random mutagenesis
Both hha and hns from plasmid pCA24N‐hha hns under the control of T5‐lac promoter were mutated by epPCR as described previously (Fishman et al., 2004) using primers epPCR‐f and epPCR‐r (Table S3). The epPCR product was cloned into pCA24N‐hha hns using BseRI and HindIII after treating the plasmid with Antarctic phosphatase (New England Biolabs, Beverly, MA, USA). The ligation mixture was electroporated into BW25113 hha hns as described previously (Fishman et al., 2004).
Biofilm screening of Hha–H‐NS variants
Biofilm mutants were screened using polystyrene 96‐well microtiter plates (Corning Costar, Cambridge, MA, USA) as described previously with crystal violet staining (Pratt and Kolter, 1998). The crystal violet dye stains both the air–liquid interface and bottom liquid–solid interface biofilm, and the total biofilm formation at both interfaces was measured at 540 nm whereas cell growth was measured at 620 nm. BW25113 hha hns colonies producing Hha–H‐NS variants from pCA24N‐hha hns were grown overnight in 96‐well plates with 200 µl of medium at 250 r.p.m., the overnight cultures were diluted (1:100) in 300 µl of LB containing 1 mM IPTG, and biofilm was formed for 24 h without shaking. To remove growth effects, biofilm formation was normalized by dividing total biofilm by cell growth for each strain. As controls, BW25113 hha hns with empty pCA24N and pCA24N‐hha hns (wild‐type hha and hns) were used. Interesting biofilm mutants were re‐analysed by re‐streaking the colonies on fresh LB plates and by performing another biofilm assay. Mutant hha hns alleles were sequenced using primers seq‐f1 and seq‐f2 (Table S3). Each data point was averaged from more than 12 replicate wells (six wells each from two independent cultures).
Flow cell biofilm experiments and image analysis
Strains were cultured in LB medium with chloramphenicol to retain the pCA24N‐based plasmids and with tetracycline (20 µg ml−1) to maintain pHKT3 (Tomlin et al., 2004). Overnight cultures were diluted to a turbidity at 600 nm of 0.05 and pumped through the flow cell (BST model FC81, Biosurface Technologies, Bozeman, MT, USA) at 10 ml h−1 for 2 h, and then fresh LB medium with chloramphenicol, tetracycline, and 1 mM IPTG was pumped for 48 h. Since the red fluorescent protein via pHKT3 was weak in BW25113 hha hns, the flow cell biofilms were stained for 30 min with 5 µl ml−1 SYTO 9 from the LIVE/DEAD BacLight Bacterial Viability Kit (Molecular Probes, Carlsbad, CA, USA), which causes both live and dead bacteria to fluoresce green (Cense et al., 2006). The biofilms on the glass slides were visualized by exciting with an Ar laser at 488 nm (emission 510–530 nm) using a TCS SP5 scanning confocal laser microscope (Leica Microsystems, Wetzlar, Germany) with a 63× HCX PL FLUOTAR L dry objective. Six random positions were chosen, and 25 images were taken for each position. Simulated three‐dimensional images were obtained using IMARIS software (BITplane, Zurich, Switzerland). Colour confocal flow cell images were converted to grey scale, and biomass, substratum coverage, mean thickness and surface roughness were determined using COMSTAT image‐processing software (Heydorn et al., 2000).
Cloning of hns alleles into pCA24N‐hns
To study the impact of the mutations in hns in the absence of hha, we transferred the mutations in hns of hha hns that give rise to alleles H‐NS K57N and H‐NS 39G4 to pCA24N‐hns. For introducing the K57N substitution to pCA24N‐hns, site‐directed mutagenesis was performed using a QuikChange XL Site‐directed Mutagenesis Kit (Stratagene, La Jolla, CA, USA) using primers hns‐K57N‐f and hns‐K57N‐r (Table S3). Since hha hns 39G4 has several mutations in hns, these mutations were introduced through cloning with restriction enzyme BglI. The PCR product using primers hns‐39G4‐f and hns‐39G4‐r (Table S3) on pCA24N‐hha hns containing 39G4 allele was digested with BglI. The DNA fragments were ligated after treating the digested pCA24N‐hns with Antarctic phosphatase (New England Biolabs, Beverly, MA, USA). The cloned plasmids were electroporated into BW25113 hha hns.
Saturation mutagenesis
The QuikChange XL Site‐directed Mutagenesis Kit (Stratagene, La Jolla, CA, USA) was used to perform saturation mutagenesis of hns at the codon corresponding to position K57. Plasmid pCA24N‐hns was used as a template. DNA primers hns‐K57sm‐f and hns‐K57sm‐r (Table S3) were designed to allow the substitution of all 20 amino acids using 32 possible codons (Rui et al., 2004); the constructed plasmids were electroporated into BW25113 hha hns.
RNA isolation and whole‐transcriptome studies
For the whole‐transcriptome study of BW25113 hha hns/pCA24N‐hns K57N versus BW25113 hha hns/pCA24N‐hns, cells were grown in 250 ml of LB containing 1 mM IPTG for 7 h with 10 g of glass wool (Corning Glass Works, Corning, NY, USA) in 1 l Erlenmeyer flasks to form a robust biofilm (Ren et al., 2004a). Biofilm cells were obtained by rinsing and sonicating the glass wool in sterile 0.85% NaCl solution at 0°C and RNALater buffer (Applied Biosystems, Foster City, CA, USA) was added to stabilize RNA during the RNA preparation steps. Total RNA was isolated from biofilm cells as described previously (Ren et al., 2004a) using a bead beater (Biospec, Bartlesville, OK, USA). cDNA synthesis, fragmentation and hybridizations to the E. coli GeneChip Genome 2.0 array (Affymetrix, Santa Clara, CA, USA; P/N 511302) were described previously (González Barrios et al., 2006). Genes were identified as differentially expressed if the expression ratio was higher (2.7‐fold) than the standard deviation (1.4‐fold) and if the P‐value for comparing two chips was less than 0.05 (Ren et al., 2004b). The whole‐transcriptome data have been deposited in the NCBI Gene Expression Omnibus (http://www.ncbi.nlm.nih.gov/geo/) and are accessible through accession number GSE17853.
Quantitative real‐time PCR (qPCR)
To determine the relative concentrations of specific DNA fragments, qPCR was used as described previously (Wang et al., 2009). Total DNA (50–200 ng) isolated using the UltraClean Microbial DNA Isolation Kit (Mo Bio Laboratories, Carlsbad, CA, USA) was used as the template for the qPCR reaction using the Power SYBR Green RNA‐to‐CT 1‐Step Kit (Applied Biosystems, Foster City, CA, USA). The reaction and analysis was carried out by the StepOne Real‐Time PCR System (Applied Biosystems, Foster City, CA, USA). A quantification method based on the relative amount of a target gene versus a reference gene was used (Pfaffl, 2001). The number of total chromosomes was quantified by a reference gene, adenylosuccinate synthase (purA). The number of chromosomes that are devoid of prophage was quantified using primers flanking each prophage (Table S3), which only give PCR products when the prophage is removed due to the size of the prophage.
Quantitative real‐time reverse‐transcription PCR (qRT‐PCR)
To corroborate the DNA microarray data, qRT‐PCR was used to quantify relative RNA concentrations using 100 ng as a template and included a complementary DNA synthesis step from RNA before the denaturation step. Primers for qRT‐PCR of cnu and hokD are listed in Table S3. The housekeeping gene rrsG (16S rRNA gene) was used to normalize the gene expression data.
Construction of the Rac prophage deletion strain
To study the impact of the Rac prophage deletion on biofilm formation and cell lysis, we constructed a Rac deletion strain from wild‐type BW25113 and BW25113 hha hns by producing H‐NS K57N in LB with 1 mM IPTG for 24 h. The overnight culture was diluted (1:100) in LB containing 1 mM IPTG, and incubated for 24 h, single colonies were obtained by spreading the culture on LB agar plate, and Rac deletion strain was verified by PCR using primers (Table S3): Rac excision was verified by flanking primers Rac‐f and Rac‐r, removal of the Rac circle was verified by Rac‐cf and Rac‐cr, and complete deletion of Rac in the genome was confirmed by the absence of a PCR product using primers intR‐f and intR‐r that flank one Rac attachment site and the first gene of Rac, intR. pCA24N‐hns K57N and the Rac circle were eliminated by incubating at 25°C for 24 h.
Cell lysis measurement
To quantify cell lysis, the DNA concentration in supernatants and in cells was measured by qPCR using reference gene purA with modifications (Ma and Wood, 2009). Cells were grown with 1 mM IPTG for 11 h, and then the culture (1 ml) was centrifuged at 13 000 r.p.m. for 5 min to obtain supernatant and cell pellet fractions. eDNA was obtained by filtering the supernatant (Vilain et al., 2009) using a 0.22 µm‐pore size Millex (33 mm) PES membrane filter (Millipore, Billerica, MA, USA) and was diluted 100 times with distilled water (dH2O) to eliminate the influence of LB on the qPCR reaction. Intracellular DNA (iDNA) was obtained from the cell pellet by resuspending the pellet in 1 ml of dH2O, sonicating twice using a 60 Sonic Dismembrator (Fisher Scientific, Pittsburgh, PA, USA) at level 10 for 15 s, centrifuging, filtering and diluting 10 times with dH2O. The amount of eDNA and iDNA was quantified using a standard curve produced by plotting serial dilutions of genomic DNA of BW25113 versus its Ct value. The cell lysis percentage was calculated by dividing the amount of eDNA by total DNA (eDNA and iDNA).
Acknowledgments
This work was supported by the National Institutes of Health (R01 EB003872 and R01 GM089999) and the Army Research Office (W911NF‐06‐1‐0408). We thank the National Institute of Genetics in Japan for providing the Keio and ASKA strains and Qun Ma for her help with confocal microscopy.
Supporting Information
Additional Supporting Information may be found in the online version of this article:
Fig. S1. Excision of nine prophages in LB at 37°C upon deleting hns after 15 h (A) and for BW25113 hha hns cells producing H-NS K57N and wild-type H-NS using 1 mM IPTG after 24 h (B). The number of chromosomes was quantified by qPCR using a reference gene, purA, via purA-f and purA-r primers, and the number of chromosomes devoid of prophages was quantified using primers as described in Table S3. Each data point is the average of at least four replicates from each of two independent cultures, and one standard deviation is shown.
Fig. S2. Temporal biofilm formation of Rac deletion mutants. Normalized biofilm formation upon deleting Rac prophage from wild-type BW25113 (WT) and BW25113 hha hns (hha hns) after 32 h in 96-well polystyrene plates in LB at 37°C. Each data point is the average of at least twelve replicate wells from two independent cultures.
Table S1. COMSTAT analysis for flow cell biofilms producing wild-type H-NS and H-NS K57N in LB medium with 1 mM IPTG after 48 h at 37°C.
Table S2. List of differentially expressed genes for biofilm cells of BW25113 hha hns/pC24N hns K57N versus BW25113 hha hns/pC24N hns grown in LB with 30 μg ml−1 chloramphenicol and 1 mM IPTG for 7 h at 37°C. Raw data for the two DNA microarrays are available using GEO series accession number GSE17853. Primarily, genes differentially expressed above 2.7-fold are shown although some related genes are also shown.
Table S3. Primers used for error-prone PCR, cloning, DNA sequencing, confirmation of the mutants, qPCR, and qRT-PCR. Underlined italic text indicates restriction enzyme recognition sites: SalI for hns-SalI-f, HindIII for hns-HindIII-r, and BglI for hns-39G4-f and hns-39G4-r. Underlined bold text indicates the site-directed mutation for the codon corresponding to K57 (5′-AAA to 5′-AAC for K57N) in hns-K57N-f and hns-K57N-r and indicates the saturation mutation of the codon corresponding to K57 (5′-NNS) in hns-K57sm-f and hns-K57sm-r (N is A, G, C or T, and S is G or C).
Please note: Wiley-Blackwell are not responsible for the content or functionality of any supporting materials supplied by the authors. Any queries (other than missing material) should be directed to the corresponding author for the article.
References
- Baba T., Ara T., Hasegawa M., Takai Y., Okumura Y., Baba M. Construction of Escherichia coli K‐12 in‐frame, single‐gene knockout mutants: the Keio collection. Mol Syst Biol. 2006;2:0008. doi: 10.1038/msb4100050. et al. [DOI] [PMC free article] [PubMed] [Google Scholar]
- Bae S.‐H., Liu D., Lim H.M., Lee Y., Choi B.‐S. Structure of the nucleoid‐associated protein Cnu reveals common binding sites for H‐NS in Cnu and Hha. Biochemistry. 2008;47:1993–2001. doi: 10.1021/bi701914t. [DOI] [PubMed] [Google Scholar]
- Baños R.C., Vivero A., Aznar S., García J., Pons M., Madrid C., Juárez A. Differential regulation of horizontally acquired and core genome genes by the bacterial modulator H‐NS. PLoS Genet. 2009;5:e1000513. doi: 10.1371/journal.pgen.1000513. [DOI] [PMC free article] [PubMed] [Google Scholar]
- Béjar S., Cam K., Bouché J.‐P. Control of cell division in Escherichia coli. DNA sequence of dicA and of a second gene complementing mutation dicA1dicC. Nucleic Acids Res. 1986;14:6821–6833. doi: 10.1093/nar/14.17.6821. [DOI] [PMC free article] [PubMed] [Google Scholar]
- Belik A.S., Tarasova N.N., Khmel I.A. Regulation of biofilm formation in Escherichia coli K12: effect of mutations in the genes HNS, StpA, Lon, RpoN. Mol Gen Microbiol Virol. 2008;23:159–162. [PubMed] [Google Scholar]
- Blattner F.R., Plunkett G., III, Bloch C.A., Perna N.T., Burland V., Riley M. The complete genome sequence of Escherichia coli K‐12. Science. 1997;277:1453–1462. doi: 10.1126/science.277.5331.1453. et al. [DOI] [PubMed] [Google Scholar]
- Casjens S. Prophages and bacterial genomics: what have we learned so far? Mol Microbiol. 2003;49:277–300. doi: 10.1046/j.1365-2958.2003.03580.x. [DOI] [PubMed] [Google Scholar]
- Cense A.W., Peeters E.A.G., Gottenbos B., Baaijens F.P.T., Nuijs A.M., Van Dongen M.E.H. Mechanical properties and failure of Streptococcus mutans biofilms, studied using a microindentation device. J Microbiol Methods. 2006;67:463–472. doi: 10.1016/j.mimet.2006.04.023. [DOI] [PubMed] [Google Scholar]
- Cho E.H., Gumport R.I., Gardner J.F. Interactions between integrase and excisionase in the phage lambda excisive nucleoprotein complex. J Bacteriol. 2002;184:5200–5203. doi: 10.1128/JB.184.18.5200-5203.2002. [DOI] [PMC free article] [PubMed] [Google Scholar]
- Conter A., Bouché J.‐P., Dassain M. Identification of a new inhibitor of essential division gene ftsZ as the kil gene of defective prophage Rac. J Bacteriol. 1996;178:5100–5104. doi: 10.1128/jb.178.17.5100-5104.1996. [DOI] [PMC free article] [PubMed] [Google Scholar]
- Dalai B., Zhou R., Wan Y., Kang M., Li L., Li T. Histone‐like protein H‐NS regulates biofilm formation and virulence of Actinobacillus pleuropneumoniae. Microb Pathog. 2009;46:128–134. doi: 10.1016/j.micpath.2008.11.005. et al. [DOI] [PubMed] [Google Scholar]
- Dersch P., Schmidt K., Bremer E. Synthesis of the Escherichia coli K‐12 nucleoid‐associated DNA‐binding protein H‐NS is subjected to growth‐phase control and autoregulation. Mol Microbiol. 1993;8:875–889. doi: 10.1111/j.1365-2958.1993.tb01634.x. [DOI] [PubMed] [Google Scholar]
- Domka J., Lee J., Bansal T., Wood T.K. Temporal gene‐expression in Escherichia coli K‐12 biofilms. Environ Microbiol. 2007;9:332–346. doi: 10.1111/j.1462-2920.2006.01143.x. [DOI] [PubMed] [Google Scholar]
- Dorman C.J. H‐NS: a universal regulator for a dynamic genome. Nat Rev Microbiol. 2004;2:391–400. doi: 10.1038/nrmicro883. [DOI] [PubMed] [Google Scholar]
- Fang F.C., Rimsky S. New insights into transcriptional regulation by H‐NS. Curr Opin Microbiol. 2008;11:113–120. doi: 10.1016/j.mib.2008.02.011. [DOI] [PMC free article] [PubMed] [Google Scholar]
- Faubladier M., Bouché J.‐P. Division inhibition gene dicF of Escherichia coli reveals a widespread group of prophage sequences in bacterial genomes. J Bacteriol. 1994;176:1150–1156. doi: 10.1128/jb.176.4.1150-1156.1994. [DOI] [PMC free article] [PubMed] [Google Scholar]
- Fishman A., Tao Y., Bentley W.E., Wood T.K. Protein engineering of toluene 4‐monooxygenase of Pseudomonas mendocina KR1 for synthesizing 4‐nitrocatechol from nitrobenzene. Biotechnol Bioeng. 2004;87:779–790. doi: 10.1002/bit.20185. [DOI] [PubMed] [Google Scholar]
- García‐Contreras R., Zhang X.‐S., Kim Y., Wood T.K. Protein translation and cell death: the role of rare tRNAs in biofilm formation and in activating dormant phage killer genes. PLoS ONE. 2008;3:e2394. doi: 10.1371/journal.pone.0002394. [DOI] [PMC free article] [PubMed] [Google Scholar]
- Gerdes K., Bech F.W., Jørgensen S.T., Løbner‐Olesen A., Rasmussen P.B., Atlung T. Mechanism of postsegregational killing by the hok gene product of the parB system of plasmid Rl and its homology with the relF gene product of the E. coli relB operon. EMBO J. 1986;5:2023–2029. doi: 10.1002/j.1460-2075.1986.tb04459.x. et al. [DOI] [PMC free article] [PubMed] [Google Scholar]
- Gerdes K., Gultyaev A.P., Franch T., Pedersen K., Mikkelsen N.D. Antisense RNA‐regulated programmed cell death. Annu Rev Genet. 1997;31:1–31. doi: 10.1146/annurev.genet.31.1.1. [DOI] [PubMed] [Google Scholar]
- González Barrios A.F., Zuo R., Hashimoto Y., Yang L., Bentley W.E., Wood T.K. Autoinducer 2 controls biofilm formation in Escherichia coli through a novel motility quorum‐sensing regulator (MqsR, B3022) J Bacteriol. 2006;188:305–316. doi: 10.1128/JB.188.1.305-316.2006. [DOI] [PMC free article] [PubMed] [Google Scholar]
- Heydorn A., Nielsen A.T., Hentzer M., Sternberg C., Givskov M., Ersbøll B.K., Molin S. Quantification of biofilm structures by the novel computer program COMSTAT. Microbiology. 2000;146:2395–2407. doi: 10.1099/00221287-146-10-2395. [DOI] [PubMed] [Google Scholar]
- Hommais F., Krin E., Laurent‐Winter C., Soutourina O., Malpertuy A., Caer J.‐P.L. Large‐scale monitoring of pleiotropic regulation of gene expression by the prokaryotic nucleoid‐associated protein, H‐NS. Mol Microbiol. 2001;40:20–36. doi: 10.1046/j.1365-2958.2001.02358.x. et al. [DOI] [PubMed] [Google Scholar]
- Jayaraman A., Wood T.K. Bacterial quorum sensing: signals, circuits, and implications for biofilms and disease. Annu Rev Biomed Eng. 2008;10:145–167. doi: 10.1146/annurev.bioeng.10.061807.160536. [DOI] [PubMed] [Google Scholar]
- Jayaraman A., Mansfeld F.B., Wood T.K. Inhibiting sulfate‐reducing bacteria in biofilms by expressing the antimicrobial peptides indolicidin and bactenecin. J Ind Microbiol Biotechnol. 1999;22:167–175. doi: 10.1007/s002530051520. [DOI] [PubMed] [Google Scholar]
- Johansson J., Uhlin B.E. Differential protease‐mediated turnover of H‐NS and StpA revealed by a mutation altering protein stability and stationary‐phase survival of Escherichia coli. Proc Natl Acad Sci USA. 1999;96:10776–10781. doi: 10.1073/pnas.96.19.10776. [DOI] [PMC free article] [PubMed] [Google Scholar]
- Karatan E., Watnick P. Signals, regulatory networks, and materials that build and break bacterial biofilms. Microbiol Mol Biol Rev. 2009;73:310–347. doi: 10.1128/MMBR.00041-08. [DOI] [PMC free article] [PubMed] [Google Scholar]
- Kim M.S., Bae S.‐H., Yun S.H., Lee H.J., Ji S.C., Lee J.H. Cnu, a novel oriC‐binding protein of Escherichia coli. J Bacteriol. 2005;187:6998–7008. doi: 10.1128/JB.187.20.6998-7008.2005. et al. [DOI] [PMC free article] [PubMed] [Google Scholar]
- Kitagawa M., Ara T., Arifuzzaman M., Ioka‐Nakamichi T., Inamoto E., Toyonaga H., Mori H. Complete set of ORF clones of Escherichia coli ASKA library (a complete set of E. coli K‐12 ORF archive): unique resources for biological research. DNA Res. 2005;12:291–299. doi: 10.1093/dnares/dsi012. [DOI] [PubMed] [Google Scholar]
- Lee J., Maeda T., Hong S.H., Wood T.K. Reconfiguring the quorum‐sensing regulator SdiA of Escherichia coli to control biofilm formation via indole and N‐acylhomoserine lactones. Appl Environ Microbiol. 2009;75:1703–1716. doi: 10.1128/AEM.02081-08. [DOI] [PMC free article] [PubMed] [Google Scholar]
- Leonard P.G., Ono S., Gor J., Perkins S.J., Ladbury J.E. Investigation of the self‐ association and hetero‐ association interactions of H‐NS and StpA from Enterobacteria. Mol Microbiol. 2009;73:165–179. doi: 10.1111/j.1365-2958.2009.06754.x. [DOI] [PubMed] [Google Scholar]
- Lindsey D.F., Mullin D.A., Walker J.R. Characterization of the cryptic lambdoid prophage DLP12 of Escherichia coli and overlap of the DLP12 integrase gene with the tRNA gene argU. J Bacteriol. 1989;171:6197–6205. doi: 10.1128/jb.171.11.6197-6205.1989. [DOI] [PMC free article] [PubMed] [Google Scholar]
- Ma Q., Wood T.K. OmpA influences Escherichia coli biofilm formation by repressing cellulose production through the CpxRA two‐component system. Environ Microbiol. 2009;11:2735–2746. doi: 10.1111/j.1462-2920.2009.02000.x. [DOI] [PubMed] [Google Scholar]
- Madrid C., Balsalobre C., García J., Juárez A. The novel Hha/YmoA family of nucleoid‐associated proteins: use of structural mimicry to modulate the activity of the H‐NS family of proteins. Mol Microbiol. 2007;63:7–14. doi: 10.1111/j.1365-2958.2006.05497.x. [DOI] [PubMed] [Google Scholar]
- Maeda T., Sanchez‐Torres V., Wood T.K. Metabolic engineering to enhance bacterial hydrogen production. Microbiol Biotechnol. 2008;1:30–39. doi: 10.1111/j.1751-7915.2007.00003.x. [DOI] [PMC free article] [PubMed] [Google Scholar]
- Mellies J.L., Barron A.M.S., Carmona A.M. Enteropathogenic and enterohemorrhagic Escherichia coli virulence gene regulation. Infect Immun. 2007;75:4199–4210. doi: 10.1128/IAI.01927-06. [DOI] [PMC free article] [PubMed] [Google Scholar]
- Navarre W.W., McClelland M., Libby S.J., Fang F.C. Silencing of xenogeneic DNA by H‐NS – facilitation of lateral gene transfer in bacteria by a defense system that recognizes foreign DNA. Genes Dev. 2007;21:1456–1471. doi: 10.1101/gad.1543107. [DOI] [PubMed] [Google Scholar]
- Oshima T., Ishikawa S., Kurokawa K., Aiba H., Ogasawara N. Escherichia coli histone‐like protein H‐NS preferentially binds to horizontally acquired DNA in association with RNA polymerase. DNA Res. 2006;13:141–153. doi: 10.1093/dnares/dsl009. [DOI] [PubMed] [Google Scholar]
- Otten L.G., Quax W.J. Directed evolution: selecting today's biocatalysts. Biomol Eng. 2005;22:1–9. doi: 10.1016/j.bioeng.2005.02.002. [DOI] [PubMed] [Google Scholar]
- Paytubi S., Madrid C., Forns N., Nieto J.M., Balsalobre C., Uhlin B.E., Juárez A. YdgT, the Hha paralogue in Escherichia coli, forms heteromeric complexes with H‐NS and StpA. Mol Microbiol. 2004;54:251–263. doi: 10.1111/j.1365-2958.2004.04268.x. [DOI] [PubMed] [Google Scholar]
- Pedersen K., Gerdes K. Multiple hok genes on the chromosome of Escherichia coli. Mol Microbiol. 1999;32:1090–1102. doi: 10.1046/j.1365-2958.1999.01431.x. [DOI] [PubMed] [Google Scholar]
- Perna N.T., Plunkett G., Burland V., Mau B., Glasner J.D., Rose D.J. Genome sequence of enterohaemorrhagic Escherichia coli O157:H7. Nature. 2001;409:529–533. doi: 10.1038/35054089. et al. [DOI] [PubMed] [Google Scholar]
- Pfaffl M.W. A new mathematical model for relative quantification in real‐time RT‐PCR. Nucleic Acids Res. 2001;29:e45. doi: 10.1093/nar/29.9.e45. [DOI] [PMC free article] [PubMed] [Google Scholar]
- Pratt L.A., Kolter R. Genetic analysis of Escherichia coli biofilm formation: roles of flagella, motility, chemotaxis and type I pili. Mol Microbiol. 1998;30:285–293. doi: 10.1046/j.1365-2958.1998.01061.x. [DOI] [PubMed] [Google Scholar]
- Ren D., Bedzyk L.A., Thomas S.M., Ye R.W., Wood T.K. Gene expression in Escherichia coli biofilms. Appl Microbiol Biotechnol. 2004a;64:515–524. doi: 10.1007/s00253-003-1517-y. [DOI] [PubMed] [Google Scholar]
- Ren D., Bedzyk L.A., Ye R.W., Thomas S.M., Wood T.K. Differential gene expression shows natural brominated furanones interfere with the autoinducer‐2 bacterial signaling system of Escherichia coli. Biotechnol Bioeng. 2004b;88:630–642. doi: 10.1002/bit.20259. [DOI] [PubMed] [Google Scholar]
- Rimsky S. Structure of the histone‐like protein H‐NS and its role in regulation and genome superstructure. Curr Opin Microbiol. 2004;7:109–114. doi: 10.1016/j.mib.2004.02.001. [DOI] [PubMed] [Google Scholar]
- Rodríguez S., Nieto J.M., Madrid C., Juárez A. Functional replacement of the oligomerization domain of H‐NS by the Hha protein of Escherichia coli. J Bacteriol. 2005;187:5452–5459. doi: 10.1128/JB.187.15.5452-5459.2005. [DOI] [PMC free article] [PubMed] [Google Scholar]
- Rui L., Kwon Y.M., Fishman A., Reardon K.F., Wood T.K. Saturation mutagenesis of toluene ortho‐Monooxygenase of Burkholderia cepacia G4 for enhanced 1‐Naphthol synthesis and chloroform degradation. Appl Environ Microbiol. 2004;70:3246–3252. doi: 10.1128/AEM.70.6.3246-3252.2004. [DOI] [PMC free article] [PubMed] [Google Scholar]
- Sambrook J., Fritsch E.F., Maniatis T. Cold Spring Harbor Laboratory Press; 1989. [Google Scholar]
- Srividhya K.V., Krishnaswamy S. Sub classification and targeted characterization of prophage‐encoded two‐component cell lysis cassette. J Biosci. 2007;32:979–990. doi: 10.1007/s12038-007-0097-x. [DOI] [PubMed] [Google Scholar]
- Stewart P.S., Franklin M.J. Physiological heterogeneity in biofilms. Nat Rev Microbiol. 2008;6:199–210. doi: 10.1038/nrmicro1838. [DOI] [PubMed] [Google Scholar]
- Tendeng C., Bertin P.N. H‐NS in Gram‐negative bacteria: a family of multifaceted proteins. Trends Microbiol. 2003;11:511–518. doi: 10.1016/j.tim.2003.09.005. [DOI] [PubMed] [Google Scholar]
- Tomlin K.L., Clark S.R.D., Ceri H. Green and red fluorescent protein vectors for use in biofilm studies of the intrinsically resistant Burkholderia cepacia complex. J Microbiol Methods. 2004;57:95–106. doi: 10.1016/j.mimet.2003.12.007. [DOI] [PubMed] [Google Scholar]
- Ueguchi C., Kakeda M., Mizuno T. Autoregulatory expression of the Escherichia coli hns gene encoding a nucleoid protein: H‐NS functions as a repressor of its own transcription. Mol Gen Genet. 1993;236:171–178. doi: 10.1007/BF00277109. [DOI] [PubMed] [Google Scholar]
- Vilain S., Pretorius J.M., Theron J., Brözel V.S. DNA as an adhesin: Bacillus cereus requires extracellular DNA to form biofilms. Appl Environ Microbiol. 2009;75:2861–2868. doi: 10.1128/AEM.01317-08. [DOI] [PMC free article] [PubMed] [Google Scholar]
- Wang X., Kim Y., Wood T.K. Control and benefits of CP4‐57 prophage excision in Escherichia coli biofilms. ISME J. 2009;3:1164–1179. doi: 10.1038/ismej.2009.59. [DOI] [PMC free article] [PubMed] [Google Scholar]
- White‐Ziegler C.A., Davis T.R. Genome‐wide identification of H‐NS‐controlled, temperature‐regulated genes in Escherichia coli K‐12. J Bacteriol. 2009;191:1106–1110. doi: 10.1128/JB.00599-08. [DOI] [PMC free article] [PubMed] [Google Scholar]
- Wood T.K. Molecular approaches in bioremediation. Curr Opin Biotechnol. 2008;19:572–578. doi: 10.1016/j.copbio.2008.10.003. [DOI] [PubMed] [Google Scholar]
- Zhang A., Rimsky S., Reaban M.E., Buc H., Belfort M. Escherichia coli protein analogs StpA and H‐NS: regulatory loops, similar and disparate effects on nucleic acid dynamics. EMBO J. 1996;15:1340–1349. [PMC free article] [PubMed] [Google Scholar]
Associated Data
This section collects any data citations, data availability statements, or supplementary materials included in this article.
Supplementary Materials
Fig. S1. Excision of nine prophages in LB at 37°C upon deleting hns after 15 h (A) and for BW25113 hha hns cells producing H-NS K57N and wild-type H-NS using 1 mM IPTG after 24 h (B). The number of chromosomes was quantified by qPCR using a reference gene, purA, via purA-f and purA-r primers, and the number of chromosomes devoid of prophages was quantified using primers as described in Table S3. Each data point is the average of at least four replicates from each of two independent cultures, and one standard deviation is shown.
Fig. S2. Temporal biofilm formation of Rac deletion mutants. Normalized biofilm formation upon deleting Rac prophage from wild-type BW25113 (WT) and BW25113 hha hns (hha hns) after 32 h in 96-well polystyrene plates in LB at 37°C. Each data point is the average of at least twelve replicate wells from two independent cultures.
Table S1. COMSTAT analysis for flow cell biofilms producing wild-type H-NS and H-NS K57N in LB medium with 1 mM IPTG after 48 h at 37°C.
Table S2. List of differentially expressed genes for biofilm cells of BW25113 hha hns/pC24N hns K57N versus BW25113 hha hns/pC24N hns grown in LB with 30 μg ml−1 chloramphenicol and 1 mM IPTG for 7 h at 37°C. Raw data for the two DNA microarrays are available using GEO series accession number GSE17853. Primarily, genes differentially expressed above 2.7-fold are shown although some related genes are also shown.
Table S3. Primers used for error-prone PCR, cloning, DNA sequencing, confirmation of the mutants, qPCR, and qRT-PCR. Underlined italic text indicates restriction enzyme recognition sites: SalI for hns-SalI-f, HindIII for hns-HindIII-r, and BglI for hns-39G4-f and hns-39G4-r. Underlined bold text indicates the site-directed mutation for the codon corresponding to K57 (5′-AAA to 5′-AAC for K57N) in hns-K57N-f and hns-K57N-r and indicates the saturation mutation of the codon corresponding to K57 (5′-NNS) in hns-K57sm-f and hns-K57sm-r (N is A, G, C or T, and S is G or C).