Abstract
Sarracenia species (pitcher plants) are carnivorous plants which obtain a portion of their nutrients from insects captured in the pitchers. To investigate these plants, we sequenced the transcriptome of two species, Sarracenia psittacina and Sarracenia purpurea, using Roche 454 pyrosequencing technology. We obtained 46 275 and 36 681 contigs by de novo assembly methods for S. psittacina and S. purpurea, respectively, and further identified 16 163 orthologous contigs between them. Estimation of synonymous substitution rates between orthologous and paralogous contigs indicates the events of genome duplication and speciation within the Sarracenia genus both occurred ∼2 million years ago. The ratios of synonymous and non-synonymous substitution rates indicated that 491 contigs have been under positive selection (Ka/Ks > 1). Significant proportions of these contigs were involved in functions related to binding activity. We also found that the greatest sequence similarity for both of these species was to Vitis vinifera, which is most consistent with a non-current classification of the order Ericales as an asterid. This study has provided new insights into pitcher plants and will contribute greatly to future research on this genus and its distinctive ecological adaptations.
Keywords: insectivorous, substitutions rates, transcriptome, Sarracenia, duplication
1. Introduction
Carnivorous plants fascinate both scientists1 and the general public (Audrey Jr. in: Corman, 1960). One carnivorous plant genus is Sarracenia (pitcher plants) which typically grow in highly acidic, nutrient poor soils that are water saturated for at least part of the year, such as bogs, grassy savannas, fens, and similar wetlands. They obtain a portion of their nutrients from prey captured in their pitchers—highly modified tubular leaves. Sarracenia species may digest their prey directly with secreted proteases, phosphatases, and nucleases.2,3 However, one of our focal species, Sarracenia purpurea, hosts a complex food web of bacteria, protozoa, and arthropods that mineralize the prey and release nutrients that are taken up by the plant.4 The other focal species, Sarracenia psittacina, does not host such a food web. Despite the interspecific variability in pitcher form, the flowers of the different species are morphologically quite similar, and they are pollinated by a range of generalist bees and sarcophagid flies;5,6 interspecific hybrids with intermediate morphologies are common in nature and are fertile. A number of the taxa within the genus are considered endangered. As a genus, Sarracenia provides a wealth of opportunities for ecological and evolutionary studies.
Here, we present a comprehensive analysis of the transcriptome (cDNA) of two Sarracenia species (S. psittacina and S. purpurea) obtained by 454 sequencing technology (454 GS FLX). Transcriptome sequencing represents the subset of genes from the genome that are functionally active in a selected tissue and species of interest. In non-model organisms lacking genomic resources, such as sequenced genome, transcriptome study is an effective way to study the gene expression and address comparative genomic-level questions.7,8 Moreover, massive parallelized sequencing technologies have made transcriptome studies, one of the most cost-effective methods for gene discovery,7 even more robust and efficient. 454 sequencing was selected as its sufficiently long-sequence reads can help compensate for the lack of a reference genome during de novo sequence assembly.9
As this is the first set of sequence data for any pitcher plants, we addressed a number of questions in this study ranging from: identifying the events of genome duplication, determining the level of orthology between two species, estimating the substitution rates between the orthologous contigs, and investigating the contigs which show signatures of diversifying natural selection (a non-neutral rate of synonymous and non-synonymous substitutions between sequence pairs). These comparative genomics methods along with genetic mapping, expression profiling, and candidate gene approaches are part of investigating the genetic basis of phenotypic variation.10 We also performed a functional annotation, through gene ontology analysis, of all contigs in order to detect any pattern (biological process, molecular function, and cellular component) which may be unique or predominant to pitcher plants.
2. Materials and methods
2.1. Plant material
Two species of Sarracenia were chosen based on morphology and differences in insect trapping/digestion. Sarracenia purpurea has the widest natural range among all species within the genus. It is found from Mississippi eastward up the entire US east coast. It is also found in all the Great Lake states and throughout the majority of Canada. Natural populations of S. psittacina can be found in all Gulf coast states except Texas and it also has populations in Georgia. Fresh juvenile leaf samples were taken from greenhouse maintained plant stocks. Samples came from identical or very similar cultivars generated from rhizome propagation.
2.2. RNA extraction
After multiple extraction attempts using various kits and other wet lab techniques, a successful protocol was found using the Spectrum Plant Total RNA Kit (Sigma #STRN50-1KT). Only the youngest unopened leaves were used as older tissues yield negligible RNA amounts. Certain steps call for the use of RNase-free water; this was created by adding 0.1 ml of diethylpyrocarbonate to 100 ml of water, incubating at 37°C for 12 h and then autoclaving for 15 min to remove trace amounts of the chemical. All instruments and surfaces were cleaned thoroughly, treated with an RNase deactivating solution (100 mM sodium hydroxide plus 0.1% sodium lauryl sulphate) and wiped dry. The mortar and pestles were frozen with liquid nitrogen for about 20 s prior to the start of tissue and maintained at a subzero temperature throughout tissue grinding to prevent RNA degradation. A single total RNA prep of 100 mg of young leaf tissue yielded on average 4–8 µg of high-quality RNA. The extraction was repeated 40–50 times. We obtained ∼0.25 mg of total RNA for each species.
2.3. mRNA isolation and cDNA generation
The Oligotec mRNA Kit (Qiagen # 70022) was used to purify mRNA from 0.25 mg extracted total RNA, according to the manufacturer's recommendation. During the elution steps, 25 µl of OEB buffer was used in the initial step and 25 µl in the follow-up step for the maximum mRNA concentration in the smallest volume possible. mRNA quality was checked with a Bioanalyzer (Agilent, Inc.) and a NanoDrop 2000 (Thermo Scientific). For cDNA generation, the Evrogen cDNA synthesis kit (SK001) was used with a modification to the kit's 3′ primer. We used ∼26 ng of mRNA for each species.
Normalization of the cDNA was performed using Evrogen Normalization Trimmer Kit (NK001) in order to minimize the repetition of transcripts. This normalization protocol is based on denaturing-reassociation of cDNA, followed by digestion with a duplex-specific nuclease. The single-stranded cDNA fraction was amplified twice by sequential PCR reactions according to the manufacturer's protocol. A Qiagen MiniElut kit (#28006) was used to purify the normalized cDNA and sterile water was used in the final elution in order to prevent the likely interference of TE with 454 processing. Normalized cDNA in 100 µl sterile water was submitted to the Georgia Genomic Facility (www.dna.uga.edu) for 454 sequencing in a Genome Sequencer TM (GS) Titanium FLX instrument (Roche Diagnostics) employing a standard protocol. Sarracenia psittacina and Sarracenia purpurea cDNAs were submitted at a concentration of 49 and 45 ng/µl, respectively.
2.4. Sequence assembly, contig annotation, and ortholog/paralog identification
We called the bases from the sequence data using pyrobayes11 from the 454 sequencer generated sff files. Vector and other contaminants were removed using seqclean (http://compbio.dfci.harvard.edu); assembly of the cleaned reads was performed by MIRA.12 Blast2Go (B2G)13 was used at the default criterion to functionally annotated the contigs. In order to localize the contigs, we obtained Vitis genomic sequences (since this genome had the top hits in blastx searches) and gff files from the phytozome project (http://www.phytozome.net/) and then mapped both the assemblies against the Vitis genome using blat (step size = 11, minScore = 40).14 Orthologous sequences between the two Sarracenia species were predicted using the reciprocal blast (blastn)15 hit method at e-value 1e− 20. This stringent e-value cut-off leads to a higher identification of orthologous as opposed to paralogous sequences. Paralogous sequences were identified by doing all vs all blast (blastn) within the species. Sequences producing a significant alignment over 300 bp and 40% identity were defined as paralogs.16
2.5. Detection of genome duplication and speciation events
The approach used in the detection of genome duplication and speciation event was adapted from Blanc and Wolfe.16 Identified paralogous pairs were organized into gene families using single-linkage clustering. Afterwards, synonymous substitution rates (Ks) were estimated for all possible pairs within a gene family. One potential drawback of measuring the substitution rates from transcriptome data is that multiple entries of the same gene can be present which leads to redundant Ks measures. To minimize this false peak in the Ks distribution plot, we discarded one of the sequence from paralogous pairs with Ks = 0 (assuming that no synonymous substitutions between sequences means they belong to the same gene) and all other Ks values involving that particular sequence. We corrected for multiple Ks comparisons from gene families which contain non-overlapping incomplete sequences by a simple clustering method, as described in Blanc and Wolfe.16
2.6. Estimation of substitution rates
To estimate the synonymous (Ks) and non-synonymous substitutions (Ka) rates between paralogous and orthologous sequences pairs, we first aligned the sequence pairs using tblastx;15 sequences producing significant alignments were extracted using their aligned coordinates and further analysed by translation and then amino acid sequence alignment was performed by Clustalw.17 Only the longest uninterrupted reading frame was used for the analysis. Corresponding codon alignments were produced using PAL2NAL18 and finally rates were estimated using a maximum likelihood method implemented in the CODEML program of the PAML package Version 4.1.19 Pair-wise maximum likelihood analyses were performed in runmode-2. In order to minimize the statistical artefacts which could arise due to short alignments and a saturation of Ks, we further discarded those alignments which are less than 30aa in length and which had Ks >2. The Ks frequency in each interval size of 0.01 within the range [0, 2.0] was plotted.
3. Results
3.1. Sequencing and assembly
The amount of raw sequences obtained was 123 and 88 Mb with a mean raw read length was 249 and 258 bp for S. psittacina and S. purpurea, respectively. Raw sequences were cleaned and assembled into contigs. Since the Sarracenia genome sequence was not available, a de novo assembly of the cDNA sequences was performed. We obtained 46 275 and 36 681 contigs with an N50 value of 479 and 485 for S. psittacina and S. purpurea, respectively. The number of assembled contigs and the mean average coverage per contig were found to be correlated with the number of cleaned reads. The complete assembly statistics are shown in Table 1 and assemblies are available under Supplementary data S1.
Table 1.
Assembly statistics for two Sarracenia species
| Species | Inda | Plateb | Cleaned reads | Cleaned bases (Mb) | Contigs | Singletons | Mean avg coverage per contig | Mean GC per contig (%) |
|---|---|---|---|---|---|---|---|---|
| S. psittacina | 8 | 1/2 | 392 346 | 102 | 46 275 | 587 | 3.40 | 40.84 |
| S. purpurea | 4 | 1/2 | 282 150 | 75 | 36 681 | 234 | 3.05 | 41.14 |
aNumber of individual pooled prior to sequencing.
bOne plate represents a full Roche 454 run.
3.2. Functional annotation of contigs
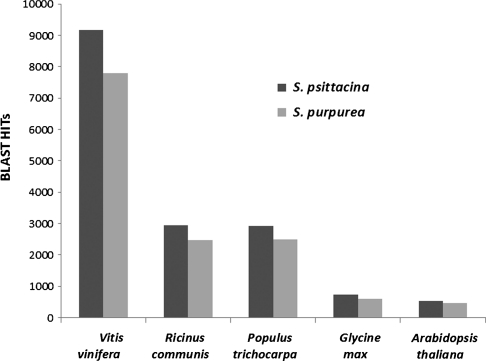
We used B2G to functionally annotate the contigs. The B2G annotation has three steps which involve using blast against the public or private databases, mapping against GO resources, and annotating to generate reliable functional assignments. From our data, 20 920 (45.2%) of the S. psittacina and 17 821 (48.6%) of S. purpurea cDNA sequences were shown to have significant matches to currently known proteins in the NCBI non-redundant protein database. The B2G blast hit bar plot (Fig. 1) shows Vitis, Ricinus, and Populus as the top three species with greatest number of hits for both species. Contigs with the significant blast matches were functionally annotated. We found GO resource assignments for 19.92% and 21.19% of contigs for S. psittacina and S. purpurea, respectively. A summary of B2G mapping is given in Table 2.
Figure 1.
A bar plot showing the hits (blastx top hit) to previously sequenced species (displaying only top five species) for S. psittacina and S. purpurea contigs.
Table 2.
Summary statistics for two Sarracenia species of Blast2GO assignment
| Species | Number of contigs | Number of blast hits | Number of GO mapped | Number of GO termsa | Number of functionally annotated |
|---|---|---|---|---|---|
| S. psittacina | 46 275 | 20 920 | 9222 | 39 500 | 7208 |
| S. purpurea | 36 681 | 17 821 | 7773 | 33 093 | 6060 |
aCan be multiple per contigs.
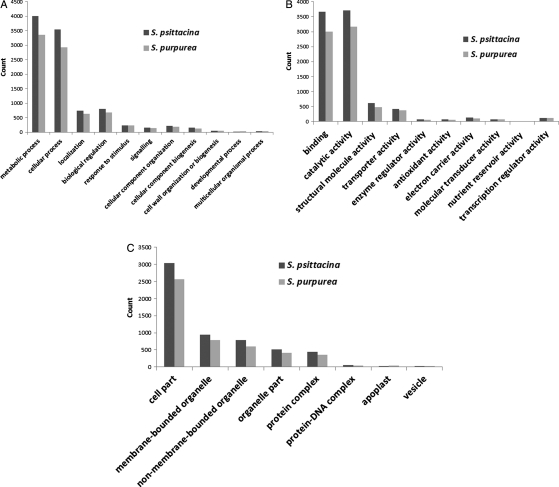
The first major GO division, ‘biological process’, associates contigs with the biological objective to which it contributes.20 Within it, 11 major categories were identified and found to be similarly distributed in both species. The two most abundant categories were: (i) ‘cellular and metabolic processes’, to which 75% of both species’ contigs were associated (S. psittacina: 7543 sequences and S. purpurea: 6285 sequences) and (ii) ‘biological regulation’, to which 8% of contigs were dedicated (S. psittacina: 802 sequences and S. purpurea: 684 sequences) (Fig. 2A).
Figure 2.
A bar plot showing the Blast2GO functional assignments in three GO categories: (A) biological process, (B) molecular function, and (C) cellular component for S. psittacina and S. purpurea contigs.
The second major GO division, ‘molecular function’, links genes to their biochemical activity.20 The contig coverage was again found to be similar for both species. Most of the contigs in the molecular function division were dedicated to binding functions and catalytic activity (82% of both species; S. psittacina: 7367 sequences and S. purpurea: 6170 sequences) (Fig. 2B).
The last GO division is ‘cellular component’, which refers to sub-cellular location where gene product is active.20 In this, eight major categories were identified and again a similar type of coverage was found for both species. Gene products were mainly expressed intracellularly (52% for both species; S. psittacina: 3033 sequences; S. purpurea: 2562 sequences) or in the membrane-bound/non-membrane-bound organelle (29% for both species; S. psittacina: 1730 sequences; S. purpurea: 1386) (Fig. 2C). The complete B2G results are shown in Supplementary Tables S1 and S2.
3.3. Localization of the contigs with respect to genic features
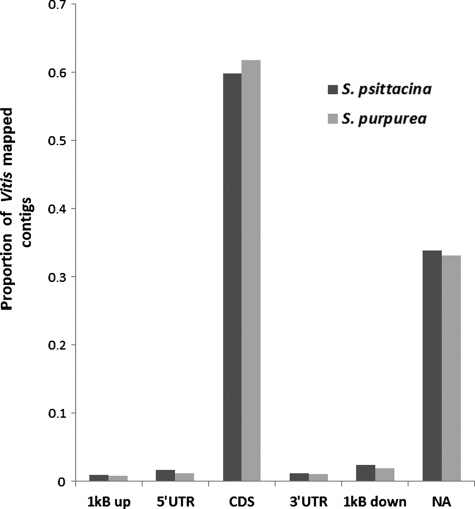
We used the Vitis genome as a reference in order to locate the contigs with respect to genomic sequence. Vitis was the species whose sequences were found as the top hit for sequences from both Sarracenia species in the blast (blastx) search. Blat was used to map the assemblies against the Vitis genome. Sequences uniquely mapped to a particular feature (5′UTR, 3′UTR, CDS, 1 kb up, 1 kb down, and intergenic) were plotted as a bar plot (Fig. 3). A total of 8501 and 7224 contigs were uniquely mapped to features under consideration for S. psittacina and S. purpurea, respectively. Based on the Vitis genome annotation, nearly 60% of the mapped contigs were found to be in CDS regions and 33% of the contigs were associated with the putative intergenic region (shown as NA in the figure). Only a very tiny fraction of the contigs were mapped to 5′UTR/3′UTR and regions 1 kb upstream/1 kb downstream of them.
Figure 3.
A bar plot displaying the proportion of contigs mapped to a particular region of Vitis genome in two species.
3.4. Orthologous and paralogous contigs
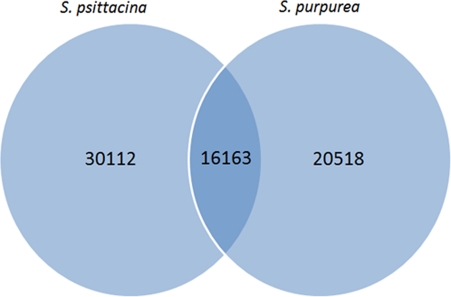
We identified 16 163 pairs of orthologous contigs by the reciprocal best blast hit approach; this approach has been found superior to more sophisticated orthology detection algorithms.21 We used a stringent e-value cutoff (1e −20) in order to separate the paralogous sequences from the orthologous sequences. A total of 8706 orthologous contigs matched to open reading frames of known or putative proteins. The Venn diagram indicating the orthologous and unique contigs is shown in Fig. 4. We also identified 18 296 and 9565 paralogs pairs by all vs all blast (blastn); these were organized into 2555 and 1708 gene families by a single linkage clustering method for S. psittacina and S. purpurea, respectively.
Figure 4.
A Venn diagram showing the count of orthologous and unique contigs between two species.
3.5. Estimation of Ka and Ks
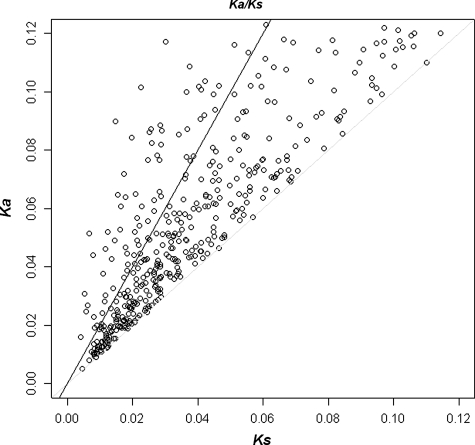
We calculated the Ka and Ks values for 10 715 orthologous contigs and their ratio for 4810 contigs (a Ks = 0 made the ratio incalculable for some of the contigs). Similarly, we estimated the Ks value for each of the paralogous pairs. We further studied substitution rates and GO categorization within the orthologous contigs only. Out of these 4810 contigs, we were able to find the functional annotation for 3444 contigs. We identified 491 contigs which are under diversifying selection Ka/Ks ≥ 1 (Fig. 5). Most of these contigs were found to be involved in the molecular function related to nucleotide binding. The complete Ka/Ks result for 3444 contigs is shown in Supplementary Table S3.
Figure 5.
A scatter plot of the Ka/Ks ratio for 491 orthologous contigs under diversifying selection. Contigs with Ka/Ks > 1 fall above the light grey line and >2 values fall above the black line.
3.6. Genome duplication and speciation
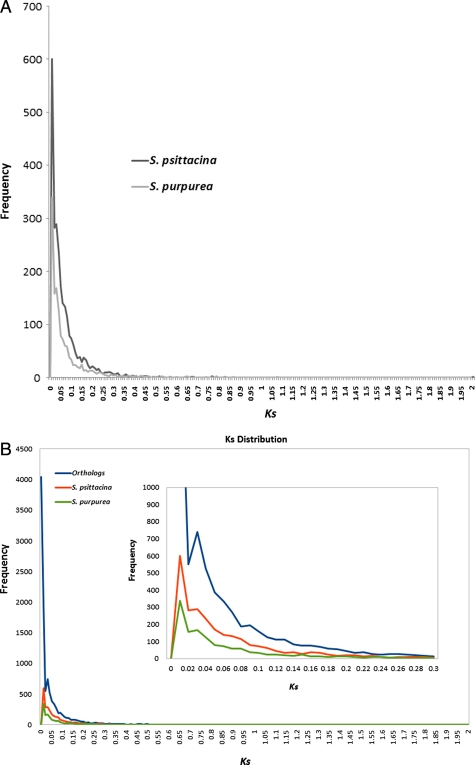
From the estimation of synonymous substitution rates, we were able to find signatures of genome duplication within both S. psittacina and S. purpurea. The Ks value distribution for both species is shown in Fig. 6A. The secondary peak in the paralogous Ks distribution plot indicates a genome duplication event.16 The estimated Ks value between orthologous pairs was also plotted along with paralogous (Fig. 6B). The secondary peak in the orthologous Ks value distribution indicates the speciation events. The number of sequences involved in the genome duplication events and gene family statistics are shown in Table 3. Considering a clock-like rates of synonymous substitution of 1.5 × 10⁻⁸ substitutions/synonymous site/year for dicots,22 we estimated the age of these events and found that they are fairly recent [∼2 million years (myr) for both duplication and speciation]. The purpose of these estimates is just to give an idea of the time scale involved because they are certainly highly approximate.
Figure 6.
Ks value distribution between the two Sarracenia species for the identification of the genome duplication event and the speciation event. (A) The secondary peak (Ks = 0.03) in the paralogous Ks distribution indicates the genome duplication. (B) The secondary peak (Ks = 0.03) in the orthologous Ks distribution give the indication of speciation event.
Table 3.
Number of sequences and paralogs found for S. psittacina and S. purpurea
| Species | Number of contigs | Number of paralogs pairs | Percentage of paralogs | Gene families | Gene family size | Duplication event with mean Ks |
|---|---|---|---|---|---|---|
| S. psittacina | 46 275 | 18 296 | 39.53 | 2555 | 3.53 | 2635 |
| S. purpurea | 36 681 | 9565 | 26.07 | 1708 | 3.46 | 1417 |
4. Discussion
We generated the 46 275 and 36 681 contigs by pyrosequencing for S. psittacina and S. purpurea, respectively, using young pitchers as the starting material. We normalized our cDNA library in order to maximize coverage of transcripts and prevent biases due to highly expressed transcripts. Based upon the sequence similarity searches, we found Vitis to have the greatest number of hits to contigs from both species. This is an interesting result since Sarracenia is currently considered to belong to the order Ericales which is a part of clade asterids, whereas Vitis belongs to clade rosids (http://www.mobot.org/mobot/research/apweb/). The expectation might have been that an extensively sequenced asterid such as Lycopersicon would have had the greatest number of blast hits, rather than a rosid. To test the statistical significance of this result, we divided the species with the top 20 number of blast (blastx) hits into two parts based upon their phylogenetic position in asterids and rosids and performed a t-test of significance (two-sample t-test for unequal variances, one-tail t-statistics t(6) = 1.943180274, P∼0.05 for the S. psittacina sequences, with a similar result for the S. purpurea sequences). The t-test shows that the observed difference is significant. Relationships among familial clades in the order Ericales have been considered as problematic23 and Ericales was placed in the clade dilleniidae in the previous classifications.24 Our results are thus consistent with the original placement of the Ericales, as being closer to rosids than asterids.
Since a genomic sequence is not available for any pitcher plants, we used the Vitis genome as a reference for contig localization. About 60% of contigs aligned uniquely to the protein coding regions of Vitis genome in both species. The nearly equal coverage in 5′UTR and 3′UTR regions showed the success of the protocol in full-length cDNA construction. We also found a number of contigs belong to intergenic regions based upon the Vitis genome annotation. As the Vitis genome annotation is still not finished and many more genes have yet to be identified, it is possible that contigs currently localized in intergenic regions might be as-yet unidentified protein-coding genes, or they might be non-coding RNA genes or alternatively spliced exons. To test this, we took the contigs belonging to intergenic regions and checked whether they had similarity to any known or hypothetical protein. Out of 1773 putative intergenic sequences of S. psittacina, 1280 sequences had shown similarity (≥1e −5) to known/hypothetical proteins. We also obtained ncRNA sequences for Arabidopsis and Oryza from ncRNA database25 and mapped our intergenic sequences against them. Only few sequences had showed similarity to known ncRNA. Similar patterns were obtained from S. purpurea. The detailed mapping results are shown in Supplementary Table S4.
The paired pattern in functional annotation for all three GO divisions reflects that our library and 454 sequencing covered the transcriptome of the two species equally well. We can speculate about the significance of the GO annotations relative to the pitcher plant insectivorous adaptations. In the biological process and molecular function division, an abundance of genes were found to be related with metabolic process and catalytic activity and inside the metabolic process and catalytic activity, a number of genes were found related to macromolecule metabolic process and hydrolase activity (Supplementary Figs S1A, B and S2A, B). The hydrolytic enzymes (protease, RNase, nuclease, phosphatase) may be required for the digestion of prey.26 The pitchers of pitcher plants may contain water with microorganisms; a high level of hydrolytic enzymes in the pitcher plant transcriptome may favour the hypothesis that pitcher plants do not rely solely on microorganisms to digest their insect prey.27 More detailed information about Sarracenia, its prey-digestion system and its microbial food web, can be found in a review by Ellison et al.28
Previously, we estimated the genome sizes (25% more nuclear DNA than maize) of these two species29 and based on that, we expected that the species might be polyploid. To test our hypothesis, we estimated the substitution rate for all the paralogous contigs showing a significant sequence similarity at protein level and plotted the Ks value distribution histogram. We were able to detect a moderate signature of a duplication event within this data set. Time estimates suggest that these events were fairly recent. The lack of clear secondary peaks can be attributed to the fact that signal of this event, provided it is relatively recent, is not dissociable from the initial peak. The orthologous contig comparison secondary peak is in the same time frame as the ortholog/paralog duplication peak. Possibly speciation within the genus Sarracenia might have occurred after the duplication event, which is a well-recognized pattern of plant evolution.30
A substitution rate within the orthologous contigs (identified by reciprocal blast) found 491 contigs having the Ka/Ks ratio ≥1. This ratio is considered to be a good measure of selective pressure acting at the sequence level31,32 and has been used in different studies to identify the contigs under positive/adaptive evolution (Ka/Ks > 1) or under negative/purifying selection (Ka/Ks < 1).33 The majority of contigs under diversifying selection were found to be related to binding activity in the molecular function category of GO assignment (Supplementary Table S3).
In summary, our analysis showed a high degree of similarity in sequence existed between the pitcher plants, with Vitis as the model species outside the genus with the greatest sequence similarity. Functional annotation of all the contigs showed the major categories of genes that exist, and the substitution rate estimation identified the signatures of genome duplication and rapidly evolving genes in the pitcher plants. We believe that these sequences and analysis will greatly aid the research community working on insectivorous plants and their ecology.
4.1. Availability
The data from the experiments described in this work are available from the NCBI Sequence Read Archive at http://www.ncbi.nlm.nih.gov/sra under the accessions SRP006675 and SRP006677.
Supplementary data
Supplementary Data are available at www.dnaresearch.oxfordjournals.org.
Funding
We gratefully acknowledge support from NSF grant IIS 0916250 to L.C. and from the University of Georgia Franklin College of Arts & Science's research fund.
Supplementary Material
References
- 1.Darwin C. Insectivorous Plants. London: Murray; 1875. [Google Scholar]
- 2.Hepburn J.S., John E.Q.S., Jones F.M. The absorption of nutrients and allied phenomena in the pitchers of the Sarraceniaceae. J. Franklin Inst. 1920;189:147–84. [Google Scholar]
- 3.Gallie D.R., Chang S.C. Signal transduction in the carnivorous plant Sarracenia purpurea—regulation of secretory hydrolase expression during development and in response to resources. Plant Physiol. 1997;115:1461–71. doi: 10.1104/pp.115.4.1461. [DOI] [PMC free article] [PubMed] [Google Scholar]
- 4.Gotelli N.J., Ellison A.M. Food-web models predict species abundances in response to habitat change. Plos Biol. 2006;4:1869–73. doi: 10.1371/journal.pbio.0040324. [DOI] [PMC free article] [PubMed] [Google Scholar]
- 5.Schnell D.E. Notes on the pollination of Sarracenia-Flava L (Sarraceniaceae) in the Piedmont Province of North-Carolina. Rhodora. 1983;85:405–20. [Google Scholar]
- 6.Ne'eman G., Ne'eman R., Ellison A.M. Limits to reproductive success of Sarracenia purpurea (Sarraceniaceae) Am. J. Botany. 2006;93:1660–6. doi: 10.3732/ajb.93.11.1660. [DOI] [PubMed] [Google Scholar]
- 7.Bouck A., Vision T. The molecular ecologist's guide to expressed sequence tags. Mol. Ecol. 2007;16:907–24. doi: 10.1111/j.1365-294X.2006.03195.x. [DOI] [PubMed] [Google Scholar]
- 8.Hudson M.E. Sequencing breakthroughs for genomic ecology and evolutionary biology. Mol. Ecol. Res. 2008;8:3–17. doi: 10.1111/j.1471-8286.2007.02019.x. [DOI] [PubMed] [Google Scholar]
- 9.Rokas A., Abbot P. Harnessing genomics for evolutionary insights. Trends Ecol. Evol. 2009;24:192–200. doi: 10.1016/j.tree.2008.11.004. [DOI] [PubMed] [Google Scholar]
- 10.Ellegren H., Sheldon B.C. Genetic basis of fitness differences in natural populations. Nature. 2008;452:169–75. doi: 10.1038/nature06737. [DOI] [PubMed] [Google Scholar]
- 11.Quinlan A.R., Stewart D.A., Stromberg M.P., Marth G.T. Pyrobayes: an improved base caller for SNP discovery in pyrosequences. Nat. Methods. 2008;5:179–81. doi: 10.1038/nmeth.1172. [DOI] [PubMed] [Google Scholar]
- 12.Chevreux B., Pfisterer T., Drescher B., et al. Using the miraEST assembler for reliable and automated mRNA transcript assembly and SNP detection in sequenced ESTs. Genome Res. 2004;14:1147–59. doi: 10.1101/gr.1917404. [DOI] [PMC free article] [PubMed] [Google Scholar]
- 13.Conesa A., Götz S., Garcia-Gomez J.M., Terol J., Talon M., Robles M. Blast2GO: a universal tool for annotation, visualization and analysis in functional genomics research. Bioinformatics. 2005;21:3674–6. doi: 10.1093/bioinformatics/bti610. [DOI] [PubMed] [Google Scholar]
- 14.Kent W.J. BLAT—the BLAST-like alignment tool. Genome Res. 2002;12:656–64. doi: 10.1101/gr.229202. [DOI] [PMC free article] [PubMed] [Google Scholar]
- 15.Altschul S.F., Madden T.L., Schaffer A.A., et al. Gapped BLAST and PSI-BLAST: a new generation of protein database search programs. Nucleic Acids Res. 1997;25:3389–402. doi: 10.1093/nar/25.17.3389. [DOI] [PMC free article] [PubMed] [Google Scholar]
- 16.Blanc G., Wolfe K.H. Widespread paleopolyploidy in model plant species inferred from age distributions of duplicate genes. Plant Cell. 2004;16:1667–78. doi: 10.1105/tpc.021345. [DOI] [PMC free article] [PubMed] [Google Scholar]
- 17.Larkin M.A., Blackshields G., Brown N.P., et al. Clustal W and clustal X version 2.0. Bioinformatics. 2007;23:2947–8. doi: 10.1093/bioinformatics/btm404. [DOI] [PubMed] [Google Scholar]
- 18.Suyama M., Torrents D., Bork P. PAL2NAL: robust conversion of protein sequence alignments into the corresponding codon alignments. Nucleic Acids Res. 2006;34:W609–12. doi: 10.1093/nar/gkl315. [DOI] [PMC free article] [PubMed] [Google Scholar]
- 19.Yang Z. PAML 4: phylogenetic analysis by maximum likelihood. Mol. Biol. Evol. 2007;24:1586–91. doi: 10.1093/molbev/msm088. [DOI] [PubMed] [Google Scholar]
- 20.The Gene Ontology Consortium. Gene ontology: tool for the unification of biology. Nat. Genet. 2000;25:25–9. doi: 10.1038/75556. [DOI] [PMC free article] [PubMed] [Google Scholar]
- 21.Altenhoff A.M., Dessimoz C. Phylogenetic and functional assessment of orthologs inference projects and methods. PLoS Comput. Biol. 2009 doi: 10.1371/journal.pcbi.1000262. 5, e1000262. doi:10.1371/journal.pcbi.1000262. [DOI] [PMC free article] [PubMed] [Google Scholar]
- 22.Koch M.A., Haubold B., Mitchell-Olds T. Comparative evolutionary analysis of chalcone synthase and alcohol dehydrogenase loci in Arabidopsis, Arabis, and related genera (Brassicaceae) Mol. Biol. Evol. 2000;17:1483–98. doi: 10.1093/oxfordjournals.molbev.a026248. [DOI] [PubMed] [Google Scholar]
- 23.Judd S.W., Olmstead G.R. A survey of tricolpate (eudicot) phylogenetic relationships. Am. J. Botany. 2004;91:1627–44. doi: 10.3732/ajb.91.10.1627. [DOI] [PubMed] [Google Scholar]
- 24.Soltis S.P., Soltis E.D. The origin and diversification of angiosperms. Am. J. Botany. 2004;91:1614–26. doi: 10.3732/ajb.91.10.1614. [DOI] [PubMed] [Google Scholar]
- 25.Mituyama T., Yamada K., Hattori E., et al. The functional RNA Database 3.0: databases to support mining and annotation of functional RNAs. Nucleic Acids Res. 2009;37:D89–92. doi: 10.1093/nar/gkn805. [DOI] [PMC free article] [PubMed] [Google Scholar]
- 26.Gallie D.R., Chang S.C. Signal transduction in the carnivorous plant Sarracenia purpurea. Regulation of secretory hydrolase expression during development and in response to resources. Plant Physiol. 1997;115:1461–71. doi: 10.1104/pp.115.4.1461. [DOI] [PMC free article] [PubMed] [Google Scholar]
- 27.Rosa A.B., Malek L., Qin W. The development of the pitcher plant Sarracenia purpurea into a potentially valuable recombinant protein production system. Biotechnol. Mol. Biol. Rev. 2009;3:105–10. [Google Scholar]
- 28.Ellison A.M., Gotelli N.J., Brewer J.S., et al. The evolutionary ecology of carnivorous plants. Adv. Ecol. Res. 2003;33:1–74. [Google Scholar]
- 29.Rogers L.W., Cruse-Sanders M.J., Determann R., Malmberg L.R. Development and characterization of microsatellite markers in Sarracenia L. (pitcher plant) species. Conserv. Genet Resou. 2010;2:75–9. doi: 10.1007/s12686-009-9165-x. [DOI] [PMC free article] [PubMed] [Google Scholar]
- 30.Wood T.E., Takebayashi N., Barker M.S., Mayrose I., Greenspoon P.B., Rieseberg L.H. The frequency of polyploid speciation in vascular plants. Proc. Natl Acad. Sci. USA. 2009;106:13875–9. doi: 10.1073/pnas.0811575106. [DOI] [PMC free article] [PubMed] [Google Scholar]
- 31.Yang Z., Bielawski J.P. Statistical methods for detecting molecular adaptation. Trends Ecol. Evol. 2000;15:496–503. doi: 10.1016/S0169-5347(00)01994-7. [DOI] [PMC free article] [PubMed] [Google Scholar]
- 32.Bustamante C.D., Fledel-Alon A., Williamson S., et al. Natural selection on protein-coding genes in the human genome. Nature. 2005;437:1153–7. doi: 10.1038/nature04240. [DOI] [PubMed] [Google Scholar]
- 33.Hurst L.D. Evolutionary genomics and the reach of selection. J. Biol. 2009;8:12. doi: 10.1186/jbiol113. [DOI] [PMC free article] [PubMed] [Google Scholar]
Associated Data
This section collects any data citations, data availability statements, or supplementary materials included in this article.


