Abstract
Despite considerable efforts, description of molecular shape is still largely an unresolved problem. Given the importance of molecular shape in the description of spatial interactions in crystals or ligand-target complexes, this is not a satisfying state. In the current work, we propose a novel application of alpha shapes to the description of the shapes of small molecules. Alpha shapes are parameterized generalizations of the convex hull. For a specific value of α, the alpha shape is the geometric dual of the space-filling model of a molecule, with the parameter α allowing description of shape in varying degrees of detail. To date, alpha shapes have been used to find macromolecular cavities and to estimate molecular surface areas and volumes. We developed a novel methodology for computing molecular shape characteristics from the alpha shape. In this work, we show that alpha-shape descriptors reveal aspects of molecular shape that are complementary to other shape descriptors, and that accord well with chemists’ intuition about shape. While our implementation of alpha-shape descriptors is not computationally trivial, we suggest that the additional shape characteristics they provide can be used to improve and complement shape-analysis methods in domains such as crystallography and ligand-target interactions. In this communication, we present a unique methodology for computing molecular shape characteristics from the alpha shape. We first describe details of the alpha-shape calculation, an outline of validation experiments performed, and a discussion of the advantages and challenges we found while implementing this approach. The results show that, relative to known shape calculations, this method provides a high degree of shape resolution with even small changes in atomic coordinates.
Keywords: alpha shapes, cheminformatics, molecular descriptors, molecular shape, small-molecule conformation
Introduction
In cheminformatics research, it is of significant importance to characterize, analyze, and predict properties that describe the shape of molecules.1 This is particularly true in cases of molecular interactions, such as in the solid state of homogeneous materials where molecular interactions determine properties such as melting points.2,3 More important for this study are heterogeneous environments where the shape of two distinct molecular entities, usually a small-molecule ligand and the cavity of a protein target, are relevant for molecular recognition.4 While shape is a crucial component of such intermolecular interactions (the other important aspect being the type of property the molecule exhibits at each point in space, such as its electrostatic properties5–7), methods to describe molecular shape concisely are still not ideal. The main problems derive from the fact that shape descriptions must be translationally and rotationally invariant, and that molecular shape is rather difficult to describe due to inherent conformational flexibility.5
During the last twenty years, a variety of molecular shape descriptions have been devised. An early shape description was implemented in the CoMFA (comparative molecular field analysis) algorithm,8 which describes molecules by steric and electrostatic fields, but requires time-consuming alignment of molecules. While the evaluation of electrostatic and shape similarity at pre-defined grid points takes considerable time to evaluate (particularly in combination with quantum-mechanical electron distributions), the introduction of Gaussian functions for the calculation of both shape and electrostatic similarity eases this computational burden and speeds up CoMFA analysis considerably.9,10 However, alignment of molecules still proves to be a cumbersome step. As a result, so-called “alignment-free” molecular descriptions were developed, in which the density function of a molecular property at a fixed distance (but not a fixed coordinate) from a different point of the molecule is calculated. Early methods included autocorrelations of surface properties,11 descriptors based on mapping atom properties to molecular surfaces (“MaP” descriptors)12, and development of radial distribution functions for all combinations of surface properties.12 More recently, “recycling” of alignments13 was proposed to speed up shape comparisons while giving better than 80% “hit” list overlap with a ROCS (Rapid Overlay of Chemical Structures) alignment procedure (OpenEye Scientific Software; Santa Fe, NM).
Analogous to 2D fragment-based fingerprints, a variety of 3D shape fingerprints were developed based on different assumptions. By using a “reference shape library” of several thousand molecules,14 a molecule can be represented by its similarity (measured as overlap above a threshold using Gaussian functions) to the reference panel—the result is a bit-string describing the new shape. A method termed “ultra-fast shape recognition” (USR)15 exploited the fact that not all pairwise atomic center distances need be used to describe shape. USR calculates all atomic distances from just four predefined molecular locations: the molecular centroid, the closest atom to the centroid, the farthest atom from the centroid (termed “fct”), and the farthest atom from fct. These locations represent the center of the molecule and its extremes. Each set of distances is then characterized as a histogram and first through third moments calculated. Thus, each molecule is described by 3 moments from 4 distance histograms, enabling descriptor calculation for thousands of molecules per second and shape comparisons for millions of molecule pairs in seconds on a single CPU. This 3D USR descriptor was used in combination with conventional MACCS keys, which are a binary presence/absence description of 2D molecular fragments.16 The resulting MACCS/USR hybrid descriptors outperformed pure USR descriptors in a series of retrospective virtual screening experiments.16 This result underlines the importance of using different descriptor spaces—both 2D and 3D—that capture different aspects of molecular structure.
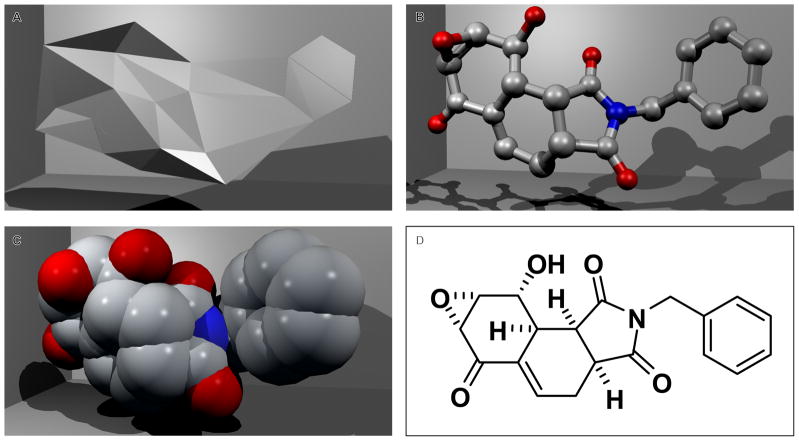
Given that existing descriptions of molecular shape are not ideal (both in the sense of predictive power of a shape-derived property and their practical ease of handling), we propose a novel application and characterization of alpha shapes17 to the description of small molecules. Alpha shapes, which are parameterized (α) generalizations of the convex hull, were originally conceived of in two dimensions17,18 and later expanded to three dimensions.19 As α approaches infinity the alpha shape is identical to the convex hull. As α decreases the shape shrinks by developing concavities and voids. As α approaches zero the alpha shape is the original point set S, and for other values intermediate shapes are formed. Each point set S will have a finite set of α describing all the alpha shapes in the alpha complex of S. An intuitive notion is to think of α as the radius of a sphere centered on each member of S (for example see, Edelsbrunner et. al.20). An interesting observation occurs when α corresponds to the spheres of a space filling model. In this case (formally applicable only to hydrocarbons) the alpha shape is said to be the geometric dual of the space-filling model. That is, if α corresponds to the radii of a set of spheres in the space-filling model, the information contained in the alpha shape can be used to exactly describe the union of spheres—it is a geometric dual. This relationship can be exploited in chemistry by considering relationships between the alpha-shape, ball-and-stick, space-filling model, and chemical graph representations (Figure 1).
Figure 1. Visual representations of structure.
Four different representations of the same structure illustrating the relationship of alpha shapes to other methods of small-molecule structure depiction (hydrogen-suppressed): A) alpha shape, B) ball-and-stick model, C) space-filling model, D) hydrogen-suppressed molecular graph.
The notion of alpha shapes is a formalization of the intuitive notion of “shape” for spatial point sets. An alpha shape is a concrete geometric model which is mathematically well defined and unique for a given point set. This stands in contrast to other methods, such as isosurfaces and accessible surface area, which are approximations and dependent upon sets of poorly defined variables. Thus far, alpha shapes have been used in many diverse disciplines. Visualization of the relationships among data points in 2D and 3D is often a first stage of statistical inference. To this end, alpha shapes have been employed to visualize the irregular shape boundaries of clusters in 3D.21 Other researchers22 used alpha shapes to visualize and characterize some simple properties of Brownian motion paths and concluded that alpha shapes are an effective tool to measure the mass of a diffusing particle. In perhaps one of the most common applications of alpha shapes, a number of researchers in computer graphics developed methods to improve surface reconstruction from finitely sampled points.23–26 In the field of solid mechanics, alpha shapes have been used to improve surface interpolation by avoiding linear displacement fields along convex boundaries.27 Alpha shapes also provide more accurate linear interpolation over non-convex boundaries.28 More recently, in the area of image segmentation, alpha shapes have been used to reconstruct boundaries from noisy, or otherwise non-optimal image segmentations.29 With respect to experiments at the atomic level (as in this study), Zomorodian and coworkers30 used alpha shapes to improve protein structure prediction with statistical potentials. These methods are computationally expensive due to the large number of atomic interactions, and alpha shapes were used to filter the list of interacting atoms in a protein. The researchers concluded that filtering the dataset down to just 12.8% of the original resulted in scoring functions that were competitive with those derived from the full dataset. Alpha shapes have also been used to study protein structures,31 pockets,32,33 surface area and volume,34 and packing.35 Relying on previous studies that characterized irregular pockets, voids, and depressions,32 Liang and coworkers35 examined the notion of packing in proteins. They found that proteins resemble randomly packed spheres rather than a jig-saw puzzle. With cavities and voids in the protein core contributing to densities that are not homogeneous. Further, by looking at proteins of various sizes, they concluded that small proteins are denser than larger ones.
In this communication, we present our reference compound data and descriptor sets. We then explain the preprocessing methods that are necessary for using alpha shapes to calculate molecular shape using a joint density between alpha-shape facet normals and facet distances, a method we term alpha-shape joint density (AJD). This exposition is followed by a description of how we calculate distance between molecular AJD using the Earth-Mover’s Distance (EMD),36,37 both among all pairwise shape representations and to two a priori shapes. When taken alone, our results show that the AJD method is keenly sensitive to molecular shape, but we believe that a complete representation of small molecules can only result as a combination of descriptors.
Methods
Reference compound collections
To investigate the behavior of alpha shapes for molecular shape description, we used three sets of compounds. One set comprises multiple conformers of each of the 16 structural isomers of octane (OCT; see Supplementary Table S1), with increasing alkyl-branching and decreasing number of rotatable bonds. For each isomer, we used the Molecular Operating Environment (MOE 2007.09; Chemical Computing Group; Montreal, QC, CA) to build a conformational pool by systematically varying each rotatable bond by 60° torsional increments (Supplementary Table S2). Resulting conformers were energy minimized using a three-step free-energy minimization procedure.38 To reduce the total number of conformers per isomer while keeping maximum conformational coverage, we first filtered using the torsional space, binning each rotatable bond into 40° torsions per angle and selecting conformations representative of each unique combination of torsion angles for each molecule. To eliminate identical conformers related by symmetry, we superposed all torsional bin representatives and eliminated duplicates using pairwise RMSD among the atomic coordinates. For the figures presented in this study, we focused on four octanes, including one enantiomeric pair, sharing a terminal tert-butyl function (2,2-dimethylhexane (5), 2,2,4-trimethylpentane (13), (R)-2,2,3-trimethylpentane (12), and (S)-2,2,3-trimethylpentane (12*)), and representing a total of 37 unique conformations. This small collection allows us to explore relatively small topological and conformational changes in a closely related set of compounds. The second set is a collection of 388 known biologically active (BIO) compounds with a large number of potential shapes to compare.39 In addition, we used a diverse set of 22,831 compounds from ChemBank from several synthetic and natural sources for algorithm development. These compounds represent several sources and synthetic methods including natural products, commercial vendor libraries, and products resulting from diversity-oriented organic syntheses.40 We performed filtering on the two latter compound collections by removing compounds with metals, compounds with fewer than 6 heavy atoms, and those for which no stable conformation could be generated. These filtering steps resulted in the final numbers of compounds indicated in the Figures and Figure Legends.
Reference descriptor sets
For comparative descriptor sets, we used published methods and commercially available software. First, we implemented a normalized principal moments-of-inertia (PMIs) ratio method.41 To do this, we calculated the ratios of the smallest and medium eigenvalues of the diagonalized mass tensor to the largest (i.e., X = Ismall/Ilarge, Y = Imedium/Ilarge). The Y coordinate of these ratios was then scaled by to produce an equilateral PMI space, allowing meaningful Euclidean distances between compounds to be computed in the resulting PMI space. Second, we implemented a recently published descriptor termed Ultrafast Shape Recognition (USR).15 Third, we calculated the functional class fingerprints (FCFP6s; Pipeline Pilot/Accelrys 7.0.1; San Diego, CA; USA), which are amenable to Tanimoto similarity analysis.42,43 Finally, we calculated the descriptors from MOE (Molecular Operating Environment 2007.09; Chemical Computing Group, Montreal, Quebec, Canada) listed in Supplementary Table 3. These latter descriptors were individually correlated using Kendall’s Tao44,45 with the EMD of each compound to a set of reference shape priors (vide infra). Calculation of PMI, USR, and Tanimoto distances, hierarchical clustering, and statistical analysis were performed in MATLAB R2008s (version 7.6.0.324; The MathWorks; Natick, MA; USA).
Alpha-shape facet and surface normal calculation
Starting from a structure-data format (SDF) file representing the 22,831 diverse ChemBank compounds (vide supra), we extracted the 3D molecular coordinates, and calculated the alpha-shape indices. These indices are triplets which indicate each facet of the surface of the alpha-shape. We used code provided in the Computational Geometry Algorithms Library (CGAL 3.3.1)46 to calculate each alpha shape. This library provides the option to select from all possible values of α the one α that is optimal for a given S. This optimal value is the smallest α within all α’s that constrain all points in S to the interior or the surface of the alpha shape, leaving no disjoint members of S. With the resultant facets comprising the surface, we calculated normal vectors for each facet across the entire shape. However, one problem with this approach is that the indices for facet construction are returned with arbitrary handedness. To resolve this problem we used ray-tracing and the parity of intersections to determine which side of each facet is facing “outward.” This method resolved the handedness of 99.3% of the facet normals. The remaining 0.7% of facets have ambiguous parity information (e.g., 1/1, 2/2, etc.). To assign correct handedness for these remaining ambiguous facets, we examined the parity of their intersecting facets. With parity and location information—in front or behind—a vote on the handedness of the ambiguous facet was cast. When all intersecting facets were examined, the final tally of votes was used to set the handedness. With this method we unambiguously resolved 85% of the 0.7%, thus 0.105% of total facets remained unresolved. This is an exceedingly small number given that these remaining facets are spread over a large number of compounds. Thus, the occurrence of more than one unresolved facet within one compound is small. A final class of facets that we addressed was planar facets, i.e., parts or whole compounds that have no 3D volume. These facets were detected in two ways: facets whose ray-tracing parity revealed no intersections and facets with only two of three sides connected. We address these facets by including a surface normal on both sides. In the analysis stage we include only the one normal that satisfies a minimization of change in angle between the two normals.
Joint densities of distance and surface normal orientation
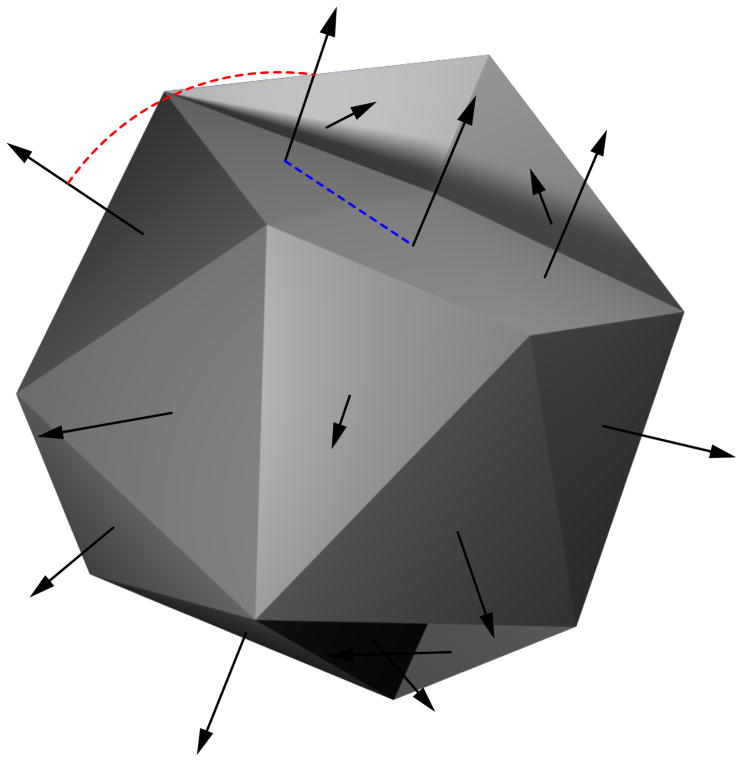
Once the surface normals were resolved for handedness, we used them—in conjunction with distance information—to calculate the shape of each compound. With every facet as a starting point, we calculated the Euclidean distance to all other facets using the facet inter-centroid distances. Ranking these distances, we then calculated the angle between facet normals, expressing change in orientation in terms of change in distance (Figure 2). The result is a bivariate dataset with sorted distances and each change in orientation (ΔΘ). Similar analyses in 2D have been conducted on image contours.47 To characterize the relationship between distance and orientation change, we generated the joint probability function with 24 fixed bins for orientation and 24 variable bins for distance. Allowing the bin centers to vary with distance gives the method a large degree of size independence, which is an intended consequence of this choice. Each location in this 24x24 matrix represents the probability of two events occurring simultaneously. For example, each location in the joint density represents a unique probability of the combined change in orientation at a given distance.
Figure 2. Calculating relationships between distance and facet orientation change.
A simple small-molecule alpha shape with surface normals. Distance (broken blue trace) and angle change (broken red trace) for each pair of surface normals is calculated. Joint probability distributions are calculated based on all distance and angle change pairs.
Similarity between small-molecule joint densities using EMD
To determine the similarity/dissimilarity among the joint-probability functions we used a method termed Earth-Mover’s Distance (EMD).36,37 With this method, the transportation simplex between two distributions is solved for a given “ground distance.” The amount of work required to move one distribution to match the other is the EMD. Traditionally, EMD has been computationally too expensive to use in all but very size-limited datasets. However, Ling and Okada48 recently developed a tree-based algorithm that uses L1 (i.e., city-block or Manhattan) ground distance which they termed EMD-L1. In our implementation (MATLAB mex) of the original algorithm37 a single EMD comparison in our configuration takes 1.41 seconds. Our current implementation of the source C++ code,48 as a loadable library in MATLAB for Windows, has reduced this to 0.005 seconds per comparison. This is a decrease of 282-fold in compute time, and allows us to make very large numbers of comparisons. With the calculated distances we then performed hierarchical clustering to determine which groups of shapes can be resolved by this method.
Similarity of small-molecules to reference shape priors
With this method we were also able to employ a second level of shape analysis. We followed the lead of previous researchers41 in developing a small number of shapes that are used as reference points. To this end, we developed spherical and flat shape prior models to determine the extent to which compounds are flat or spherical. For the spherical prior, we calculated the joint probability of the arcsine and square root functions. The flat prior is simpler since the only variation will occur across distance. Using least-squares methods, we parametrically fit a gamma density function to only the distance data of all compounds. That is, we used one set of parameters for all compounds to characterize size change. The result was placed in the first column of a matrix the same size as the molecular joint densities with the remainder being zeros. For each class of priors we calculated the distance from flat and spherical for every compound in our dataset using EMD. This gives us a measure to indicate how spherical or flat a given compound is relative to the others.
Results
Alpha-shapes discriminate topology, conformation, and stereochemistry among constitutional isomers
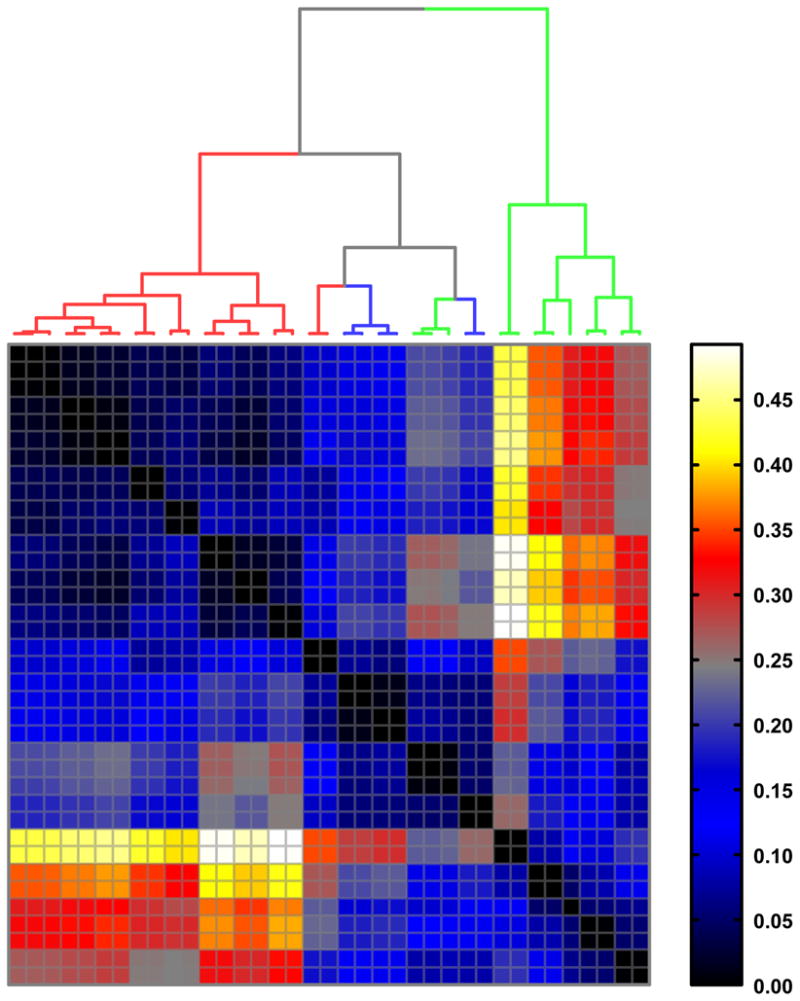
Using a reference set of octane conformations (OCT; see Methods), we compared pairwise distances computed using EMD between alpha-shape joint density distributions (AJD-EMDs; Figure 3) to pairwise distances computed using PMI41 and USR15 shape descriptions (Figures 4 and 5, respectively). The motivation for using a small dataset was ease of characterization and interpretation (See Methods). With only 4 different compounds and 37 total conformations (see Supplementary Table S2), this set allows us to understand the primary mechanisms of similarity exposed by our method. Specifically, we are interested in comparing similarities between conformers, stereoisomers, and geometric isomers between the selected methods.
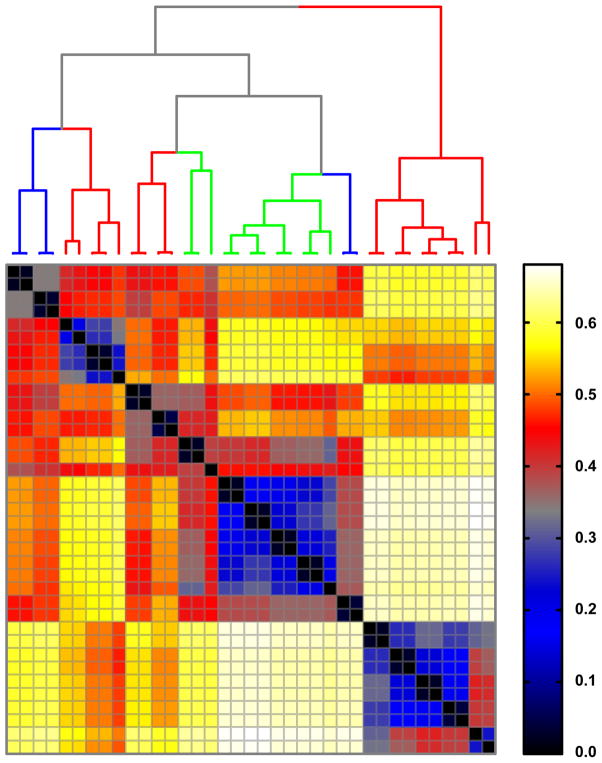
Figure 3. Earth-mover’s distance (EMD) between alpha-shape joint density (AJD) distributions.
Hierarchal clustering of ADJ-EMD distances between octanes and octane conformations, including conformers of 5 (red branches), 12 or 12* (green branches), and 13 (blue branches).
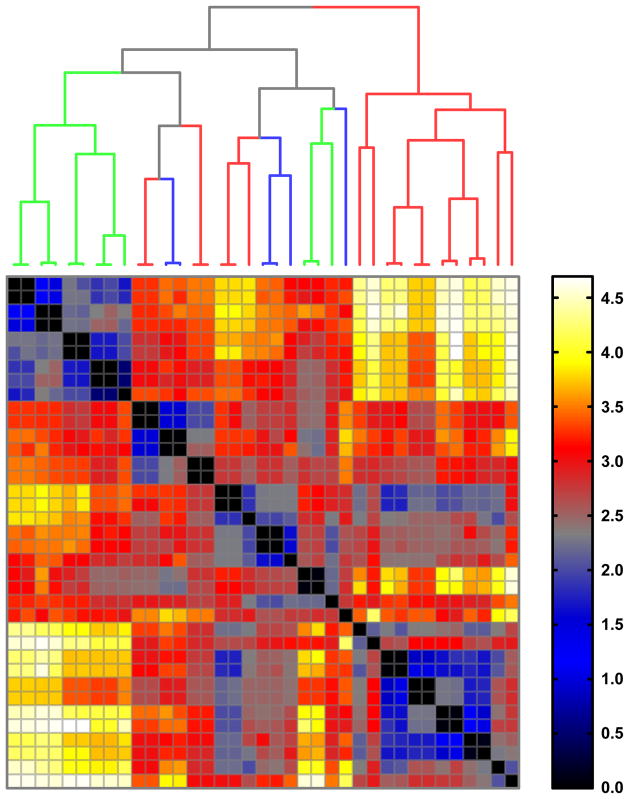
Figure 4. Distance relationships based on principal moment-of-intertia (PMI) ratios.
41 Hierarchal clustering of normalized PMI distances between octanes and octane conformations, including conformers of 5 (red branches), 12 or 12* (green branches), and 13 (blue branches).
Figure 5. Distance relationships based on ultra-fast shape recognition (USR) descriptors.
15 Hierarchal clustering of USR distances between octanes and octane conformations, including conformers of 5 (red branches), 12 or 12* (green branches), and 13 (blue branches).
We find two primary results that are worth discussing here. First, we find that with AJD-EMD we can discriminate chemical “shapes” with high precision. That is, the shapes tend to be well-distinguished from one another with even slight changes in atomic coordinates and with little regard for topology (Figure 3). In contrast, PMI analysis shows that the resolving power of this method is coarse. Clusters of “shape” tend to be directly aligned with molecular topology (Figure 4), with the exception of three conformers of 12 or 12* that tend to cluster with conformers of 13. A pattern intermediate to AJD and PMI emerges with our implementation of the USR algorithm (Figure 5), with the additional observation that the conformers of 5 are split into two distinct groups, as (to a lesser extent) are those of 13. Second, we find that with this test collection, AJD-EMD analysis easily reveals pairs of conformations that are conformational enantiomers (pairs along the diagonal in Figure 3). In contrast, other pairs of molecules sharing topology and even absolute stereochemistry are well-resolved. Inspection of the dendrogram in Figure 3 shows how pairs of conformational enantiomers are easily distinguished from all other pairs of conformers, both within and between distinct compounds. Notably, one pair of enantiomeric conformers did not necessarily have similar values, due to the alpha-shapes having slightly different facet configurations; nevertheless, this pair remained closest to each other in EMD, just with a higher value than the other pairs, which were all at or near zero. USR was also able to discriminate enantiomeric conformers (pairs along the diagonal in Figure 5). However, the distances between such pairs is not significant by this method and could result in inaccuracies if searching for conformational enantiomers. With PMI analysis, distances among conformers of the same molecule tend to be similar and difficult to distinguish, typically resulting in small distances among conformers of a given molecule. These results are confirmed with our larger dataset of bioactive compounds as well.
Alpha-shapes resolve diverse compounds into rational shape groups
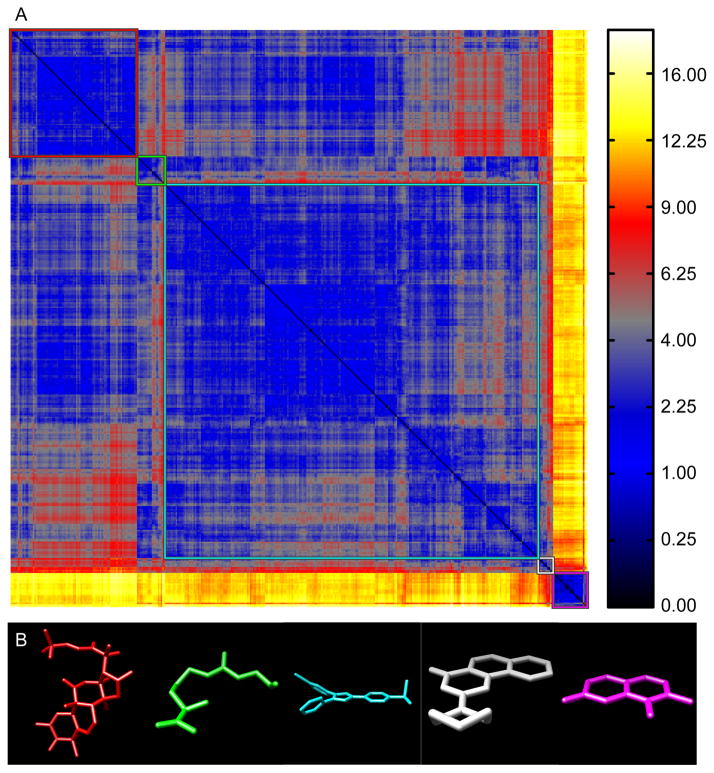
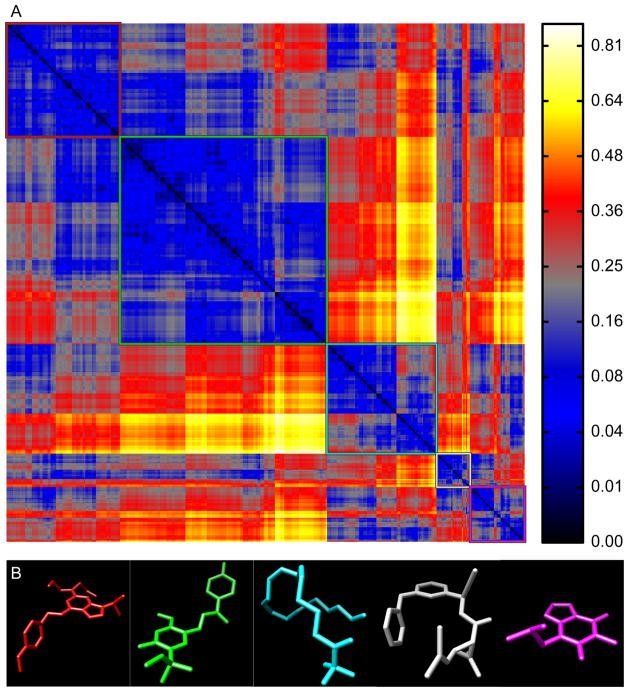
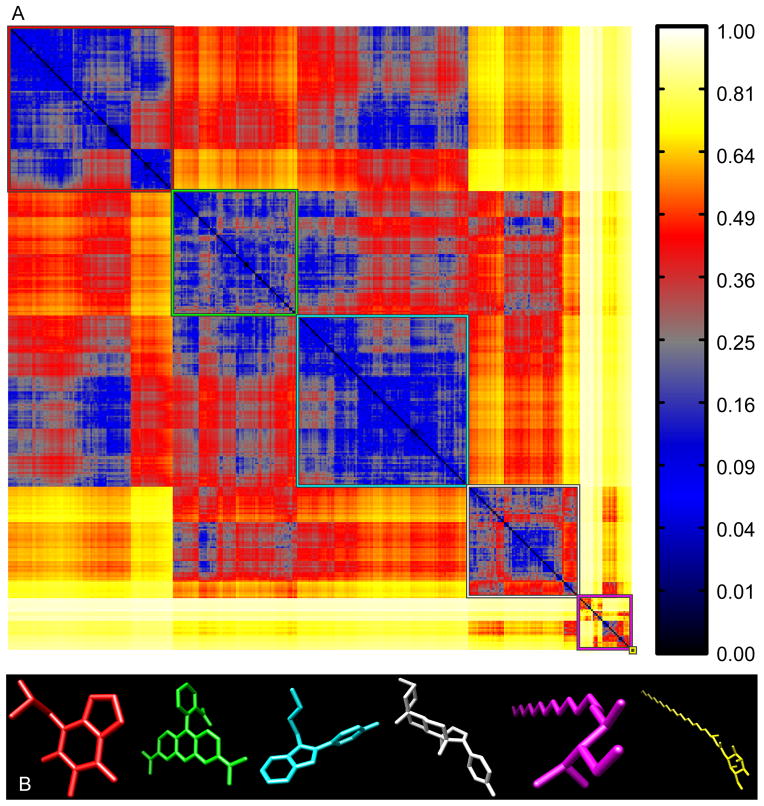
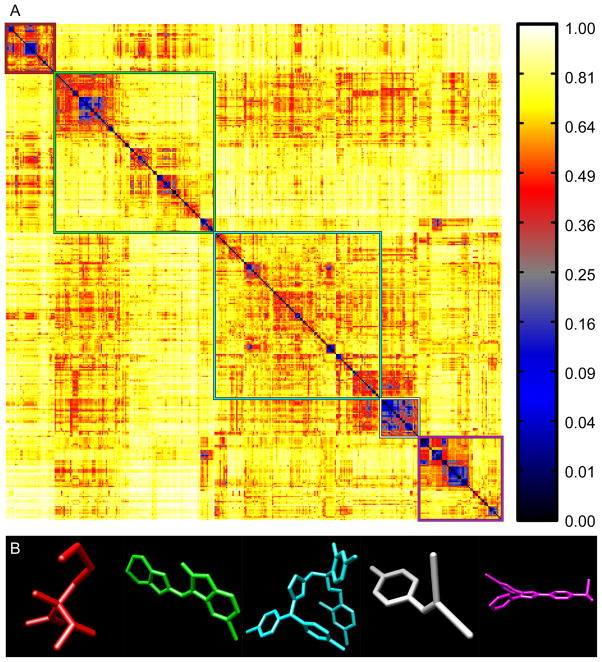
Using a reference set of bioactive compounds (BIO; see Methods), we compared pairwise distances computed using AJD-EMDs (Figure 6a) to pairwise distances computed using PMI and USR shape descriptions15,41 (Figure 7a and 8a, respectively) and pairwise Tanimoto distances computed on FCFP6 descriptors (Figure 9a; see Methods). The first apparent observation with our method is that there are two distinct classes: perfectly flat compounds and everything else. To examine this relationship more closely, we clustered these distances into the first five groups determined by hierarchical clustering with either a distance criterion (Figures 6a, 7a, and 9a, outlined boxes) or with a cophenetic (consistency) criterion49 (Figure 8a). For each cluster, we constructed a composite “member”. For AJD this was done by summing the AJDs of all members and re-normalizing the density distributions. We chose representative compounds from each cluster with the minimum EMD to this composite AJD (Figure 6b). Examining these representative compounds reveals that the trend from “globular” to flat is gradual. For comparison to these AJD-EMD results, we selected representative members of each of five clusters among PMI similarities (Figure 7b) by choosing the compound closest to the cluster centroid for each cluster in the PMI map. Unlike the AJD-EMD, the PMI clusters do not display significant shape classes. However, there was a slight trend for the members of the fourth cluster (Figure 7a, white box and Supplementary Table S4) to be larger than the others across many calculated descriptors (e.g., heavy atom counts, bond counts, and molecular volume). In addition, both the fourth and fifth clusters (Figure 7a, white and magenta boxes, respectively) had a significantly higher globularity than the other three clusters. We also compared members of clusters derived from Tanimoto distances between FCFPs (Figure 9b), by choosing compounds with the minimum average distance to all other compounds in the cluster. In the Tanimoto distance-based clustering we failed to find any intuitive classes of shape, with the possible exception of the first cluster (Figure 9a, red box), which contains a large number of small compounds. Given that FCFP6 fingerprints are based on connectivity only this might not seem surprising. However, some kind of shape complementarity needs to be present for ligand-target binding. Thus, paying attention to three-dimensional properties such as AJD descriptors may prove beneficial. Our method of clustering these three datasets did not produce reasonable clusters for the pairwise distances calculated using USR, so we used a slightly different clustering method for USR with a cophenetic (consistency) criterion,49 and then chose representative members of each of the resulting six clusters (Figure 8a) by summing and renormalizing the moments of all members of a cluster. The compounds with the smallest distance to this composite USR compound were selected as representatives (Figure 8b). Like the PMI clusters, these USR clusters do not show a strong indication of distinct shape-classes, with the exception that there is a size bias with two of the largest compounds in the collection being very different from all other compounds. This cluster of two members has 48.6% more atoms than the average of all other clusters. Two of the remaining clusters contain a large proportion of small compounds with 23.2% and 36.1% of the number of atoms as the large-compound cluster. In addition, there is a trend among the clusters to show significant differences in size-related descriptors such as molecular weight, molecular surface area, polar surface area, solvent accessible volume, etc., indicative of a size bias in the USR method (see Supplementary Table 4).
Figure 6. EMD-AJD pairwise distances for “bioactive” compounds.
(A) Hierarchical clustering of AJD-EMDs among 388 bioactive compounds resolves compounds into groups with different shapes (colored boxes). (B) Representative structures from each cluster (colors correspond to the boxes in A).
Figure 7. PMI pairwise distances for “bioactive” compounds.
(A) Hierarchical clustering of PMI-based distances among 388 bioactive compounds resolved into five clusters (colored boxes). (B) Representative structures from each cluster (colors correspond to the boxes in A).
Figure 8. USR pairwise distances for “bioactive” compounds.
(A) Hierarchical clustering of USR-based distances among 388 bioactive compounds resolved into six clusters (colored boxes); six clusters were chosen for comparison due to the small size of one of the clusters. (B) Representative structures from each cluster (colors correspond to the boxes in A).
Figure 9. Tanimoto pairwise distances between functional-class fingerprints (FCFP6) for “bioactive” compounds.
(A) Hierarchical clustering of Tanimoto distances among 388 bioactive compounds resolved into five clusters (colored boxes). (B) Representative structures from each cluster (colors correspond to the boxes in A).
Alpha-shapes provide complementary information to existing 2D and 3D shape descriptors
To further understand how our method compares to other shape descriptors, we performed comparative analyses between PMI, USR, Tanimoto FCFPs, and our method. To do this, we compared the complete set of pairwise distances from our octane (OCT) test dataset between the PMI, USR, and AJD methods (Figure 10). In the case of perfect information correspondence, all data points would fall along the diagonal. Even for such a small and chemically homogeneous dataset there is significant departure from the diagonal. To quantify this variation, we calculated the distance of each point perpendicular to the linear regression and computed descriptive statistics on these distances (Table 1). AJD and USR (Figure 10a) are the most similar of the three comparisons when considering just the slope and intercept. However, this similarity becomes much less apparent when looking at the statistics of the distances (Table 1). We performed the same analysis on our larger set of bioactive (BIO) test compounds (Table 2). Any sign of a high degree of correspondence disappears as the slopes flatten and spread increases. That is not to say that there is no correspondence as there are members along the diagonal. We were also concerned with how the methods may differ so we examined compounds that lie at the extrema (the 4 corners) of these comparisons. These corners represent areas where the methods are in good agreement (compounds are deemed to be similar or dissimilar with both methods) or disagreement (compounds are similar with one method and dissimilar with another and vice versa), and we identified compounds by their normalized distances from these extrema for a comparison of AJD and USR (Table 3). In order, the rows of the table represent the compounds that both methods determined to be similar (small distance), both methods deemed to be dissimilar (large distance), and where the methods differed (one large distance and the other a small distance). The first case, where both methods determined compound were similar, is not a surprising finding given that earlier results (vide supra) showed that these methods are sensitive to compounds that are stereoisomers. In the case where both methods agreed that both compounds were different is a marked size change (and for AJD one compound is planar and other a long chain of rotatable carbons—pentadecane). Finally, in the cases where the methods differed markedly is the instance of a large AJD and a small USR distance. There does not appear to be much difference between the molecules, but one conformation is perfectly flat while the other is not. Thus, they have no overlapping bin locations in the joint density. Conversely, in the case with a small AJD and a large USR distance shows the size dependence of the USR method. USR determines that these are very different shapes because one is much longer than the other despite having similar overall shapes.
Figure 10. Comparison of three methods of calculating molecular shape.
Each data point is a pairwise distance calculated by one method, plotted against the distance between the same pair of compounds calculated by an alternative method. Data were normalized within each method and a linear regression plotted (black trace). (A) AJD vs. USR, (B) AJD vs. PMI, (C) PMI vs. USR.
Table 1. Statistics of method comparison for octane conformation dataset.
Distances of data points to the linear regression (see Figure 10) were calculated. Statistics and slopes/intercepts of these distances are shown. Kurtosis shown is not relative to a Gaussian distribution.
| Distance Statistic | AJD v USR | AJD v PMI | PMI v USR |
|---|---|---|---|
| Intercept | −0.0927 | −0.2578 | 0.3026 |
| Slope | 1.0451 | 0.9819 | 0.7299 |
| Mean Distance | 0.0961 | 0.0979 | 0.1222 |
| Median Distance | 0.0888 | 0.0843 | 0.1152 |
| STD Distance | 0.0656 | 0.0738 | 0.0785 |
| Kurtosis Distance | 2.6858 | 4.0209 | 3.2227 |
Table 2. Statistics of method comparison for bioactive compound dataset.
Distances of data points to a linear regression were calculated. Statistics and slopes/intercepts of these distances are shown. Kurtosis shown is not relative to a Gaussian distribution.
| Distance Statiq1stic | AJD v USR | AJD v PMI | PMI v USR | AJD v Tani | PMI v Tani | USR v Tani |
|---|---|---|---|---|---|---|
| Intercept | 0.6012 | 0.2617 | 0.5585 | 0.9039 | 0.9056 | 0.8860 |
| Slope | 0.0706 | 0.1463 | 0.2013 | 0.0349 | 0.0226 | 0.0426 |
| Mean Distance | 0.1648 | 0.1491 | 0.1599 | 0.0375 | 0.0377 | 0.0374 |
| Median Distance | 0.1490 | 0.1359 | 0.1464 | 0.0290 | 0.0289 | 0.0287 |
| STD Distance | 0.1094 | 0.1040 | 0.1050 | 0.0459 | 0.0460 | 0.0456 |
| Kurtosis Distance | 2.2025 | 4.3371 | 2.2251 | 64.2661 | 64.0175 | 63.5884 |
Table 3. Comparison of AJD-EMD and USR-based distances for extreme compound pairs.
Four extreme cases are depicted: both methods in agreement with small and large distances, and both methods in disagreement with one large and one small distance. Molecular graphs of compared compounds, and their respective AJD and USR distances are shown.
| AJD v USR | Compound 1 | Compound 2 | AJD | USR |
|---|---|---|---|---|
| Small AJD v Small USR |

|

|
0.0009 | 0.0006 |
| Large AJD v Large USR |
|

|
1.000 | 0.9486 |
| Large AJD v Small USRs |

|

|
0.8430 | 0.1746 |
| Small AJD v Large USR |

|

|
0.0408 | 0.9909 |
Alpha-shapes provide information similar to a small number of existing descriptors
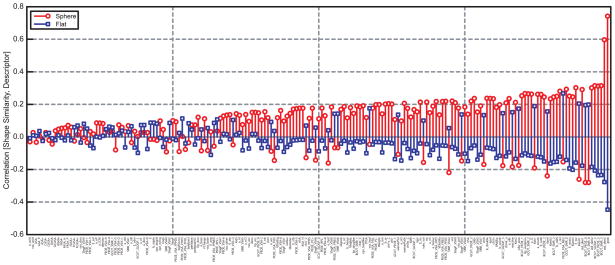
The correlations of our derived AJD flat and spherical prior comparisons with 183 descriptors from MOE reveals further relationships between the AJD description and existing descriptors (Figure 11). The values are sorted in ascending order of the total absolute values of spherical and flat correlation. The descriptors with high correlations show that spherical shape correlates well with ‘globularity’, ‘standard dimension 3’, and ‘BCUT 3’ descriptors.50 These descriptors are meant to compare the extent to which compounds contain volume that extends into the third dimension. Comparing the same descriptors to the flat prior shows a strong negative correlation since these flat compounds have little or no volume in the third dimension. Lower in the sorted correlation list, the flat prior shows a positive correlation with the zero dimensional BCUT descriptor and the spherical prior shows a negative correlation with this descriptor. That is, some of the descriptors show a high degree of intuitive similarity with the AJD-prior method. However, taking all these flat and spherical correlations into account, there is a −0.84 normalized covariance between the two, showing that our two priors do share quite a bit of information. This is evident because a positive correlation in one prior often leads to a negative correlation in the other. However, across all descriptors the spherical prior shows an average correlation of 0.086 and the flat prior an average of −0.023. Thus, there are a small number of descriptors that are capturing the similarities between existing methods and alpha shapes.
Figure 11. Correlations between calculated molecular descriptors from MOE54 and alpha-shape priors.
Descriptors are sorted by total absolute value of spherical and flat correlation for each descriptor. Spherical (red circles) and flat (blue squares) prior similarities are correlated with each descriptor.
Discussion
We developed a novel alignment-free method of describing and comparing molecular shape that is rotation- and size pseudo-invariant. Making use of computational geometry and surface characterization techniques, we have shown that our method is keenly sensitive to molecular shape variations, including the ability to resolve constitutional isomers and molecular coordinates differing only in stereochemistry and conformation. Specifically, we showed that our method discriminates enantiomeric poses from other conformations of the same compound, using a reference set of different poses among constitutional isomers. For a diverse reference set of bioactive compounds, a high-level analysis using this method differentiates flat compounds from everything else. As our resolution of similarity increases, we see a gradual change in shape from globular to flat when pairwise EMDs are clustered into five groups. We also showed that our method of determining distance from two preconceived reference shapes offers an alternative, to a good degree orthogonal, measure compared with most existing shape descriptors—globularity being one of the existing descriptors exhibiting a high degree of similarity. Finally, we compared our shape descriptor to existing algorithms with the hypothesis of a large degree of overlap between them. While this is sometimes the case, we also find considerable disagreement for many pairs of molecules.
To date, we have relied on two sources of open source code for calculating alpha shapes. One is C source that was written by Ken Clarkson thirteen years ago (recently found here: http://www.netlib.org/voronoi/hull.html). The second is the Computational Geometry Algorithms Library (CGAL 3.3.1), written in C++.46,51 However, as our development progressed, we moved to exclusive usage of the CGAL implementation, meaning that we lack control of this aspect of our algorithm. In general, this has not been a problem, but we did fail to have identical alpha-shapes with one pair of conformational enantiomers with our octane dataset. We are currently examining this issue. With our current configuration, following considerable optimization, our runtime is about 1.7 seconds per compound. This is the total time from the start of reading the SDF file to the end of EMD calculations versus our flat and spherical shape priors. Clearly, we would like to reduce this time further. We have observed that a large portion of the time is spent with file I/O in calculating alpha-shapes.
We have shown that the AJD descriptor does share information with existing descriptors. For example, both AJD and USR descriptors well discriminate conformational enantiomers from other conformations. However, due to the nature of the USR descriptor, it contains a size bias that the AJD descriptor avoids. The AJD method, being nearly size-independent, is more sensitive to changes in global shape than, say, the number of atoms. We showed this by pairing compounds of dissimilar results between the methods. In Table 3, a small AJD and a large USR shows compounds that are in “curved” conformations (i.e., “banana-like”), but markedly differ in size. Thus, the combination of varying descriptors—both 2D and 3D—that capture different aspects of molecular structure could result in a more complete molecular description (as illustrated recently52,53). Combining similar and dissimilar descriptors could happen in a number of ways depending on which molecular characteristics are deemed important for a particular physical or biological property. For example, the AJD descriptor is pseudo-size independent but there may be instances where size is important—along with shape. Thus, combining AJD with other descriptors that determine size (e.g., molecular weight, volume, and heavy-atom count) would produce a hybrid description that is sensitive to both properties. An additional area we have been examining is how the number of rotatable bonds can affect shape. Combining AJD with other descriptors that are sensitive to the number of rotatable bonds might thus result in a joint descriptor that captures the mutual information between shape and rotatable bonds. Another approach, which might be well-suited for examining certain libraries, would be to perform alpha-shape analysis on molecular skeletons or scaffolds only. This would reduce the dependence of the result on flexibility due to rotation among side chains. In addition, combining dissimilar information is statistically favorable since mutual information would be minimized. These combinations could be done on an ad hoc basis, but future work will involve examining methods to combine descriptors to produce a complete hybrid description of compounds. We also aim to examine how modern variants of alpha-shape calculation may benefit our algorithm, such as employing weighted or conformational alpha shapes which may enhance the shape sensitivity of our method. Also, alpha shapes have been used to characterize many properties of proteins, including the categories of depressions, pockets, and voids. To date, there has been no attempt to describe the shape of these potential binding sites. We plan to adapt our method to characterize the shape of protein binding sites and thus complement small molecule ligand shape analyses.
Conclusions
We have developed a method to describe the shape of small molecules. This method is extremely sensitive to changes in atomic coordinates. It was our aim to produce a shape descriptor that would capture global information about shape. Given that current theory predicts that compounds of a similar shape will produce similar biological activity we believe that being able to search biological activity space with high precision is of utmost importance. Unlike previously developed methods our method categorizes shapes into a logical continuum. We also found that our method does not correlate well with current 3D descriptors indicating that we are capturing shape information previously neglected.
Supplementary Material
Acknowledgments
The authors would like to thank members of the Computational Chemical Biology Research Group at the Broad Institute for insightful discussions and the anonymous reviewers for their comments. This work was supported by the Broad Institute Center of Excellence in Chemical Methodology and Library Development (P50-GM069721) and the Broad Institute Exploratory Center for Cheminformatics Research (P20-HG003895). AB thanks the Dutch Top Institute Pharma for support, project number: D1–105.
Footnotes
Supporting Information Available
Supplementary Tables referenced in the text, as well as structure-definition format (SDF) files containing 3D conformations for all compounds used in this study are provided. Supplementary Table Legends and details of SDF file contents are provided as a supporting Word Document. This information is available free of charge via the Internet at http://pubs.acs.org/.
References
- 1.Kortagere S, Krasowski MD, Ekins S. The importance of discerning shape in molecular pharmacology. Trends Pharmacol Sci. 2009;30(3):138–47. doi: 10.1016/j.tips.2008.12.001. [DOI] [PMC free article] [PubMed] [Google Scholar]
- 2.Bergstrom CA, Norinder U, Luthman K, Artursson P. Molecular descriptors influencing melting point and their role in classification of solid drugs. J Chem Inf Comput Sci. 2003;43(4):1177–85. doi: 10.1021/ci020280x. [DOI] [PubMed] [Google Scholar]
- 3.Karthikeyan M, Glen RC, Bender A. General melting point prediction based on a diverse compound data set and artificial neural networks. J Chem Inf Model. 2005;45(3):581–90. doi: 10.1021/ci0500132. [DOI] [PubMed] [Google Scholar]
- 4.Gohlke H, Klebe G. Approaches to the description and prediction of the binding affinity of small-molecule ligands to macromolecular receptors. Angew Chem-Int Edit Engl. 2002;41(15):2644–76. doi: 10.1002/1521-3773(20020802)41:15<2644::AID-ANIE2644>3.0.CO;2-O. [DOI] [PubMed] [Google Scholar]
- 5.Bender A, Mussa HY, Gill GS, Glen RC. Molecular surface point environments for virtual screening and the elucidation of binding patterns (MOLPRINT 3D) J Med Chem. 2004;47(26):6569–83. doi: 10.1021/jm049611i. [DOI] [PubMed] [Google Scholar]
- 6.Clark T. QSAR and QSPR based solely on surface properties? J Mol Graph Model. 2004;22(6):519–25. doi: 10.1016/j.jmgm.2004.03.012. [DOI] [PubMed] [Google Scholar]
- 7.Cheeseright T, Mackey M, Rose S, Vinter A. Molecular field extrema as descriptors of biological activity: definition and validation. J Chem Inf Model. 2006;46(2):665–76. doi: 10.1021/ci050357s. [DOI] [PubMed] [Google Scholar]
- 8.Cramer RD, Patterson DE, Bunce JD. Comparative Molecular-Field Analysis (COMFA).1. Effect of Shape on Binding of Steroids to Carrier Proteins. J Am Chem Soc. 1988;110(18):5959–5967. doi: 10.1021/ja00226a005. [DOI] [PubMed] [Google Scholar]
- 9.Good AC, Hodgkin EE, Richards WG. Utilization of Gaussian Functions for the Rapid Evaluation of Molecular Similarity. J Chem Inf Comput Sci. 1992;32(3):188–191. [Google Scholar]
- 10.Good AC, Richards WG. Rapid Evaluation of Shape Similarity Using Gaussian Functions. J Chem Inf Comput Sci. 1993;33(1):112–116. [Google Scholar]
- 11.Wagener M, Sadowski J, Gasteiger J. Autocorrelation of Molecular-Surface Properties for Modeling Corticosteroid-Binding Globulin and Cytosolic Ah Receptor Activity by Neural Networks. J Am Chem Soc. 1995;117(29):7769–7775. [Google Scholar]
- 12.Stiefl N, Baumann K. Mapping property distributions of molecular surfaces: algorithm and evaluation of a novel 3D quantitative structure-activity relationship technique. J Med Chem. 2003;46(8):1390–407. doi: 10.1021/jm021077w. [DOI] [PubMed] [Google Scholar]
- 13.Fontaine F, Bolton E, Borodina Y, Bryant SH. Fast 3D shape screening of large chemical databases through alignment-recycling. Chemistry Central Journal. 2007;1:12. doi: 10.1186/1752-153X-1-12. [DOI] [PMC free article] [PubMed] [Google Scholar]
- 14.Haigh JA, Pickup BT, Grant JA, Nicholls A. Small molecule shape-fingerprints. J Chem Inf Model. 2005;45(3):673–84. doi: 10.1021/ci049651v. [DOI] [PubMed] [Google Scholar]
- 15.Ballester PJ, Richards WG. Ultrafast shape recognition to search compound databases for similar molecular shapes. J Comput Chem. 2007;28(10):1711–23. doi: 10.1002/jcc.20681. [DOI] [PubMed] [Google Scholar]
- 16.Cannon EO, Nigsch F, Mitchell JB. A Novel Hybrid Ultrafast Shape Descriptor Method for use in Virtual Screening. Chemistry Central Journal. 2008;2(1):3. doi: 10.1186/1752-153X-2-3. [DOI] [PMC free article] [PubMed] [Google Scholar]
- 17.Edelsbrunner H, Kirkpatrick DG, Seidel R. On the shape of a set of points in the plane. IEEE Transactions on Information Theory. 1983;IT-29(4):551–559. [Google Scholar]
- 18.Edelsbrunner H. The union of balls and its dual shape. Annual Computational Geometry. 1993;9:218–231. [Google Scholar]
- 19.Edelsbrunner H, Mucke EP. Three-dimensional alpha shapes. ACM Trans Graphics. 1994;(13):43–72. [Google Scholar]
- 20.Edelsbrunner H, Facello M, Fu P, Liang J. Measuring Proteins and Voids in Proteins. Proceedings of the 28th Annual Hawaii International Conference on Systems Sciences; 1995. pp. 256–264. [Google Scholar]
- 21.Lucieer A, Kraak MJ. Alpha - shapes for visualizing irregular shaped class clusters in 3D feature space for classification of remotely sensed imagery. In: Erbacher RF, Chen PC, Roberts JC, Gröhn MT, Börner K, editors. IS&T SPIE international sympoium on Electronic Imaging. San Jose, California: 2004. pp. 201–211. [Google Scholar]
- 22.Moran PJ, Wagner M. Introducing alpha shapes for the analysis of path integral Monte Carlo results. Proceedings of the conference on Visualization; Washington, D.C: IEEE Computer Society Press; 1994. pp. 52–59. [Google Scholar]
- 23.Cazals F, Giesen J, Pauly M, Zomorodian A. The conformal alpha shape filtration. Visual Comput. 2006;22(8):531–540. [Google Scholar]
- 24.Guo B, Menon J, Willette B. Surface Reconstruction Using Alpha Shapes. Computer Graphics Forum. 1997;16:177–190. [Google Scholar]
- 25.Park SH, Lee SS, Kim JH. A surface reconstruction algorithm using weighted alpha shapes. Lect Notes Artif Int. 2005;3613:1141–1150. [Google Scholar]
- 26.Teichmann M, Capps M. Surface reconstruction with anisotropic density-scaled alpha shapes. IEEE Visualization Proceedings of the conference on Visualization; IEEE Computer Society Press: Research Triangle Park; North Carolina, United States. 1998. pp. 67–72. [Google Scholar]
- 27.Cueto E, Calvo B, Doblare M. Modelling three-dimensional piece-wise homogeneous domains using the alpha-shape-based natural element method. Int J Numer Meth Eng. 2002;54(6):871–897. [Google Scholar]
- 28.Cueto E, Doblaré MLG. Imposing essential boundary conditions in the natural element method by means of density-scaled alpha-shapes. Int J Numer Meth Eng. 2000;49(4):519–546. [Google Scholar]
- 29.Meine H, Köthe U, Stelldinger P. A topological sampling theorem for Robust boundary reconstruction and image segmentation. Discrete Appl Math. 2009;157(3):524–541. [Google Scholar]
- 30.Zomorodian A, Guibas L, Koehl P. Geometric filtering of pairwise atomic interactions applied to the design of efficient statistical potentials. Comput Aided Geom Design. 2006;23(6):531–544. [Google Scholar]
- 31.De-Alarcon PA, Pascual-Montano A, Gupta A, Carazo JM. Modeling shape and topology of low-resolution density maps of biological macromolecules. Biophys J. 2002;83(2):619–32. doi: 10.1016/S0006-3495(02)75196-5. [DOI] [PMC free article] [PubMed] [Google Scholar]
- 32.Edelsbrunner H, Facello M, Liang J. On the definition and the construction of pockets in macromolecules. Discrete Appl Math. 1998;88(1–3):83–102. [PubMed] [Google Scholar]
- 33.Liang J, Edelsbrunner H, Fu P, Sudhakar PV, Subramaniam S. Analytical shape computation of macromolecules: II. Inaccessible cavities in proteins. Proteins: Struct Funct Bioinform. 1998;33(1):18–29. [PubMed] [Google Scholar]
- 34.Liang J, Edelsbrunner H, Fu P, Sudhakar PV, Subramaniam S. Analytical shape computation of macromolecules: I. Molecular area and volume through alpha shape. Proteins: Struct Funct Bioinform. 1998;33(1):1–17. [PubMed] [Google Scholar]
- 35.Liang J, Dill KA. Are proteins well-packed? Biophys J. 2001;81(2):751–766. doi: 10.1016/S0006-3495(01)75739-6. [DOI] [PMC free article] [PubMed] [Google Scholar]
- 36.Rubner Y, Guibas LJ, Tomasi C. The Earth Mover's Distance, Multi-Dimensional Scaling, and Color-Based Image Retrieval. ARPA Image Understanding Workshop; New Orleans, LA. 1997. pp. 661–668. [Google Scholar]
- 37.Rubner Y, Guibas LJ, Tomasi C. The earth mover's distance as a metric for image retrieval. Int J Comput Vision. 2000;40(2):99–121. [Google Scholar]
- 38.Gill PE, Murray W, Wright MH. Practical optimization. Academic Press; London; New York: 1981. p. xvi.p. 401. [Google Scholar]
- 39.Bioactive Compounds. ChemBank. http://chembank.broad.harvard.edu/chemistry/search/execute.htm?id=5358370. Query for the test set of known bioactives. This set was filtered by removing compounds with metals and those with fewer than 6 heavy atoms. Further reduction was done to remove compounds that failed to generate a stable conformation using MOE54.
- 40.Development Compounds. ChemBank. http://chembank.broad.harvard.edu/chemistry/search/execute.htm?id=5358369. Query for the development set of small molecules. This set was intially filtered by removing compounds with metals and those with fewer than 6 heavy atoms. Further reduction was done to remove compounds that failed to generate a stable conformation using MOE54.
- 41.Sauer WH, Schwarz MK. Molecular shape diversity of combinatorial libraries: a prerequisite for broad bioactivity. J Chem Inf Comput Sci. 2003;43(3):987–1003. doi: 10.1021/ci025599w. [DOI] [PubMed] [Google Scholar]
- 42.Bender A, Glen RC. Molecular similarity: a key technique in molecular informatics. Org Biomol Chem. 2004;2(22):3204–3218. doi: 10.1039/B409813G. [DOI] [PubMed] [Google Scholar]
- 43.Bender A, Young DW, Jenkins JL, Serrano M, Mikhailov D, Clemons PA, Davies JW. Chemogenomic data analysis: Prediction of small-molecule targets and the advent of biological fingerprints. Comb Chem High T Scr. 2007;10(8):719–731. doi: 10.2174/138620707782507313. [DOI] [PubMed] [Google Scholar]
- 44.Kendall M. A New Measure of Rank Correlation. Biometrika. 1938;30:81–89. [Google Scholar]
- 45.Kendall M. Rank Correlation Methods. Charles Griffin And Co; London: 1948. p. 272. [Google Scholar]
- 46.Fabri A, Giezeman G-J, Kettner L, Schirra S, Schönherr S. On the design of CGAL a computational geometry algorithms library. Software--Practice and Experience. 2000;30(11):1167–1202. [Google Scholar]
- 47.Geisler WS, Perry JS, Super BJ, Gallogly DP. Edge co-occurrence in natural images predicts contour grouping performance. Vision Res. 2001;41(6):711–724. doi: 10.1016/s0042-6989(00)00277-7. [DOI] [PubMed] [Google Scholar]
- 48.Ling H, Okada K. An Efficient Earth Mover's Distance Algorithm for Robust Histogram Comparison. Trans on Pattern Anal and Machine Intel. 2007;29(5):840–853. doi: 10.1109/TPAMI.2007.1058. [DOI] [PubMed] [Google Scholar]
- 49.Sokal RR, Rohlf FJ. The comparison of dendrograms by objective methods. Taxon. 1962;11:33–40. [Google Scholar]
- 50.Pearlman RS, Smith KM. Novel Software Tools for Chemical Diversity. Perspect Drug Discov. 1998;9:339–353. [Google Scholar]
- 51.Fabri A, Giezeman G-J, Kettner L, Schirra S, Schönherr S. The CGAL Kernel: A Basis for Geometric Computation. In: Lin MC, Manocha DN, editors. Applied Computational Geometry Towards Geometric Engineering. 1148/1996. Springer; 1996. pp. 191–202. [Google Scholar]
- 52.Bender A, Jenkins JL, Scheiber J, Sukuru SC, Glick M, Davies JW. How similar are similarity searching methods? A principal component analysis of molecular descriptor space. J Chem Inf Model. 2009;49(1):108–19. doi: 10.1021/ci800249s. [DOI] [PubMed] [Google Scholar]
- 53.Medina-Franco JL, Martinez-Mayorga K, Bender A, Marin RM, Giulianotti MA, Pinilla C, Houghten RA. Characterization of Activity Landscapes Using 2D and 3D Similarity Methods: Consensus Activity Cliffs. J Chem Inf Model. 2009;49(2):477–491. doi: 10.1021/ci800379q. [DOI] [PubMed] [Google Scholar]
- 54.Molecular Operating Environment, 2007.09. Chemical Computing Group; Montreal, Quebec, Canada: 2008. [Google Scholar]
Associated Data
This section collects any data citations, data availability statements, or supplementary materials included in this article.


