

Abstract
To measure the exposure to self-induced tissue vibration in speech, three vocal doses were defined and described: distance dose, which accumulates the distance that tissue particles of the vocal folds travel in an oscillatory trajectory; energy dissipation dose, which accumulates the total amount of heat dissipated over a unit volume of vocal fold tissues; and time dose, which accumulates the total phonation time. These doses were compared to a previously used vocal dose measure, the vocal loading index, which accumulates the number of vibration cycles of the vocal folds. Empirical rules for viscosity and vocal fold deformation were used to calculate all the doses from the fundamental frequency (F0) and sound pressure level (SPL) values of speech. Six participants were asked to read in normal, monotone, and exaggerated speech and the doses associated with these vocalizations were calculated. The results showed that large F0 and SPL variations in speech affected the dose measures, suggesting that accumulation of phonation time alone is insufficient. The vibration exposure of the vocal folds in normal speech was related to the industrial limits for hand-transmitted vibration, in which the safe distance dose was derived to be about 500 m. This limit was found rather low for vocalization; it was related to a comparable time dose of about 17 min of continuous vocalization, or about 35 min of continuous reading with normal breathing and unvoiced segments. The voicing pauses in normal speech and dialogue effectively prolong the safe time dose. The derived safety limits for vocalization will likely require refinement based on a more detailed knowledge of the differences in hand and vocal fold tissue morphology and their response to vibrational stress, and on the effect of recovery of the vocal fold tissue during voicing pauses.
Keywords: voice accumulation, voice dosimetry, vocal fold oscillation, heat dissipation, safety limits
Excessive vibration of vocal fold tissues due to loud or prolonged vocalization has been assumed to contribute to development of voice disorders and presents a significant health concern. For the last two decades, there has been considerable effort to measure the amount of voicing performed by speakers over time. Devices designated as “voice accumulators” (Airo, Olkinuora, & Sala, 2000; Buekers, Bierens, Kingma, & Marres, 1995; Masuda, Ikeda, Manako, & Komiyama, 1993; Ohlsson, Brink, & Löfqvist, 1989; Rantala, Haataja, Vilkman, & Körkkö, 1994; Ryu, Komiyama, Kannae, & Watanabe, 1983; Watanabe, Shin, Oda, & Fukaura, 1987), as well as portable audio recorders (Granqvist, 2001; Södersten, Granqvist, Hammarberg, & Szabo, 2002; Szabo, Hammarberg, Södersten, & Granqvist, 2001), have been used to measure the relevant parameters, such as the voicing time, fundamental frequency (F0) distribution, or voice intensity (sound pressure level [SPL]) distribution over a long period of time.
Excessive voicing can be thought of as an exposure problem. Although the vibration exposure is self-induced, it in many ways resembles exposure to sun rays or chemicals. The surface tissues of the vocal folds are traumatized by rapid accelerations and decelerations, or by contact forces between the two vocal folds. Generally, exposure is quantified by dose. The simplest vocal dose is the time dose, often called the voicing time, which accumulates the total time the vocal folds vibrate during speech. Rantala and Vilkman (1999) offered another dose, the vocal loading index (VLI), which measures the total number of oscillatory cycles performed in the vocal folds during vocalization. Rantala and Vilkman reported that the VLI correlated moderately well with subjective vocal complaints in female teachers. But because the VLI is not sensitive to the intensity of voice, the authors noted the need for a more inclusive index that would discriminate between differences in vocal loudness and phonatory quality. It has not been clear, however, what the proper weighting for F0, SPL, and phonatory quality should be in the quantification of voice exposure.
The purpose of the present article is to introduce two new dose measures that are sensitive to the intensity of phonation and that differentiate between two mechanisms possibly causing vocal problems: (a) energy dissipated in vocal folds, perhaps leading to internal forces that can break molecular bonds by means of thermal agitation, and (b) rapid acceleration and deceleration of the vocal fold tissue, possibly leading to internal forces that can break molecular bonds by means of inertial “whiplash.” Preliminary normative values of the exposure per second of normal speech are derived and the variability of the doses with gender and different speech inflections is studied. Finally, the measured dose values are compared to the safety limits that have been established for the hand-transmitted vibrations in industrial tool use.
Energy Dissipation in Vocal Fold Vibration
As the vocal folds vibrate, tissue is deformed in a cyclic manner at rapid rates. If the tissue were perfectly elastic, energy would be stored in one part of the cycle and fully returned in another part. However, because vocal fold tissue is viscoelastic (Chan & Titze, 1999) some of the energy dissipates due to the viscous component. It is assumed that this energy dissipation (friction), converted into heat, may be responsible for molecular breakdown of tissue. Similar hypotheses have been advanced for exposure to noise trauma and subsequent hearing loss (Ward & Turner, 1982).
As in the repeated back-and-forth bending of a wire, in which the temperature rises locally, thermal agitation of the tissue molecules may weaken the protein bonds and lead to viscoelastic fatigue. Cooper and Titze (1985) have shown that the temperature of vibrating vocal folds could rise as a result of this viscous energy dissipation, but the cooling effect of blood circulation was not able to be assessed because the larynges were excised from the body. Blood circulation does remove most of the heat, but if this circulation is reduced during vibration, as Griffin (1990) clearly asserted, then it could be hypothesized that the burning sensation sometimes accompanying prolonged phonation may be associated with a small intermittent and highly localized temperature rise.
In order to estimate the power dissipated in the vocal folds for a given amplitude and frequency of vibration, it is necessary to relate the internal stress in the vocal folds to tissue movement. We are interested only in a simple analytical expression here that allows order-of-magnitude calculations. With this goal in mind, a number of major simplifying assumptions have to be made:
The vocal folds are deformed mediolaterally only, in the form of a pure shear mode (vertical phase delay between upper and lower portions). This assumption neglects boundary effects, such as additional shear or bending concentrated near the anterior, posterior, or lateral boundaries, or vocal fold collision.
The deformation is sinusoidal and one-dimensional about an equilibrium configuration.
The shape of the vocal fold is a rectangular parallelepiped.
Figure 1 shows a coronal view of this idealized vocal fold deformation. Let L be the length of the vocal folds (into the paper), T the thickness, and D the effective depth of vibration (which does not extend all the way to the lateral boundary). Furthermore, let A be the amplitude of tissue vibration at the top and bottom and θ the shear deformation angle. One-dimensional shear deformation then becomes
Figure 1.
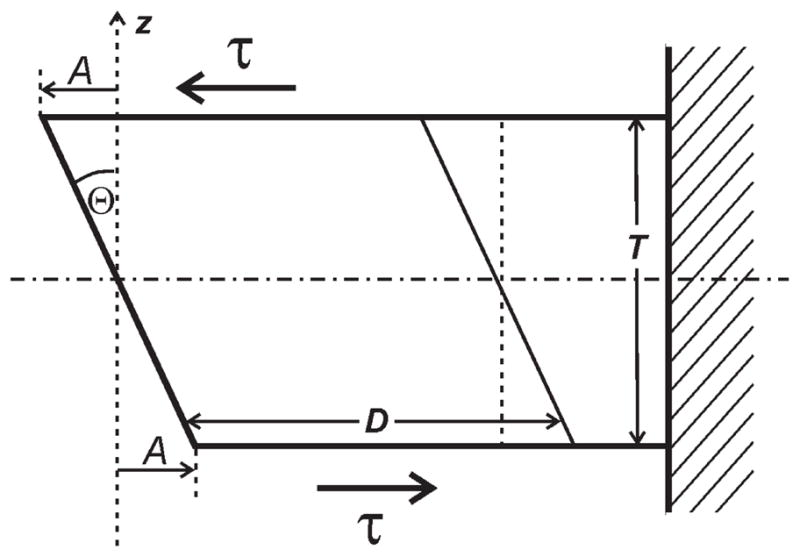
Coronal section through an idealized vocal fold deformed in a pure shear mode. A is the vibration amplitude at the top and bottom, θ is the shear deformation angle, τ is the medio-lateral shear stress, D is the effective depth of vibration, and T is the vocal fold thickness.
| (1) |
where ξ is displacement from equilibrium in the x direction, changing linearly in the vertical (z) direction with an angular frequency ω. The z = 0 plane is in the middle of the vocal fold (dotted/dashed line).
From basic continuum mechanics (Fung, 1994, p. 194), a one-dimensional stress–strain relation for simple viscoelastic shear can be written as
| (2) |
where τ is the shear stress on any horizontal vocal fold plane (acting in the mediolateral direction), γ is the shear strain, μ is the shear elasticity, and η is the shear viscosity. By definition, the shear strain γ is the gradient of deformation in the z direction,
| (3) |
where the right side of the expression comes from differentiation of Equation 1. If boundary effects were included, all deformations would still be shear deformations because the tissue is incompressible, but the deformations would not be simple shear. A wave approach would have to be taken to solve for multiple deformation gradients, which is beyond the scope of this investigation.
The strain rate is defined as
| (4) |
Substituting Equations 3 and 4 into Equation 2 yields
| (5) |
The power dissipated is obtained by time-averaging the product of the shear force and velocity over one cycle. The shear force F on any horizontal plane is LDτ, and because A/2 is the spatial average displacement that occurs at z = ±T/4 in Figure 1, the corresponding spatial average of the shear velocity (∂ξ/∂t) from Equation 1 is
| (6) |
The power dissipated is then
| (7) |
| (8) |
The first integral on the right side of Equation 7 vanishes because the product of the sine and cosine functions cancels out over alternate half-cycles. The second integral on the right side of Equation 7 yields the final result of Equation 8.
For practical applications, it is more useful to calculate the power dissipated per unit volume of vibrating tissue. Size differences between vocal folds of various individuals are then normalized out. Thus, because LTD is the volume of vibrating tissue, the power dissipated per unit volume is
| (9) |
Note that the dissipated power is proportional to amplitude squared and frequency squared, inversely proportional to vocal fold thickness squared, and directly proportional to tissue viscosity. An important ratio is the amplitude to thickness ratio A/T, which is one half of the maximum shear strain γ in Equation 3. Thus, because power dissipation is critically dependent on the maximum shear strain in the tissues, the search for minimum injury in phonation may be tantamount to a search for the lowest shear strain (for a given desired vocal output).
The power dissipated in the vocal folds is considered an undesirable but necessary byproduct of the vocal fold oscillation. In order to quantify the efficiency of speech, the amount of dissipated power can be related to the desirable product—the amount of power radiated out the mouth during phonation, which can be derived from the sound pressure level as follows:
| (10) |
where R is the mouth–microphone distance in meters and spherical isotropic radiation is assumed (for a review, see Titze, 2000, chap. 9).
Tissue Acceleration: Safety Limits for the Hand-Transmitted Vibration in Industry
Acceleration has been found to be an important parameter for traumatized tissue in the hand-transmitted vibration in power tool use. Despite the morphological differences between hand and vocal fold tissues, it can be hypothesized that the fundamental mechanism of tissue damage through vibration is based on similar principles. A critical level of acceleration, for a 1–10 hr range of duration, was given by Griffin (1990). As illustrated in Figure 2, the acceleration–frequency–duration relation is defined as a critical band. Mathematically, the relation is
Figure 2.

Standard for hand-transmitted vibration dose, after Griffin (1990). Data points for men and women are our calculations.
| (11) |
where t is the duration of continuous vibration. The relation is valid for F0 in the range of 10–1000 Hz, which includes all of the phonation range. Because acceleration in Figure 2 is plotted in root-mean-square (RMS) values and because RMS acceleration is for sinusoidal vibration, we get a critical amplitude–frequency–duration relation:
| (12) |
Equation 12 is an inverse amplitude–frequency relation, typical for physical energy dissipating systems, suggesting that high frequency vibration must be bounded in amplitude. According to this equation, the critical vibration amplitude is only 0.36 mm at 100 Hz for 1 hr duration, and less at higher frequencies.
For vocalization, amplitudes of 1–2 mm at frequencies between 100 and 300 Hz are typical (to be described and quantified later). The data points in Figure 2 (circles above the band) were taken from Table 7.4 in Titze (2000) for speaking F0s in three voice categories for both males and females. Filled circles are for basses, baritones, and tenors (with speaking frequencies of 98, 123, and 165 Hz, respectively), and open circles are for contraltos, mezzo sopranos, and sopranos (with speaking frequencies of 175, 196, and 247 Hz, respectively). When these data points are compared to RMS acceleration in standard tool use, assuming 1 hr of continuous phonation (the top curve of the band), safe limits are exceeded by an order of magnitude. For example, at 200 Hz and a 2 mm vibrational amplitude, the peak acceleration in vocalization is 3,158 m/s2 and the RMS acceleration is 2,256 m/s2, whereas a safe RMS level would be about 100 m/s2 according to Figure 2. In terms of g units of the earth’s gravitational acceleration (1 g = 9.8 m/s2), vocal fold tissue acceleration amounts to 230 g. Blood vessels, cells, nerve endings, and protein scaffolds in the lamina propria of the vocal fold (and to a lesser extent the thyroarytenoid muscle) must withstand this continual acceleration and deceleration, at least over short time periods. Frequent recovery times may therefore be needed during vocalization. In other words, 1 hr of continuous phonation (which fortunately is impossible because of respiratory demands) would not be sustainable without risk of injury.
Using Equation 12 to solve for the product AF0 and converting hours to seconds, the safety criterion can be expressed as the accumulated distance D traveled by tissue particles in a periodic trajectory:
| (13) |
where 4A is the trajectory distance traveled per cycle. This relation suggests that tissue in the hands can safely travel about half a kilometer in a periodic vibratory trajectory. This safety limit of about 520 m accumulated distance can serve as a good starting point when quantifying the exposure of vocal folds to vibration. As the differences in hand and vocal fold tissue morphology (and their response to vibrational stress) become clearer, the safety limits will likely undergo refinement.
Empirical Findings on Amplitude, Thickness, and Viscosity
In order to calculate the accumulated vocal fold distance and the dissipated power in various durations of speech, one has to know the fundamental frequency F0, viscosity η, amplitude of vibration A, and vocal fold thickness T. All these parameters vary during speech. Whereas F0 is directly obtainable from the speech signal, the other three parameters are not. To overcome this problem, empirical rules defining these parameters as functions of F0 and SPL were derived.
Figure 3 shows a data set obtained previously (Titze, 1989a) for vibrational amplitude versus subglottal pressure (or, more strictly, fractional excess pressure over phonation threshold pressure). This data set was obtained on excised canine larynges, which are only a model of human in vivo larynges, but it represents the best information currently available. Different data symbols represent measurements at different fractional elongations ε (strains). An approximation to the collection of curves is given by the empirical relation
Figure 3.

Relationship between the relative excess pressure over threshold and the amplitude of vibration of the vocal folds (after Titze, 1989a). The data were obtained for different strains (ε). The solid curve represents the best-fit relationship for these data that corresponds to Equation 14.
| (14) |
where L0 is a reference vocal fold length (16 mm for males and 10 mm for females), PL is the lung pressure, and Pth is the phonation threshold pressure (Titze, 1992). The phonation threshold pressure for humans has also been quantified on an empirical basis (Titze & Sundberg, 1992):
| (15) |
where F0 is the fundamental frequency and F0N is a nominal (speaking) fundamental frequency (120 Hz for males and 190 Hz for females).
The above relations provide only a partial solution to the amplitude versus frequency dependence, because now they involve a new variable, lung pressure. This variable can be estimated from the SPL. According to data presented by Titze and Sundberg (1992),
| (16) |
where SPL is expressed in decibels at 0.5 m from the mouth. With this relation, an amplitude dependence on intensity and frequency is now established.
Variations of vocal fold thickness and length as a function of F0 were given by Hollien (1962), Hollien and Colton (1969), Hollien and Curtis (1960), Hollien and Moore (1960), and Nishizawa, Sawashima, and Yonemoto (1988). From these measurements, two empirical relations for thickness have been extracted:
| (17a) |
| (17b) |
These relations were motivated by tissue incompressibility, that is, thickness varying inversely with length while the mediolateral dimension (depth) remains nearly the same because of boundary constraints. Collective data sets from the authors cited above indicate that vocal fold length increases roughly as the square root of F0, as incorporated in the denominators of Equations 17a and 17b. The matches between Equations 17a and 17b and measured data are given in Figure 4, where unity (the value 1.0) represents the nominal thickness at F0N, chosen to be 5 mm for males and 4 mm for females. These nominal thicknesses are considered to be reasonable vibrational thicknesses at average speaking frequencies F0N, bearing in mind that vibrational thickness is considerably smaller than anatomical thickness.
Figure 4.

Change of vocal fold thickness with phonation frequency. The values correspond to data measured from 5 male and 5 female participants using the method of stroboscopic laminagraphy (Hollien & Colton, 1969). To obtain the normalized values, all the measured thickness values were divided by the value measured at the frequency closest to F0N. The normalization was done for each of the participants separately. Falsetto frequencies were not considered. The curves represent the relationships of Equations 17a and 17b.
Finally, the frequency dependence of the viscosity η is extracted from data by Chan and Titze (1999) according to the following empirical rule:
| (18) |
where k = 5.4 for males and 1.4 for females. The viscosity varies inversely with frequency, a phenomenon known as “shear thinning,” which is characteristic of most biological tissues (Chan & Titze, 1998; Fung, 1980). Figure 5 shows the fit to extrapolated data for the frequency range 50–1000 Hz.
Figure 5.

Decrease of the dynamic viscosity of the vocal folds with increasing fundamental frequency (“shear thinning”) based on the data from Chan and Titze (1999). The solid lines within the phonation range (50–1000 Hz) present the rules given in Equation 18.
Dose Definitions
Having established empirical relations for viscosity, thickness, and amplitude as functions of frequency and intensity, it is now possible to define several dose calculations. The time dose, also called the voicing time or vocal accumulation time, quantifies the time the vocal folds spend vibrating:
| (19) |
where tp is the performance time (the time over which a vocalist performs, say, 3 hr per day speaking or singing), and kv is a voicing unit step function (a switch):
| (20) |
The VLI measures the total number of vocal-fold oscillatory periods (in thousands of cycles). It was defined by Rantala and Vilkman (1999) as:
| (21) |
The vibrational distance dose Dd, which quantifies the total distance accumulated by the vocal fold in vibration, can be defined using Equation 13 as
| (22) |
The vibration energy dissipation dose De is obtained by integrating the dissipated power from Equation 9 over time as follows:
| (23) |
Finally, as a way of relating the energy consumption in the vocal folds to the radiated acoustic energy at the mouth, we define radiated energy dose Dr as an integration of the radiated power from Equation 10 over time:
| (24) |
Although this dose does not measure an exposure (at least not to the vocalist), it does offer a potential for assessing the energy dissipation indirectly from a microphone signal, assuming that there is a strong correlation between Dr and De. But this correlation is yet to be established.
Note that the distance dose and the dissipation dose account for both the F0 and intensity variations in phonation, whereas the radiation dose is sensitive only to the voice intensity, the VLI is sensitive only to F0, and the time dose is sensitive to neither F0 nor SPL.
Method for Dose Measurement in Continuous Speech
An experiment was conducted with several speakers to address the following questions: (a) What are the doses in normal speech?, (b) How do the doses vary with different fundamental frequency and intensity patterns in speech?, and (c) how do the doses relate to the safety limits from the hand-transmitted vibrations?
Participants and Equipment Used
Three men and 3 women without voice problems (all of them employees of the National Center for Voice and Speech) served as reading participants for the study. All but 1 were native speakers of English. Because the experiment was designed only to obtain initial data on the doses, gender, racial, and demographic variations were not considered crucial. Each participant was seated in an acoustically treated sound booth with an ambient noise floor of about 54–55 dB (linear frequency weighting). The participants wore a head-mounted dynamic microphone (Shure, Model WH20), with the transducer element off to the side of the mouth and out of the air stream. The mouth-to-microphone distance was about 5 cm, but the distance was not critical as long as it remained constant throughout the recording session, because the microphone signal was ultimately related to SPL at 50 cm through a calibration procedure. The use of a head-mounted microphone made it possible to considerably reduce the ambient room noise as compared to recordings typically made in the far field.
The microphone signal was amplified with a microphone pre-amp (Digital Sound Corp., Model DSC-240), the output of which was passed through an anti-aliasing lowpass filter (Wavetek/Rockland, Model 432 with a cutoff frequency Fc = 8000 Hz) and recorded on the first channel of a digital audiotape (DAT) recorder (Technics, Model SV-DA10) at the sampling rate of 48 kHz. Participants also wore electroglottographic (EGG) electrodes on their neck, and the signal from the EGG preamplifier (Laryngograph) was recorded on the second channel of the DAT recorder. In addition, a sound level meter (SLM; Brüel & Kjaer Model 2238) with an attached microphone was positioned 50 cm from the participant’s mouth, and the acoustic (AC, linearly frequency-weighted) signal from the SLM was recorded on the second channel of the DAT recorder instead of the EGG signal during the SPL calibration procedure.
Recording Procedure
The recording procedure started with a calibration for the absolute SPL measurements. The frequency weighting of the SLM was set to the linear scale. A Brüel & Kjaer Model 4231 calibrator was placed on the SLM microphone and a steady calibration tone with known SPL level (SPLcal) was recorded. The SPL calibrator was then removed and the participant produced a prolonged steady /ɑ/ vowel at a comfortable pitch and loudness. Because this phonation was registered with both the SLM at 50 cm distance and the head-mounted microphone, the procedure allowed finding the relationship between the levels of these two signals. After the calibration recording was done, the SLM signal was replaced by the EGG signal on the second channel of the DAT recorder. No adjustments of the recording level were done on the DAT to keep the recording level of the head-mounted microphone the same as it was during the calibration procedure.
Each participant counted from 11 to 20, in order to register the most comfortable F0 and SPL of the participant. The participant then read an excerpt from the “Goldilocks” passage (Švec, Popolo, & Titze, 2003) with three inflections: monotone, normal, and exaggerated (as if reading to captivate the attention of small children). The purpose of the different inflections was to find out how much the doses change when different F0 and SPL variations are used. No targets were given for SPL or speech rates. After the reading was finished, the EGG signal on the second channel of the DAT recorder was again replaced by the SLM signal and the SPL calibration procedure (prolonged steady /ɑ/ vowel and SPL calibration tone) was repeated for double-check purposes.
Data Processing
The recorded signals were transferred from the DAT recorder to a PC using the DAT interface of the Computerized Speech Lab (Kay Elemetrics, Model 4400) and saved as .wav files. The .wav files were processed in MATLAB in the following way:
The SPL value of the digitized calibration signal from the SLM microphone (computed from the RMS amplitude) was related to the known SPLCAL level. The relationship was used to convert the voltage levels of all the SLM signals to the real acoustic pressures.
The visually steadiest segment of about 1 s duration was selected from the sustained /ɑ/ vowel phonation and the SPL levels of signals from the head-mounted microphone and from the SLM were related. The relationship was used to convert the voltage levels of the head-mounted microphone to the real acoustic pressures at 50 cm distance.
Because the EGG waveform shape is considerably simpler than the pressure waveform of a microphone signal, the EGG signal was chosen as the basis for the detection of the voiced/unvoiced segments of speech and for extraction of the speaking fundamental frequency. The periods were determined from the EGG signal using a specially developed peak-picking algorithm (Švec et al., 2003). The same algorithm also determined the voicing unit step function kV for each period.
The SPL@50 cm and radiated power values (Equation 10) were obtained from the RMS amplitude of the head-mounted microphone signal for each period of the vocal fold vibration from the three readings of the “Goldilocks” passage.
-
The frequency contour, SPL contour, and voicing unit step function kV were obtained for each participant’s reading of the Goldilocks passage over the entire performance time (63–105 s, depending on the speaker) and for each inflection. The contours were in the form of arrays of values, one for each vibratory period. From these arrays, the values of subglottal pressure, vocal fold thickness, vibration amplitude, and dissipated power were derived for each period using Equations 9 and 14–18. The final doses were calculated according to Equations 19–24. Besides the doses, the time-weighted mean values of F0 and SPL@50 cm were also obtained by integrating the F0 and SPL contours over time and dividing by the time dose Dt; that is,
(25) where kv is the voicing unit step function defined previously in Equation 20.
Results
Figure 6 shows an example of data extracted for one participant, F1, a 36-year-old woman. Figure 6a is the so-called speech range profile, a display of many samples of SPL versus F0 in running speech, one data point per vibratory period. The speech range profile can be interpreted much like the traditional voice range profile (also called a phonetogram; e.g., Gramming, 1988; Schutte & Seidner, 1983), except that vocalizations out of the speech context are not included. Dramatic differences between monotone speech (white), normal speech (gray), and exaggerated speech (black) can be noted in terms of SPL and F0 ranges, with the exaggerated speech showing the greatest ranges, as would be expected. Stray points in the profile (far left and far right) are due to uncertainties in F0 (multiple F0 candidates) or uncertainties in the F0 extraction when the EGG waveform was unsteady. (Period extraction from a speech signal is generally problematic, partly because there is not always a uniquely definable period and partly because there does not seem to exist a universal algorithm that would produce satisfactory results for every participant, every purpose, and every recording conditions; Howard, 1998).
Figure 6.

Monotone (white), normal (gray), and exaggerated speech (black) produced by 1 female (F1) participant. The points correspond to the values measured from single vibratory periods. (a) Speech range profiles; (b) subglottal pressure PL; (c) vocal fold thickness T; (d) vocal fold vibratory amplitude A; (e) dissipated power De. The values in the plots (b–e) are derived from the values in (a) using the rules given in Equations 9 and 14–18.
The lower four plots in Figures 6a through 6e show the values derived from the extracted F0 and SPL values. They are plotted against F0 (as in Figure 6a), but they demonstrate the auxiliary variables: extracted subglottal pressure, thickness, vibrational amplitude, and dissipated power that occurred per each cycle of the three different inflections of speech. Note again the differences in these variables for monotone, normal inflection, and exaggerated inflection.
Figure 7 shows the mean F0, mean SPL, performance time tp, and voicing time percentage Dt /tp for each of the 6 participants. The abscissa in each plot is the inflection type (monotone, normal, or exaggerated), so the trends over all participants can be readily discerned for each parameter. Note that both mean F0 and mean SPL can be seen to increase, generally, from monotone speech to exaggerated speech. Exceptions are for Participant F2, whose SPL remained relatively constant throughout, and Participant M3, for whom normal speech had a lower SPL than both monotone and exaggerated speech. It is interesting to note that our SPLs were consistently higher for women than for men (which is not to be generalized to larger populations).
Figure 7.

(a) Mean F0, (b) mean SPL, (c) total performance time tp, and (d) the percentage of voiced segments within the total performance time for the monotone, normal, and exaggerated speech productions of all the participants. Filled symbols and solid lines are used for males, empty symbols and dashed lines for females.
Performance times, or the total times required for reading the passage, varied from slightly over 1 min to slightly under 2 min, with women generally taking less time than men to read the passage (again, not to be generalized). For both sexes, the exaggerated speech generally took the longest time to perform (see Figure 7c). Unlike the performance times, the voicing time percentages did not show clear gender differences (see Figure 7d). The voicing time percentages (Dt /tp) were around 50%, which is in agreement with the voicing percentages reported by other authors for reading (Löfqvist & Mandersson, 1987; Södersten, Granqvist, Hammarberg, & Szabo, 2002). Practically all of the participants showed a minimum voicing time percentage for normal speech, implying the use of relatively longer unvoiced segments in the normal speech type than in the monotone or exaggerated speech type. It should be noted that the participant with the longest performance times and the smallest voicing time percentages, M2, was not a native speaker of English.
Figure 8 shows the five vocal doses accumulated from each participant’s reading of the Goldilocks passage. Except for the time dose Dt, all doses show the highest values for exaggerated speech. Differences between monotone and normal speech type are generally much smaller. As expected, the VLI in Figure 8b, which is directly related to F0, was almost twice as high for women (c. 7,000–12,000 cycles) than for men (c. 4,000–8,000 cycles). The distance dose Dd (see Figure 8c) was the most gender-normalizing of all the doses because there was a trade-off between fundamental frequency and amplitude of vibration across gender. For the Goldilocks passage, Dd ranged from 14 m to 32 m across all participants. The dissipated energy dose De (see Figure 8d) was the only one for which values for men (12–50 mJ/cm3) were consistently higher than for women (5–11 mJ/cm3). This is because dissipated energy weights vibrational amplitude very high (to the square power) and amplitude is higher in men than in women. The radiation dose Dr followed the distance dose for speech type (see Figure 8e). This is encouraging if a microphone signal is to be used to assess vocal dose.
Figure 8.

Vocal doses for the different types of speech. (a) Time dose Dt (Equation 19); (b) vocal loading index (Equation 21); (c) distance dose Dd (Equation 22); (d) energy dissipation dose De (Equation 23); (e) radiated power dose Dr (Equation 24).
All of the doses presented above are representative of continuous reading and for similar performance times (tp about 1.5 min). In order to account for different performance times, it is useful to normalize all the doses to one dose, namely the time dose. These normalized doses then give the amount of exposure per second of continuous voicing (all unvoiced segments excluded). Their mean values and standard deviations are presented in Figure 9. The figure reveals a universal trend for all of the doses—the mean exposures per second are lowest in monotone and highest in exaggerated speech. But the differences are substantially greater for the normalized energy and radiation doses than for the normalized cycle and distance doses.
Figure 9.

Vocal doses normalized per second of voicing (all unvoiced segments disregarded): mean values and standard deviations for male and female participants. (a) Vocal loading index per second; (b) distance traveled by the vocal folds per second; (c) energy dissipated within a cubic centimeter of the vocal fold per second; (d) acoustical energy radiated per second.
The normalized vocal loading index (VLI/Dt) was computed to be 100–150 cycles per second for men and 200–250 cycles per second for women (see Figure 9a). These values should correspond, by definition, to the mean fundamental frequencies in Hz for men and women, which they do. Rantala and Vilkman (1999) hypothesized that the total VLI dose could be seen as an indicator of total number of vocal fold collisions causing damage to vocal fold tissues. The considerably higher number of collisions in women could hypothetically be related to the higher incidence of certain vocal fold pathologies, such as vocal fold nodules, among women (e.g., Heinemann, 1981).
The normalized energy dissipation dose (see Figure 9c) was computed to be 0.39–0.86 mJ for men and 0.16–0.25 mJ for women. This is the heat dissipated per second in a cubic centimeter of the vocal fold tissue. The normalized radiation energy dose (see Figure 9d) was computed to be 0.009–0.036 mJ/s for men and 0.02–0.057 mJ/s for women. This is the acoustic power radiated from the mouth. Women radiated about twice the amount of acoustic energy but dissipated only about half that much at the vocal folds than men, suggesting that they were four times more efficient than men in their voice production. Although we cannot generalize from such a small participant pool, the strong gender trend in efficiency calls for future investigations.
Discussion
In order to relate energy dissipation to possible tissue weakening at a molecular level, it is useful to relate the total heat generated in the tissue to the predicted increase in temperature (ΔT) of the vocal folds. Using the calorimetric equation,
| (26) |
where c is the specific heat capacity (3,470 J kg−1 °C−1 for human tissue (see www.yesican.yorku.ca/home/sh_table.html), m and V are the mass and volume of the vibrating portion of the vocal folds, and ρ is the density of the tissues (1,020 kg/m3, Perlman & Titze, 1988), the temperature increase can be calculated as
| (27) |
When taking the mean values of the dissipation dose De that correspond to normal speech in Figure 8d (i.e., 18.69 mJ/cm3 for men and 6.41 mJ/cm3 for women), we obtain a temperature increase of only 0.005 and 0.002 °C, respectively, for the length of the Goldilocks passage (about 1.5 min). This calculation disregards the heat convection away from the vocal folds by the air-stream and blood circulation, which would make the temperature rise even smaller. The small magnitude of this temperature change agrees with the experimental data of Cooper and Titze (1985), who found a greater fraction of a °C, but over a proportionately longer time period. These results suggest that heat dissipated in the vocal folds probably does not play a very important role in tissue damage.
Next, consider the safety limit of 520 m accumulated distance derived before, which places the likely cause of tissue damage on repetitive acceleration and deceleration, or the “whiplash effect.” How long would one have to speak to reach that limit? Considering the derived mean value of Dt/tp (0.5 m/s for both men and women; see Figure 9b) and continuous phonation with no silent periods (i.e., voicing ratio Dt/tp = 1), the safe performance time would be 1,040 s, or approximately 17 min. For exaggerated speech values, with greater distance traveled per second, this time would be even shorter.
The unvoiced pauses during speech, however, decrease the voicing ratio, which prolongs the safe performance time. Considering a voicing ratio of about 0.5 (50% was measured for normal reading; see Figure 7d) the safe performance time doubles to 2,080 s, or about 35 min. This example illustrates the importance of voicing pauses in vocalization. Besides prolonging the safe performance time, it is hypothesized that the voicing pauses (which could vary from a fraction of a second to several hours) can also allow the vocal fold tissues to recover from the acceleration stress. The active biological recovery of tissue is expected to raise the safety limits toward higher values (i.e., more than the 520 m limit of accumulated distance and, consequently, even longer performance times). Also, the structure of the vocal folds, which may be better adapted for the vibration than the tissue of hands, could raise the 520 m safety limit toward higher values. Unfortunately, the recovery effect of the voicing pauses, as well as the quantitative effect of the different structure on the safety limit, are totally unknown at this point. Their determination appears to be an important task for future studies that quantify long-term exposure of vocal folds to vibration.
Conclusion
Several vocal doses were defined to quantify the effect of vocal fold exposure to vibration. Whereas previously defined dose measures quantified only the vocal accumulation time and the total number of cycles (based on F0), the present study introduced two new doses that quantify accumulated distance and dissipated energy. These doses take into account vocal intensity. Empirical rules were derived that allow calculation of all the doses from the F0 and SPL values measured from speech over time. Apart from the time dose, all the doses increased when greater F0 and SPL variations were used; that is, the vocal load was greater for exaggerated speech than for normal or monotone speech.
The accumulated distance traveled by the vocal folds was linked to a safety limit (520 m) derived from industry standards for hand-transmitted vibrations. It was found that vocal folds travel about 0.5 m per second of continuous phonation, which suggests that the safety distance of 520 m can be reached after 17 min of continuous vocalization. Because this seems unusually stringent according to personal experience, the silent pauses in vocalization are hypothesized to be important for raising the safety limit and prolonging the safe performance time. The nature of tissue recovery over seconds, minutes, hours, and even days needs to be addressed in future studies.
The total amount of energy dissipated as heat was estimated to be very small and is thus deemed of lesser importance for the possible damage of the vocal folds. Rapid acceleration and deceleration (a kind of “whiplashing” of the tissue), as well as the repetitive collisions of the vocal folds, would appear to pose the greater threat of injury.
Acknowledgments
The work was supported by National Institutes of Health Grant DC RO1 04224-01.
Contributor Information
Ingo R. Titze, University of Iowa, Iowa City and National Center for Voice and Speech, The Denver Center for the Performing Arts Denver, CO
Jan G. Švec, National Center for Voice and Speech, The Denver Center for the Performing Arts Denver, CO
Peter S. Popolo, National Center for Voice and Speech, The Denver Center for the Performing Arts Denver, CO
References
- Airo E, Olkinuora P, Sala E. A method to measure speaking time and speech sound pressure level. Folia Phoniatrica et Logopaedica. 2000;52:275–288. doi: 10.1159/000021545. [DOI] [PubMed] [Google Scholar]
- Buekers R, Bierens E, Kingma H, Marres EHMA. Vocal load as measured by the voice accumulator. Folia Phoniatrica et Logopaedica. 1995;47:252–261. doi: 10.1159/000266359. [DOI] [PubMed] [Google Scholar]
- Chan RW, Titze IR. Viscosities of implantable biomaterials in vocal fold augmentation surgery. The Laryngoscope. 1998;108:725–731. doi: 10.1097/00005537-199805000-00019. [DOI] [PubMed] [Google Scholar]
- Chan RW, Titze IR. Viscoelastic shear properties of human vocal fold mucosa: Measurement methodology and empirical results. Journal of the Acoustical Society of America. 1999;106:2008–2021. doi: 10.1121/1.427947. [DOI] [PubMed] [Google Scholar]
- Cooper DS, Titze IR. Generation and dissipation of heat in vocal fold tissue. Journal of Speech and Hearing Research. 1985;28:207–215. doi: 10.1044/jshr.2802.207. [DOI] [PubMed] [Google Scholar]
- Fung YC. Biomechanics: Mechanical properties of living tissues. New York: Springer Verlag; 1980. [Google Scholar]
- Fung YC. A first course in continuum mechanics. 3. Englewood Cliffs, NJ: Prentice-Hall; 1994. [Google Scholar]
- Gramming P. The phonetogram: An experimental and clinical study. Monograph, Lund University; Malmö, Sweden: 1988. [Google Scholar]
- Granqvist S. The self-to-other ratio applied as a phonation detector for voice accumulation. Poster presented at the 4th Pan European Voice Conference; Stockholm, Sweden. 2001. Aug, Retrieved [DATE] from http://www.speech.kth.se/~svante/aura Retrieved December 30, 2002. [DOI] [PubMed] [Google Scholar]
- Griffin MJ. Handbook of human vibration. New York: Academic Press; 1990. [Google Scholar]
- Heinemann M. Stimmlippenknötchen—auch eine Definitionsfrage [Vocal cord nodules—a problem of definition as well] Sprache–Stimme–Gehör. 1981;5:27–31. [Google Scholar]
- Hollien H. The relationship of vocal fold thickness to absolute fundamental frequency of phonation. Proceedings of the Fourth International Congress of Phonetic Sciences; Helsinki. 1961; The Hague, The Netherlands: Mouton; 1962. pp. 173–177. [Google Scholar]
- Hollien H, Colton RH. Four laminagraphic studies of vocal fold thickness. Folia Phoniatrica. 1969;21:179–198. doi: 10.1159/000263250. [DOI] [PubMed] [Google Scholar]
- Hollien H, Curtis J. Laminagraphic study of vocal pitch. Journal of Speech and Hearing Research. 1960;3:361–371. doi: 10.1044/jshr.0304.361. [DOI] [PubMed] [Google Scholar]
- Hollien H, Moore GP. Measurements of the vocal folds during changes in pitch. Journal of Speech and Hearing Research. 1960;3:157–165. [Google Scholar]
- Howard DM. Instrumental voice measurement: Uses and limitations. In: Harris T, Harris S, Rubin JS, Howard DM, editors. The voice clinic handbook. London: Whurr; 1998. pp. 323–382. [Google Scholar]
- Löfqvist A, Mandersson B. Long-time average spectrum of speech and voice analysis. Folia Phoniatrica. 1987;39:221–229. doi: 10.1159/000265863. [DOI] [PubMed] [Google Scholar]
- Masuda T, Ikeda Y, Manako H, Komiyama S. Analysis of vocal abuse: Fluctuations in phonation time and intensity in 4 groups of speakers. Acta Oto-Laryngologica (Stockholm) 1993;113:547–552. doi: 10.3109/00016489309135861. [DOI] [PubMed] [Google Scholar]
- Nishizawa N, Sawashima M, Yonemoto K. Vocal fold length in vocal pitch change. In: Fujimura O, editor. Vocal fold physiology: Voice production, mechanisms and functions. New York: Raven Press; 1988. pp. 75–82. [Google Scholar]
- Ohlsson AC, Brink O, Löfqvist A. A voice accumulator—validation and application. Journal of Speech and Hearing Research. 1989;32:451–457. doi: 10.1044/jshr.3202.451. [DOI] [PubMed] [Google Scholar]
- Perlman AL, Titze IR. Development of an in vitro technique for measuring the elastic properties of the vocal fold tissue. Journal of Speech and Hearing Research. 1988;31:288–298. doi: 10.1044/jshr.3102.288. [DOI] [PubMed] [Google Scholar]
- Rantala L, Haataja K, Vilkman E, Körkkö P. Practical arrangements and methods in the field examination and speaking style analysis of professional voice users. Scandinavian Journal of Logopedics and Phoniatrics. 1994;19:43–54. [Google Scholar]
- Rantala L, Vilkman E. Relationship between subjective voice complaints and acoustic parameters in female teachers’ voices. Journal of Voice. 1999;13:484–495. doi: 10.1016/s0892-1997(99)80004-6. [DOI] [PubMed] [Google Scholar]
- Ryu S, Komiyama S, Kannae S, Watanabe H. A newly devised speech accumulator. Journal for Oto-Rhino-Laryngology and its Related Specialties. 1983;45:108–114. doi: 10.1159/000275632. [DOI] [PubMed] [Google Scholar]
- Schutte HK, Seidner W. Recommendation by the Union of European Phoniatricians (UEP): Standardizing voice area measurement/phonetography. Folia Phoniatrica. 1983;35:286–288. doi: 10.1159/000265703. [DOI] [PubMed] [Google Scholar]
- Södersten M, Granqvist S, Hammarberg B, Szabo A. Vocal behavior and vocal loading factors for preschool teachers at work studied with binaural DAT recordings. Journal of Voice. 2002;16:356–371. doi: 10.1016/s0892-1997(02)00107-8. [DOI] [PubMed] [Google Scholar]
- Švec JG, Popolo PS, Titze IR. The Goldilocks passage and scripts for frequency extraction, voicing detection, SPL calculation, and vocal dose determination in speech. National Center for Voice and Speech online technical memo. 2003 April; Available from http://www.ncvs.org/ncvs/library/tech.
- Szabo A, Hammarberg B, Södersten M, Granqvist S. Simultaneous recordings with a voice accumulator and a DAT-recorder—pre-school teachers’ voices at work. Lecture presented at the 4th Pan European Voice Conference; Stockholm, Sweden. 2001. Aug, [Google Scholar]
- Titze IR. On the relation between subglottal pressure and fundamental frequency in phonation. Journal of the Acoustical Society of America. 1989a;85:901–906. doi: 10.1121/1.397562. [DOI] [PubMed] [Google Scholar]
- Titze IR. Physiologic and acoustic differences between male and female voices. Journal of the Acoustical Society of America. 1989b;85:1699–1707. doi: 10.1121/1.397959. [DOI] [PubMed] [Google Scholar]
- Titze IR. Phonation threshold pressure: A missing link in glottal aerodynamics. Journal of the Acoustical Society of America. 1992;91:2926–2935. doi: 10.1121/1.402928. [DOI] [PubMed] [Google Scholar]
- Titze IR. Principles of voice production. Iowa City, IA: National Center for Voice and Speech; 2000. [Google Scholar]
- Titze IR, Sundberg J. Vocal intensity in speakers and singers. Journal of the Acoustical Society of America. 1992;91:2936–2946. doi: 10.1121/1.402929. [DOI] [PubMed] [Google Scholar]
- Vintturi J. Doctoral dissertation. University of Helsinki; Helsinki, Finland: Hakapaino Oy: 2001. Studies on voice production with a special emphasis on vocal loading, gender, some exposure factors and intensity regulation. Available from http://ethesis.helsinki.fi. [Google Scholar]
- Ward WD, Turner CW. The total energy concept as a unifying approach to the prediction of noise trauma and its application to exposure criteria. In: Hamernik RP, Henderson D, Salvi R, editors. New perspectives on noise-induced hearing loss. New York: Raven Press; 1982. pp. 423–435. [Google Scholar]
- Watanabe H, Shin T, Oda M, Fukaura J. Measurement of total speaking time in a patient with spastic dysphonia. Folia Phoniatrica. 1987;39:65–70. doi: 10.1159/000265840. [DOI] [PubMed] [Google Scholar]