Abstract
The quantitative determination of 48 molecular species of regioisomeric diacylglycerols has been made in a single analysis of an extract of bone marrow derived macrophages. The analytical procedure involves solvent extraction of neutral lipids, including diacylglycerols, derivatization of free hydroxyl moieties as 2,4-difluorophenyl urethane, and analysis by normal phase liquid chromatography-tandem mass spectrometry. The derivatization step not only prevents fatty acyl group migration, thus allowing determination of both 1,2- and 1,3-diacylglycerols, but also yields species that are sensitively and uniquely determined by constant neutral loss mass spectrometry. The method also detected monoacylglycerols, which were characterized by unique retention time and collisional spectra, and were present in mouse bone marrow derived macrophage extracts.
Keywords: diacylglycerol, normal phase, electrospray, diflurophenyl urethane derivative, neutral loss, lipid, monoacylglycerols, diacylglycerols
1. Introduction
There are numerous neutral lipids present in cells that play diverse roles in biochemistry, including the fatty acyl esters of glycerol. The diacylglycerols (DAGs) which have two fatty acyl substituents on the glycerol backbone play important roles in both the biosynthesis of neutral lipids such as triacylglycerols (TAGs) and products of metabolism of TAGs as well as being precursors of certain glycerophospholipids; for example, the reaction of CDP nucleotides derivatives, such as CDP choline, with a 1,2-DAG forms a diacyl glycerophosphocholine [1]. In addition, the breakdown of triacylglycerols can lead to regioisomeric compounds such as 1,2-DAG, 1,3-DAG as well as 2,3-DAG by enzymatic or nonenzymatic ester hydrolysis [2]. The 1,2-DAGs can also arise from the cleavage of phosphatidylinositols by phospholipase C, where the 1,2-DAGs serve as signaling molecules in activation of protein kinase C [3]. The 1,3-DAGs can arise from chemical isomerization of 1,2-diacylglycerols [4]. It is also possible to ingest 1,3-DAGs, which are metabolized by different pathways, that do not become a part of the TAG pool present in chylomicrons [5]. DAGs, in general, play a central role in many aspects of cellular lipid biochemistry, both as intermediates in neutral lipid metabolism, biosynthesis, as well as being biologically active products in their own right.
There have been several methods described for the measurement of diacylglycerols with various levels of sensitivity and specificity for regioisomeric species [6–8]. Most recently, electrospray ionization mass spectrometry has been used to measure the quantity of diacylglycerols both as the protonated and sodiated products using homolog internal standards to establish a quantitative assay [9]. This technique simply involved infusion of the sample after chromatographic isolation of diacylglycerols by normal phase (silica-based) chromatography. An improvement in sensitivity of analysis was described after derivatization of diacylglycerols with a quaternary ammonium compound (N-chlorobetainyl chloride) followed by infusion to generate abundant positive ions which could be quantitated again using a homolog internal standard [10]. Neither of these techniques discerned 1,2- from 1,3-regioisomers of diacylglycerols.
The present study was undertaken with a somewhat different goal in mind, namely one to assess the relative quantity of 1,2-diacylglycerols versus 1,3-diacylglycerols that could be found in cells following cellular activation. For this method a simplified extraction system was employed, which reduced the complexity of lipid species extracted when compared to a more general chloroform/methanol based solvent extraction system [11]. The regioisomeric DAGs were then separated by normal phase HPLC coupled to positive ion electrospray ionization tandem mass spectrometry after derivatization of the free hydroxyl group to a diacyl urethane using 2,4-difluorophenyl isocyanate. Monoacylglycerols were also detected in the cell extraction of neutral lipids.
2. Materials and Methods
2.1 Chemicals
HPLC grade solvents: acetonitrile, ammonium acetate, dichloromethane (DCM), isooctane, methyl tert-butyl ether (MTBE) were obtained from Fisher Scientific. The derivatization reagent, 2,4-diflourophenyl isocyanate, was purchased from Acros Organics and dimethyl-4-aminopyridine was purchased from Sigma-Aldrich. Ammonium acetate was purchased from Fisher Scientific. Synthetic 1,3-eicosanoyl-2-hydroxy-sn-glycerol-d5 (1,3-20:0/20:0-d5 DAG internal standard), 1,3-dihexadecanoyl-2-hydroxyl-sn-glycerol (16:0/16:0 DAG), 1,2-dihexadecanoyl-3-hydroxy-sn-glycerol (1,2-16:0/16:0 DAG) 1,2-dioctadecanoyl-3-hydroxy-sn-glycerol (1,2-18:0/18:0 DAG), 1,3-dimyristoyl-2-palmitoleoyl-glycerol-d5 (14:0/16:1/14:0 TAG internal standard) were obtained from Avanti Polar Lipids (Alabaster, AL) and dissolved in toluene at a concentration of 1 mg/mL. [13C18:1]-octadecadienoyl cholesterol ester was synthesized as previously described [11] and used as the cholesterol ester internal standard.
2.2 Extraction of cellular neutral lipids
The general extraction scheme employed essentially followed the previously reported method [11]. The bone marrow derived macrophages were obtained from Dr. C. Glass (University of California, San Diego) after differentiating bone marrow cells with macrophage colony stimulating factor for 16 h [12]. These cells were chosen for these studies as a representative case of diacylglycerol production in cells carried under culture conditions. Cell pellets were received in 1 mL buffer frozen on dry ice and stored at −70°C until extracted. The quantity of DNA present in these cell suspensions had been previously determined [13]. Prior to extraction the samples were thawed at room temperature and then were extracted in their original glass culture tube. Dulbecco's phosphate buffered saline (1 mL) was added to the samples and thoroughly mixed. The internal standards (isotope labeled DAG, TAG, and cholesterol ester; 25 ng, 25 ng, and 250 ng, respectively) were added and the sample extracted twice with 2 mL of 25% ethyl acetate/isooctane. The samples were then centrifuged at 3,000 RPM for 3 min. The organic (upper) layers were combined in a previously solvent-rinsed culture tube. The solvent was removed under a gentle stream of nitrogen and the extract was reconstituted in DCM (100 µL).
2.3 Derivatizations of DAG species
An aliquot of the extract was treated with 10 µL 2,4-diflourophenyl isocyanate in DCM (10 µg/µL) and 10 µL dimethyl-4-aminopyridine in DCM (10 µg/µL), followed by the addition of 400 µL DCM. The sample was then sealed with a Teflon-lined screw cap and placed in a 60°C hot plate. After 30 min, the DCM solution was cooled to room temperature and transferred to a 0.8 mL crimp-top LC vial and reduced to dryness under a gentle stream of nitrogen. The extract was reconstituted with 4% MTBE/isooctane (50 µL). The tube was sealed with a Teflon-lined crimp-top and analyzed using scheduled LC/MS/MS and LC/MS protocols for cholesterol esters (CE), monoetherdiacylglycerols (MeDAGs), and TAGs [11] along with the DAG analysis described below. The yield for this derivatization was typically between 85 – 90% which could be assessed by LC/MS analysis after derivatization followed by extraction of the ions corresponding to the [M+NH4]+ for the internal standard DPFU derivative at m/z 858.8 and comparison to the underivatived [M+NH4]+ at m/z 703.7 eluting at 31.8 min (Supplemental Figure 1).
2.4 Liquid chromatography electrospray ionization mass spectrometry
Chromatographic separations were conducted on a normal phase Phenomenex Luna 5 µm particle size, 150 mm × 2 mm id silica column. Total flow into the mass spectrometer (AB Sciex 4000 QTRAP linear ion trap quadrupole mass spectrometer, Thornhill, Ontario, Canada) was 0.2 mL/min. A linear normal phase solvent gradient system was generated using 100% isooctane (mobile phase A) and mobile phase B, MTBE/isooctane (1/1) from 8% mobile phase B for the first 7 min, then raised to 30% from 7 min to 25 min, then raised from 30% to 90% from 25 min to 29 min and held at 90% mobile phase B for 2 min. The column was then re-equilibrated back to 8% mobile phase B. For these separations 1 µL sample was injected onto the column using an autosampler.
2.5 Mass spectrometry
The derivatized DAG species were analyzed using electrospray ionization conditions in the positive ion mode as the ammonium adduct ion. In order to generate this charged adduct species, a 10 mM ammonium acetate (95% acetronitrile/5% water) solution was introduced post-column just prior to the electrospray interface at a flow-rate of 0.030 mL/min. The various gas flows were set at the following values as described by the manufacturer: entrance plate temperature (300°C), curtain gas (10 psi), collision gas (7 psi), ion source gas (1–40 psi), ion source gas (2–20 psi), ion spray (5500 volts), de-clustering potential (85 volts), entrance potential (9 volts). For the analysis of the diacylglycerol derivatives a mass range from 500 to 1200 daltons was scanned at a rate of 4.0 s/scan. For quantitative experiments constant neutral loss operation was employed with a mass offset between quadrupole-1 and quadrupole-3 mass filters of 190.1 daltons. For those experiments the collision cell was filled with nitrogen (0.01 torr) and collision energy of 80 volts (laboratory frame of reference) employed. For quantitative analysis of the 1,3- and 1,2-DAGs, standard curves using the unlabeled 1,3-16:0/16:0 DAG and 1,2-18:0/18:0 DAG as well as 1,2-16:0/16:0 DAG as reference material. Various quantities of reference standards as well as a constant amount of internal standard (1,3-20:0/20:0-d5 DAG) were derivatized with DFP isocyanate an analyzed by LC/MS/MS by neutral loss of 190u. Ratioing the neutral loss ion signal from these reference standards to the same neutral loss for the internal standard generated 1,2- and 1,3-DAG calibration curves which were found to be linear over the range from 1–60 pmoles using 25 ng of d5 internal standard added to samples (Supplemental Figure 2).
3. Results
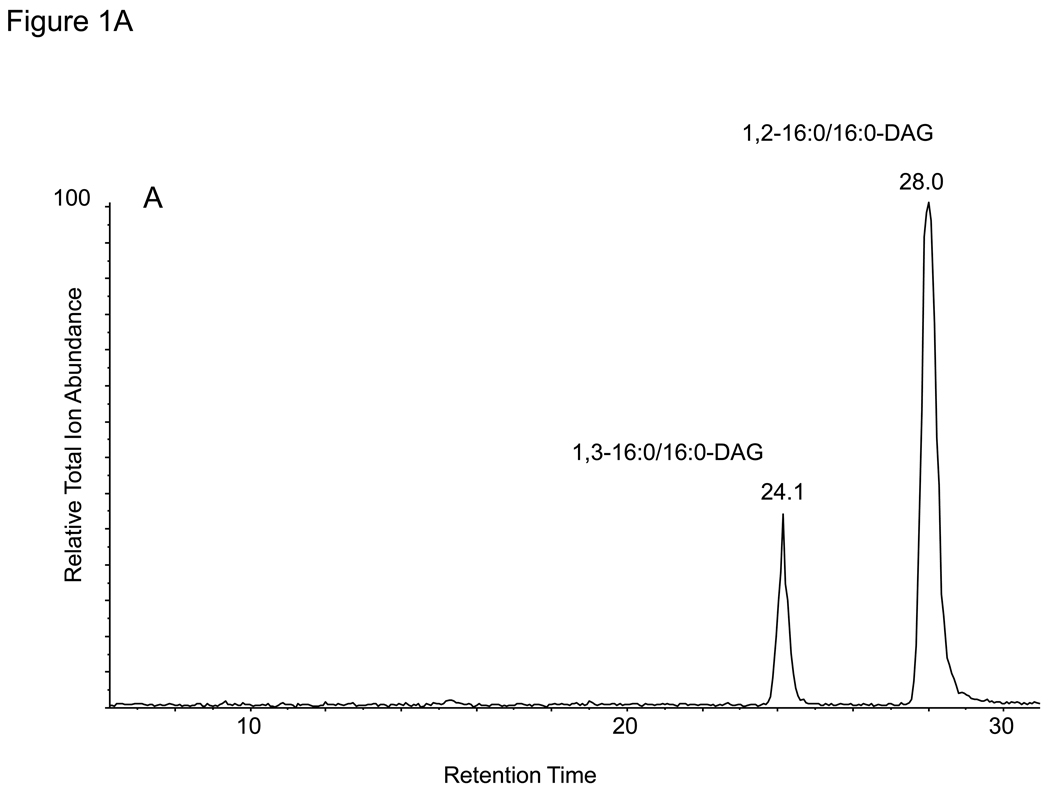
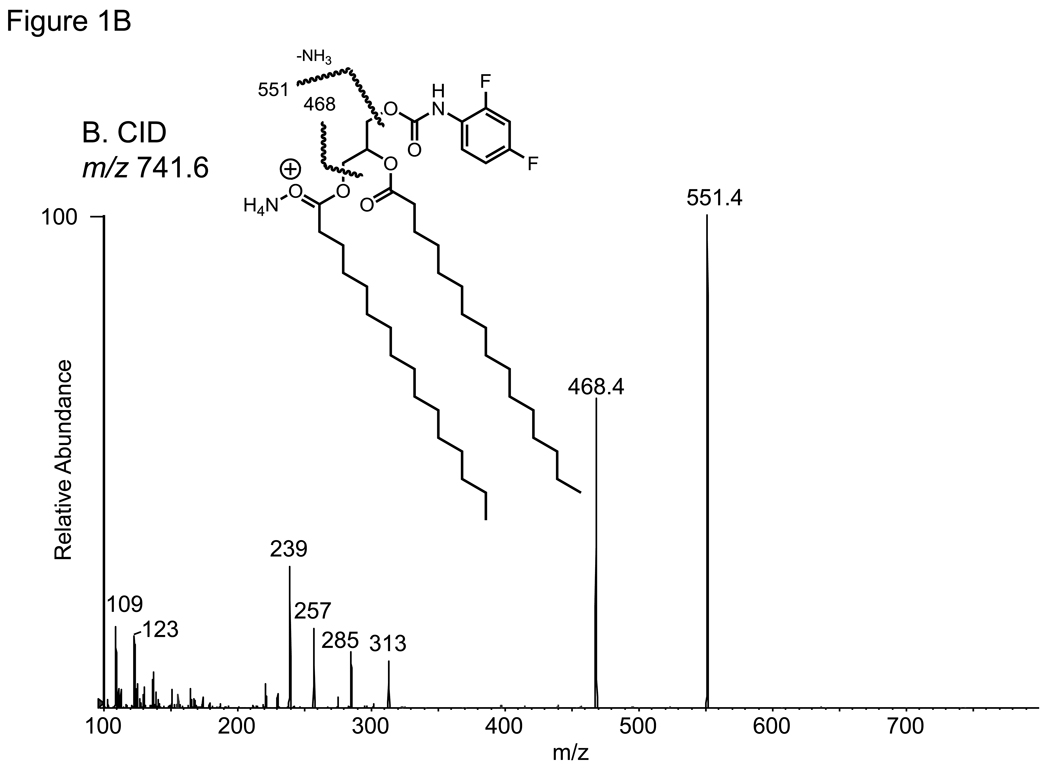
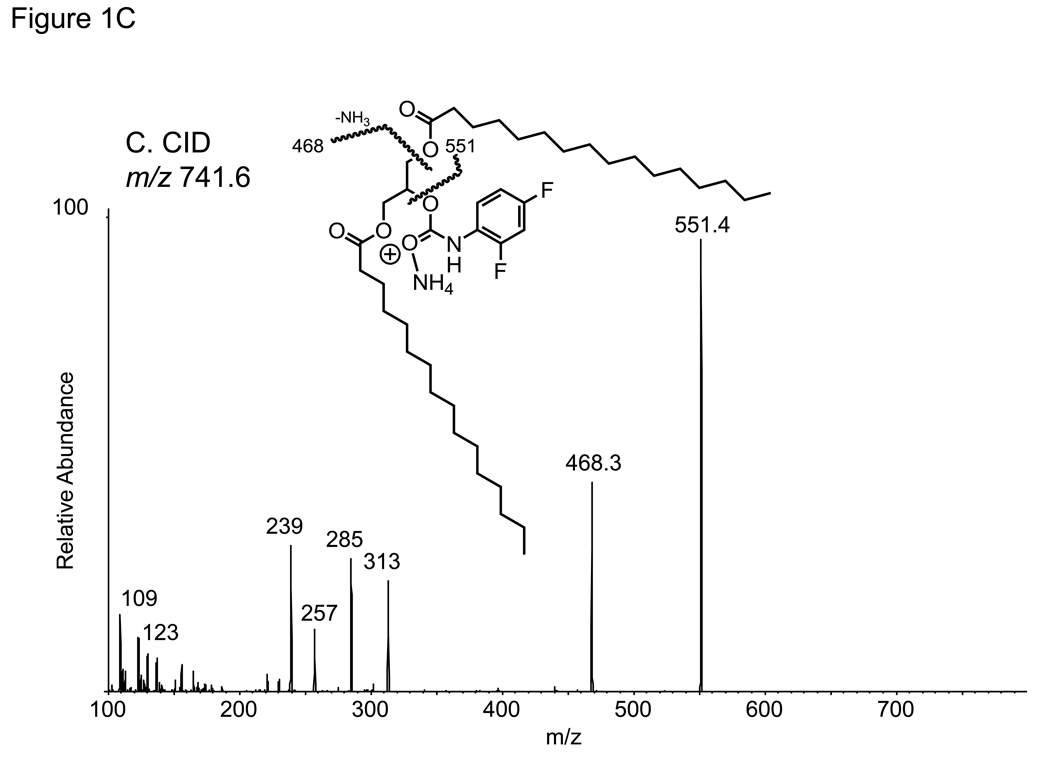
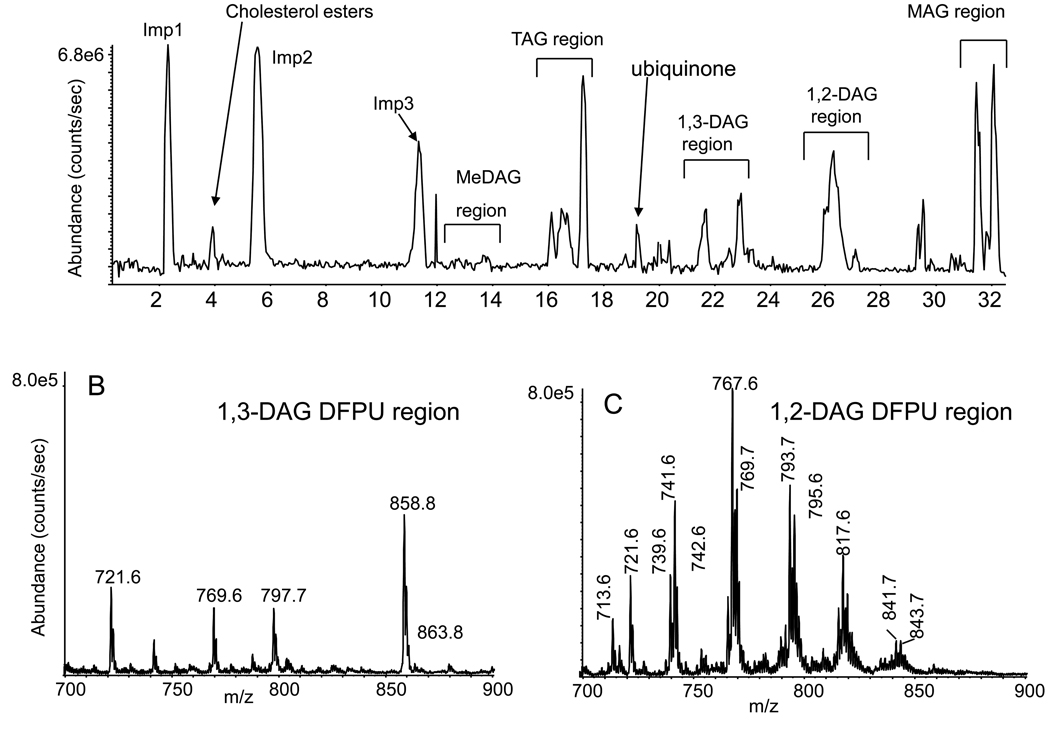
The analysis of DAG molecular species as the 2,4-difluorophenyl urethane (DFPU) derivatives were chosen because of favorable normal phase HPLC properties as well as ease of formation. Previous work on the separation of urethane derivatives of diacylglycerols by chiral phase HPLC [14] revealed excellent separation for both 1,3-DAG and 1,2-DAG derivatives. The DFPU derivatives were found to retain that behavior in a normal phase separation of synthetic 1,3-dipalmitoyl-DAG-DFPU from 1,2-dipalmitoyl-DAG-DFPU (Figure 1A). While each naturally occurring 1,3-DAG-DFPU molecular species in a biological extract had somewhat different retention times, all 1,3-DAG-DFPU species eluted first and were well separated from 1,2-DAG-DFPU molecular species (Figure 2A). The positive ion electrospray mass spectra of the regioisomeric 32:0-DAG derivatives were identical, yielding abundant [M+NH4]+ ions observed at m/z 741.5 (data not shown). Collisional activation of the 1,3- and 1,2-isobaric [M+NH4]+ ions from each isomer yielded essentially identical product ions (Figure 1B and 1C). The most abundant ion corresponded to the neutral loss of 190.1 daltons and neutral loss of 273 daltons, corresponding to the loss of difluorophenyl carbamic acid plus ammonia and hexadecanoic acid plus ammonia (C15H31COOH + NH3), respectively. This collisional activation of triester [M+NH4]+ ions, leading to the loss of a free acid plus ammonia, has been previously described for the TAGs [15].
Figure 1.
(A) Normal phase HPLC separation of 1,2- and 1,3-dihexadecanoyl diacylglycerol (1,2-16:0/16:0 DAG and 1,3-16:0/16:0 DAG) as the difluorophenyl urethane derivatives (DFPU). (B) Collision-induced dissociation of the [M+NH4]+ ion of 1,2-16:0/16:0 DAG-DFPU at m/z 741.6. The ion at m/z 551.4 corresponds to the loss of 190.1 u. (C) Collision-induced dissociation of the [M+NH4]+ ion of 1,3-16:0/16:0 DAG-DFPU ion at m/z 741.6.
Figure 2.
(A) Normal phase LC/MS analysis (base peak chromatogram) of the neutral lipids extracted from bone marrow cells differentiated in culture to macrophages, then derivatized with difluorophenyl isocyanate to the urethane derivative of the free hydroxyl moiety. Regions of the elution of neutral lipids are indicated. Imp1 is a mixture of polysiloxanes and Imp2 is the oxidized form of a plastic antioxidant (tris(2,4-ditert-butylphenyl)phosphate) and Imp3 is the elution of phthalate esters. (B) Summation of ions [M+NH4]+ 1,3-DAG-DFPU derivatives eluting between 22.5–23.8 min. The added internal standard of d5-glycerol 20:0/20:0-DAG-DFPU derivatized at m/z 858.8 elutes in this area. (C) Summation of the ions [M+NH4]+ from the 1,2-DAG-DFPU derivatives eluting between 25.5–27.1 min.
Derivatization of the neutral lipid extract derived from bone marrow derived macrophage cells resulted in the separation of a number of different classes of neutral lipids by the normal phase HPLC (LC/MS and LC/MS/MS analysis). TAG and DAG species (Figure 2A) could be detected, but additional components were clearly eluting including phthalate esters and ubiquinone as previously reported [11]. Several 1,3-DAG molecular species were observed and their distribution of molecular species was somewhat different for the 1,2-DAG molecular species in that the most abundant 1,3-DAG components corresponded to 18:0/18:0-DAG DPFU (m/z 797.7) and 16:0/18:0-DAG DPFU (m/z 769.7), but 16:0/18:1-DAG DPFU was the most abundant for the 1,2-DAG derivative (m/z 767.6). The ion at m/z 721.6 was identified as a contaminant from the plastic-ware used to store cell pellets. The abundance of 1,2-DAG-DFPU was considerably higher than each corresponding 1,3-DAG DPFU. The mass spectra from the 1,3-DAG DPFU and 1,2-DAG DPFU regions (Figures 2B and 2C) revealed minimal sodium or potassium ion adducts of these molecular ion species as expected due to the presence of 10 mM ammonium acetate buffer in the mobile phase. The only evidence for these metalated adducts was observed for the abundant ion at m/z 858.8 from the 1,3-20:0/20:0-d5 DAG at m/z 863.8 (Figure 2B), but it was less than 5% of the [M+NH4]+ ion abundance.
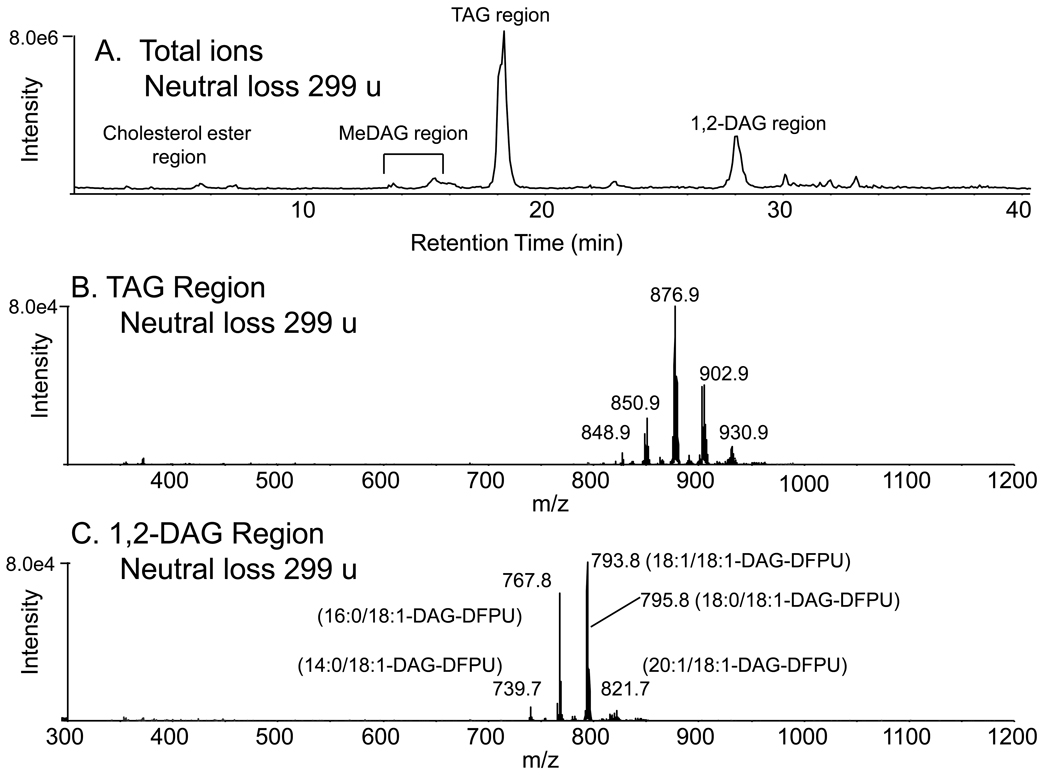
A neutral loss strategy could be employed to detect elution of molecular species containing any fatty acyl group by using a mass loss scan corresponding to the loss of the specific free fatty acid plus ammonia. This scan function was performed on an identical aliquot of derivatized macrophage neutral lipids and resulted in significant improvement in detection of TAGs and DAGs. For example, it was possible to determine if any of the DAGs contained oleic acid by carrying out a neutral loss scan of 299.2 daltons and observing those [M+NH4]+ ions which, after collisional activation, generated product ions with this constant neutral loss behavior (Figure 3A). Those TAGs and 1,2-DAG-DFPUs containing oleate were readily detected (Figure 3B and 3C, respectively). The same behavior has been used to detect triacylglycerols containing unique fatty acids [11], although it is not possible to unambiguously determine each of the other fatty acyl groups in the TAG molecular species without MS3 experiments. In the case of the analysis of DAG derivatives, the identification of one fatty acyl group present in either 1,3- or 1,2-DAG derivative defines the second fatty acyl group that would make up the molecular weight of the compound, since the third substituent of the glycerol was the common difluorophenyl urethane. Although it is not possible to determine the position of the fatty acyl groups, this method does permit a better structural description of the diacylglycerol molecular species.
Figure 3.
(A) Normal phase LC/MS/MS analysis of the same derivatized neutral lipid extract in Figure 2 using neutral loss scanning of 299 u corresponding to loss of oleic acid plus ammonia (NH3) from the [M+NH4]+ ions. (B) Molecular ion species of triacylglycerols contain oleoyl (18:1) fatty acyl group. (C) Molecular ion species of 1,2-DAG-DFPU derivatives that contain oleoyl fatty acyl chains. The fatty acyl content of each [M+NH4]+ are indicated but no position of esterification on the glycerol backbone is implied.
3.1 Quantitation of DAG-DFPU derivatives
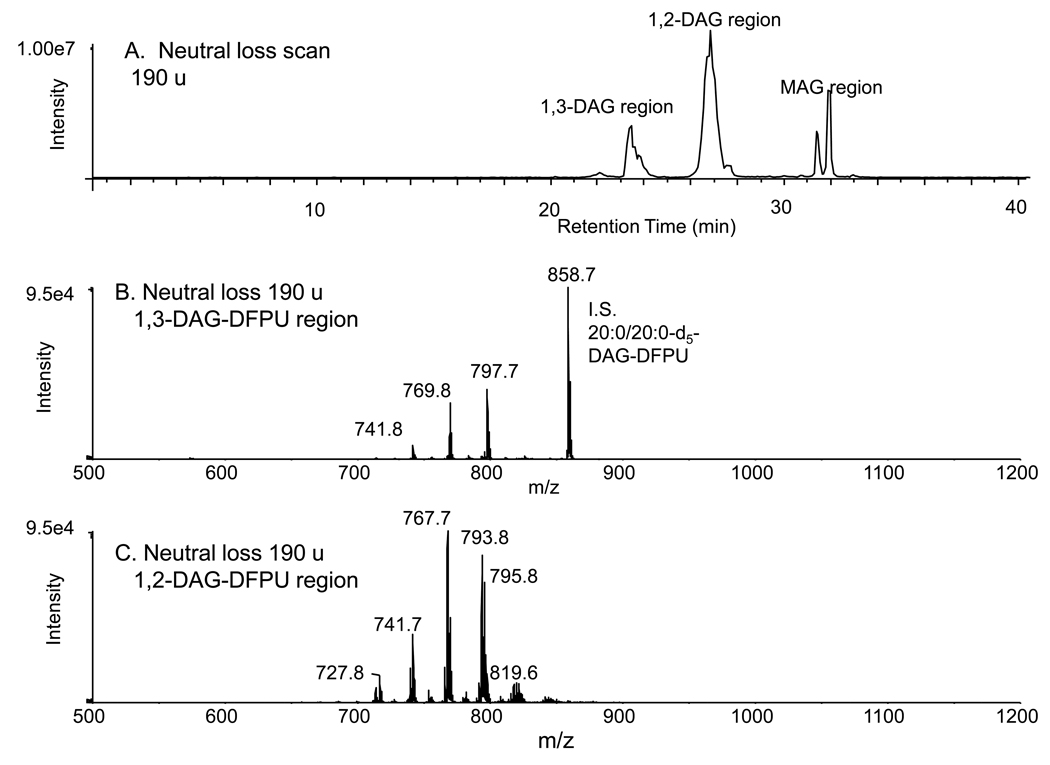
Since the DAG-DFPU derivatives have a common structural feature of the DFPU substituent, it was possible to use neutral loss scanning of 190.1 daltons to find all DFPU adducts in a neutral lipid extract (Figure 4). This neutral loss strategy was carried out on an identical aliquot of macrophage neutral lipid extract and was found to profoundly enhance signal-to-noise as seen in the 1,2-diacylglycerol-DFPU profile (eluting between 25.7 and 28.0 min in Figure 4) when compared to just single quadrupole scanning.
Figure 4.
(A) Normal phase LC/MS/MS analysis of the derivatized neutral lipid extract of bone marrow derived macrophages using neutral loss scanning of 190 u corresponding to the loss of the difluorophenyl carbamic acid plus ammonia from the [M+NH4]+ions. (B) The 1,3-DAG-DFPU molecular species eluting between 22.5–25 min including the 1,3-20:0/20:0-DAG added as internal standard. (C) The 1,2-DAG-DFPU molecular species eluting between 26 and 28 min.
This neutral loss scan was found to be an excellent approach to carry out quantitative analysis of both 1,2- and 1,3-DAG-DFPU derivatives. A single internal standard (1,3-dieicosanoyl-d5-glycerol), that appears in the 1,3-DAG region at m/z 858.7, was employed to normalize the neutral loss signals after establishing a standard curve with synthetic 1,3- and 1,2-DAG standards (Supplemental Figure 2). While standard curves using three different DAG reference standards were found to be quite linear for this neutral loss method, there were differences in slopes depending upon the exact number of carbon atoms in each fatty acyl group and total number of double bonds. Such behavior has been previously described [16]. A current limitation in DAG analysis is the very small number of DAG standards (both 1,3- and 1,2-DAGs) available along with restricted diversity in fatty acyl groups. These limitations reduce the overall absolute accuracy of this method, but will not affect, in a major way, the precision or differential accuracy in measuring changes in the same species when parallel experiments are used to follow differences in molecular species content.
3.2 Peritoneal macrophage DAG analysis
This neutral loss method was used to identify the 1,3- and 1,2-DAGs present in the bone marrow cells incubated for 16 h to differentiate into a macrophage phenotype by macrophage colony stimulating factor [12]. Over 30 different 1,2-DAG species could be identified and quantitated while ten 1,3-DAG molecular species were observed (Table 1). In all cases, the 1,2-DAG species were over 10-fold more abundant than the 1,3-DAG molecular species (Figure 4B and 4C) and the exact profile of major species of either 1,3-DAG were different from the major species of 1,2-DAG species. The saturated 1,3-DAG (34:0 and 36:0) molecular species were more abundant in the procedural blanks suggesting contamination with these regioisomers (Supplemental Figure 3). This was not the case for 1,2-DAG (34:0 and 36:0) species which were more than 15-fold lower in the procedural blank. These contaminants did not interfere with the analysis of samples as long as a procedural blank was determined which enabled subtraction of these saturated molecular species quantities from the biological 1,3- and 1,2-DAG DPFU values.
Table 1.
Concentrations of 1,3- and 1,2-DAG-DFPU in bone marrow derived mouse cells differentiated to bone marrow macrophages by MCSF exposure for 16 h.
| DAG Molecular Species1 |
[M+NH4]+ m/z |
1,2-DAG-DFPU2 (fmol/µg DNA) |
1,3-DAG-DFPU (fmol/µg DNA) |
|---|---|---|---|
| 30:1 | 711.5 | 0.9 ± 0.2 | nd3 |
| 30:0 | 713.5 | 6.8 ± 0.7 | 1.6 ± 0.2 |
| 32:2 | 737.5 | 0.8 ± 0.0 | nd |
| 32:1 | 739.5 | 11.2 ± 0.7 | nd |
| 32:0 | 741.5 | 27.2 ± 0.1 | 9.4 ± 1.0 |
| 33:1 | 753.5 | 3.2 ± 0.3 | nd |
| 33:0 | 755.5 | 2.3 ± 0.4 | 3.6 ± 0.6 |
| 34:3 | 763.5 | 0.5 ± 0.1 | nd |
| 34:2 | 765.5 | 12.0 ± 0.8 | nd |
| 34:1 | 767.5 | 55.5 ± 0.5 | 3.4 ± 0.7 |
| 34:0 | 769.5 | 35.9 ± 2.9 | nd |
| 35:2 | 779.6 | 1.8 ± 0.3 | 1.9 ± 0.5 |
| 35:1 | 781.6 | 3.9 ± 0.3 | 2.3 ± 0.6 |
| 35:0 | 783.6 | 1.2 ± 0.2 | 1.4 ± 0.1 |
| 36:4 | 789.6 | 1.1 ± 0.2 | nd |
| 36:3 | 791.6 | 6.6 ± 0.6 | nd |
| 36:2 | 793.6 | 43.5 ± 4.6 | nd |
| 36:1 | 795.6 | 41.7 ± 6.2 | 4.9 ± 0.7 |
| 36:0 | 797.6 | 12.6 ± 2.2 | nd |
| 37:2 | 807.6 | 1.4 ± 0.1 | nd |
| 37:1 | 809.6 | 1.0 ± 0.1 | nd |
| 38:6 | 813.7 | 0.7 ± 0.1 | 0.1 ± 0.0 |
| 38:5 | 815.7 | 2.7 ± 0.4 | nd |
| 38:4 | 817.7 | 5.8 ± 0.6 | nd |
| 38:3 | 819.7 | 7.4 ± 0.7 | nd |
| 38:2 | 821.7 | 7.0 ± 1.1 | 0.4 ± 0.1 |
| 38:1 | 823.7 | 3.9 ± 0.4 | 0.3 ± 0.1 |
| 38:0 | 825.7 | 1.2 ± 0.2 | 1.5 ± 0.2 |
| 40:7 | 839.7 | 0.5 ± 0.1 | nd |
| 40:6 | 841.7 | 1.3 ± 0.2 | nd |
| 40:5 | 843.7 | 1.5 ± 0.1 | nd |
| 40:4 | 845.7 | 1.3 ± 0.1 | nd |
| 40:3 | 847.7 | 0.6 ± 0.1 | nd |
| 40:2 | 849.7 | 0.5 ± 0.1 | nd |
| 40:1 | 851.7 | 0.5 ± 0.1 | nd |
| 40:0 | 853.7 | 0.2 ± 0.0 | nd |
XX:N – total fatty acyl carbon atoms:total number of double bonds.
Average ± standard error of the mean, n = 3. Procedural blank values of 1,3-DAG DPFU species were subtracted from the reported molecular species of 1,3-DAG DPFU.
nd- not detected.
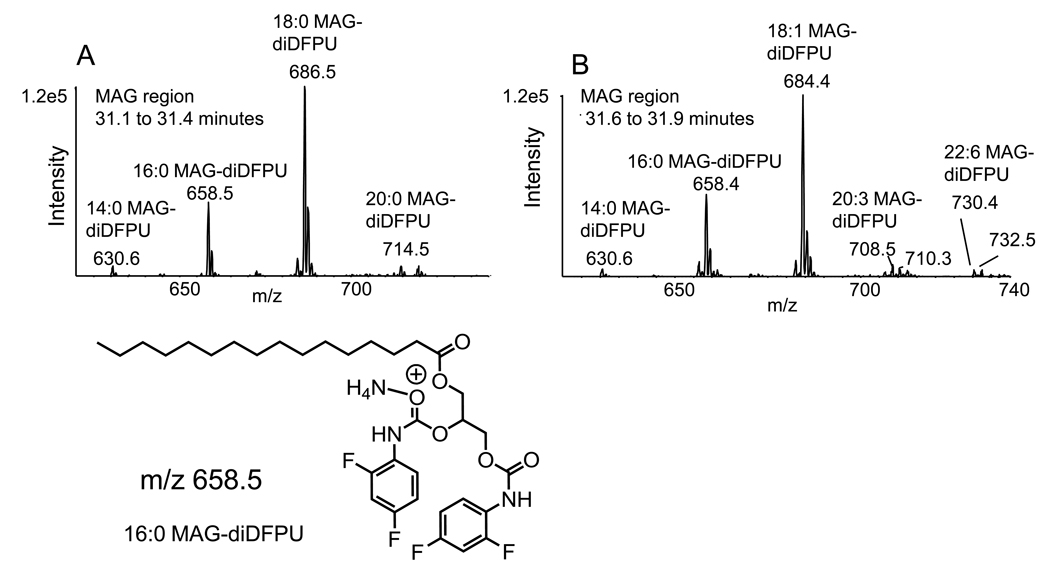
One unexpected outcome of performing a neutral loss scan of 190 u was the detection of several HPLC components eluting at approximately 31–32 min that corresponded to the molecular weight of a bis(2,4-difluorophenyl urethane) derivatives of monoacylglyceride species (Figure 5). The molecular ions of the first eluting MAG-di-DFPU derivatives were consistent with 14:0, 16:0, and 18:0-MAGs (Figure 5A). The later eluting HPLC peak in the MAG-DFPU region had its most abundant species 18:1-MAG-DFPU and 16:0-MAG-DFPU with minor molecular ions corresponding to several polyunsaturated MAGs including species that had fatty acyl chains 20:3 and 22:6 (Figure 5B). Collisional activation of such MAG species revealed as expected two major ions corresponding to the loss of one fatty acyl group and a much more abundant ion corresponding to the loss of 190 u. The two separate peaks likely corresponded to 1(3)-acyl-MAG and 2-acyl-MAG species that could be chromatographically separated as expected for the DAG separation behavior on this normal phase column. Thus, it is possible that this strategy of forming the DFPU derivative would be quite useful in the detection and quantitation of MAG species.
Figure 5.
Molecular ions from monoacylglycerol-bis(difluorophenyl urethane) derivatives detected in the neutral loss (190 u) analysis (Figure 4A) eluting (A) MAG-DFPU derivatives eluting 31.1 – 31.4 min and (B) MAG-DFPU derivatives eluting from the NP-HPLC between 31.6 – 31.9 min.
4. Discussion
The DAGs represent an important neutral lipid class that is the center of much lipid biochemistry from the standpoint of biosynthesis as well as metabolism of more complex lipids. Thus measurement of these molecules in a quantitative way can be an important component of any lipidomics analysis. Brown and coworkers (9) recently reported the DAG molecular species in RAW cells with similar results as those reported here for bone marrow derived macrophage cells. This method employed generation of sodium ion adduct ions and direct injection electrospray which did not permit distinguishing between 1,3- and 1,2-DAG isomers. While several methods have been published outlining means by which one can generate abundant molecular ion species by electrospray ionization that can be used for quantitative analysis, none of the methods have integrated this technique in a general protocol that can analyze multiple neutral lipid species including cholesterol esters, TAGs, and monoacylglycerols (MAGs). The formation of this derivative now makes it possible to carryout such an analysis from a single extract of neutral lipids where all of these lipid species are indeed present and a normal phase LC separation system employed (11). A major component of this strategy, however, is the application of HPLC separation of each of these major classes of lipids so that there is little electrospray ionization suppression taking place when major lipids, such as TAG molecular species, would be considerably more abundant than other species, e.g. MAGs.
One of the unique approaches in detecting diacylglycerols and monoacylglycerols is the formation of a product ion corresponding to the loss of the derivatizing group difluorophenyl carbamic acid (plus ammonia) corresponding to a loss of 190 daltons. This neutral loss permits one to detect all derivatized species in a way that significantly reduces chemical noise and allows one to readily detect the elution of DAGs and MAGs. Furthermore, this derivative enables separation of 1,3-DAGs from 1,2-DAGs by normal phase chromatography and presumably 1(3)-MAGs from 2-MAGs, and the corresponding molecular species of each of these regioisomers.
1,2-Diacylglycerols are the expected biosynthetic products of phospholipid biosynthesis and TAG hydrolysis, but little attention has been paid to the appearance of 1,3-DAGs. However we found these isomers to be minor components present in biological extracts. If acyl group migration is allowed to proceed to equilibrium then the thermodynamically most stable 1,3-DAG isomer predominates in a ratio of 9 to 1 [17]. While there has been no report of 1,2-DAG acyl group migration during mass spectrometry, it is known that acyl group migration can be chemically catalyzed by normal phase silica chromatography used during isolation and purification [17]. Therefore a strategy was employed to utilize a derivatization reaction of the free hydroxyl group that is required for acyl group migration in order to eliminate this isolation artifact even if it occurred to a minor extent. In this way a faithful representation of the population of 1,3-DAGs and 1,2-DAGs in the biological neutral lipid extract was obtained even when normal phase HPLC separation was employed. The minor extent of acyl group migration was evident by the appearance of 20:0/20:0 d5-DAG DPFU (acyl group migration within the internal standard) in the 1,2 diacylglycerol LC region (Supplemental Figure 3). Thus it is possible that the origin of the 1,3-DAGs observed in these macrophages was different than the 1,2-DAGs in terms of synthesis or as metabolic products from esterase hydrolysis of TAGs.
5. Conclusion
A rapid and facile derivatization of DAGs and MAGs is now possible that freezes the stereochemistry of the di- or monoglycerol estetrs in a way that one can determine which regioisomer each molecular species of this class of lipids as they are found in biological samples. The application of this technique to a biological extract has been demonstrated and revealed different populations of 1,3-DAG molecular species from 1,2-DAG molecular species. An unexpected additional benefit of this derivatization approach was the discovery of MAG species. These were most readily detected in a constant neutral loss of 190 u.
Supplementary Material
Acknowledgements
This work was supported, in part, by a grant from the National Institutes of Health (U54GM069338). The bone marrow derived macrophages were kindly prepared by Professor Chris Glass and Donna Reichart (University of California San Diego) as part of the LipidMAPS consortium.
Abbreviations
- DAGs
diacylglycerols
- DCM
dichloromethane
- DFPU
2,4-difluorophenyl urethane
- MAGs
monoacylglycerols
- MeDAGs
monoetherdiacylglycerols
- TAGs
triacylglycerols
- MTBE
methyl tert-butyl ether
Footnotes
Publisher's Disclaimer: This is a PDF file of an unedited manuscript that has been accepted for publication. As a service to our customers we are providing this early version of the manuscript. The manuscript will undergo copyediting, typesetting, and review of the resulting proof before it is published in its final citable form. Please note that during the production process errors may be discovered which could affect the content, and all legal disclaimers that apply to the journal pertain.
References
- 1.McMaster CR, Bell RM. CDP-choline: 1,2 -diacylglycerol cholinephosphotransferase. Biochim. Biophys. Acta. 1997;1348:100–110. doi: 10.1016/s0005-2760(97)00097-0. [DOI] [PubMed] [Google Scholar]
- 2.Morley N, Kuksis A. Positional specificity of lipoprotein lipase. J. Biol. Chem. 1972;247:6389–6393. [PubMed] [Google Scholar]
- 3.Watson SP, Lapetina EG. 1,2-Diacylglycerol and phorbol ester inhibit agonist-induced formation of inositol phosphates in human platelets: possible implications for negative feedback regulation of inositol phospholipid hydrolysis. Proc. Natl. Acad. Sci. USA. 1985;82:2623–2626. doi: 10.1073/pnas.82.9.2623. [DOI] [PMC free article] [PubMed] [Google Scholar]
- 4.Agren JJ, Kuksis A. Analysis of diastereomeric DAG naphthylethylurethanes by normal-phase HPLC with on-line electrospray MS. Lipids. 2002;37:613–619. doi: 10.1007/s11745-002-0940-0. [DOI] [PubMed] [Google Scholar]
- 5.Reyes G, Yasunaga K, Rothenstein E, Karmally W, Ramakrishnan R, Holleran S, Ginsberg HN. Effects of a 1,3-diacylglycerol oil-enriched diet on postprandial lipemia in people with insulin resistance. J. Lipid Res. 2008;49:670–678. doi: 10.1194/jlr.P700019-JLR200. [DOI] [PubMed] [Google Scholar]
- 6.Brüschweiler H, Dieffenbacher A. Determination of mono- and diacylglycerols by capillary gas chromatography: results of a collaborative study and the standardized method. Pure & Appl. Chem. 1991;63:1153–1162. [Google Scholar]
- 7.Kuksis A, Itabashi Y. Regio- and stereospecific analysis of glycerolipids. Methods. 2005;36:172–185. doi: 10.1016/j.ymeth.2004.11.001. [DOI] [PubMed] [Google Scholar]
- 8.Rodriguez JA, Mendoa LD, Pezzotti F, Vanthuyne N, Leclaire J, Verger R, Buono G, Carriere F, Fotiadu F. Novel chromatographic resolution of chiral diacylglycerols and analysis of the stereoselective hydrolysis of triacylglycerols by lipases. Anal. Biochem. 2008;375:196–208. doi: 10.1016/j.ab.2007.11.036. [DOI] [PubMed] [Google Scholar]
- 9.Callender HL, Forrester JS, Ivanova P, Preininger A, Milne S, Brown HA. Quantification of diacylglycerol species from cellular extracts by electrospray ionization mass spectrometry using a linear regression algorithm. Anal. Chem. 2007;79:263–272. doi: 10.1021/ac061083q. [DOI] [PubMed] [Google Scholar]
- 10.Li YL, Su X, Stahl PD, Gross ML. Quantification of diacylglycerol molecular species in biological samples by electrospray ionization mass spectrometry after one-step derivatization. Anal. Chem. 2007;79:1569–1574. doi: 10.1021/ac0615910. [DOI] [PMC free article] [PubMed] [Google Scholar]
- 11.Hutchins PM, Barkley RM, Murphy RC. Separation of cellular non-polar neutral lipids by normal phase chromatography and analysis by electrospray ionization mass spectrometry. J. Lipid Res. 2008;49:804–813. doi: 10.1194/jlr.M700521-JLR200. [DOI] [PMC free article] [PubMed] [Google Scholar]
- 12.Ghisletti S, Huang W, Jepsen K, Benner C, Hardiman G, Rosenfeld MG, Glass CK. Cooperative NCoR/SMRT interactions establish a corepressor-based strategy for integration of inflammatory and anti-inflammatory signaling pathways. Genes Dev. 2009;23:681–693. doi: 10.1101/gad.1773109. [DOI] [PMC free article] [PubMed] [Google Scholar]
- 13.Uzuelli JA, Dias-Junior CA, Izidoro-Toledo TC, Gerlach RF, Tanus-Santos JE. Circulating cell-free DNA levels in plasma increase with severity in experimental acute pulmonary thromboembolism. Clin. Chim. Acta. 2009;409:112–116. doi: 10.1016/j.cca.2009.09.011. [DOI] [PubMed] [Google Scholar]
- 14.Itabashi Y, Myher JJ, Kuksis A. High-performance liquid chromatographic resolution of reverse isomers of 1,2-diacyl-rac-glycerols as 3,5-dinitrophenylurethanes. J. Chromatogr. 2000;893:261–279. doi: 10.1016/s0021-9673(00)00759-7. [DOI] [PubMed] [Google Scholar]
- 15.McAnoy AM, Wu CC, Murphy RC. Direct qualitative analysis of triacylglycerols by electrospray mass spectrometry using a linear ion trap. J. Am. Soc. Mass Spectrom. 2005;16:1498–1509. doi: 10.1016/j.jasms.2005.04.017. [DOI] [PubMed] [Google Scholar]
- 16.Li X, Evans JJ. Examining the collision-induced decomposition spectra of ammoniated triglycerides as a function of fatty acid chain length and degree of unsaturation. II. The PXP/YPY series. Rapid Commun. Mass Spectrom. 2006;20:171–177. doi: 10.1002/rcm.2270. [DOI] [PubMed] [Google Scholar]
- 17.Kodali DR, Tercyak A, Fahey DA, Small DM. Acyl migration in 1,2-dipalmitoyl-sn-glycerol. Chem. Phys. Lipids. 1990;52:163–170. doi: 10.1016/0009-3084(90)90111-4. [DOI] [PubMed] [Google Scholar]
Associated Data
This section collects any data citations, data availability statements, or supplementary materials included in this article.


