Abstract
There has been recent interest in positive-contrast MRI methods for noninvasive tracking of cells labeled with superparamagnetic iron-oxide (SPIO) nanoparticles. Low-tip-angle balanced steady-state free precession (bSSFP) sequences have been used for fast, high-resolution, and flow-insensitive positive-contrast imaging; however, the contrast can be compromised by the limited suppression of the on-resonant and fat signals. In this work, a new technique that produces positive contrast with alternating repetition time SSFP (PARTS) is proposed to achieve robust background suppression for a broad range of tissue parameters. In vitro and in vivo experiments demonstrate the reliability of the generated positive contrast. The results indicate that PARTS can enhance the suppression level by up to 18 dB compared with conventional bSSFP.
Keywords: susceptibility, positive contrast, SPIO, cell tracking, SSFP
Introduction
A homogeneous static magnetic field is required for dependable signal formation and accurate image reconstruction in MRI. When the main field is considerably disturbed, the dephasing of the precessing spins leads to localized signal loss in MR images (1). While these losses often appear as unwanted image artifacts, they can also serve as an alternative contrast mechanism. Iron-containing contrast agents have been widely used to create and detect such signal voids in various applications (2–5), including noninvasive cellular MRI with superparamagnetic iron-oxide (SPIO) nanoparticles (6–9). Although these negative-contrast techniques can track small quantities of SPIO-labeled cells (8, 9), their specificity is compromised by other sources of signal loss such as partial volume effects, motion artifacts, hypointense background signals, and susceptibility drifts at tissue interfaces.
To address some of the drawbacks pertaining to negative contrast, several positive-contrast methods have recently been proposed that generate hyperintense signal from susceptibility-induced magnetic field perturbations (10–19). Postprocessing approaches can effectively generate positive-contrast images from regular gradient-echo acquisitions with negative contrast (10–12). In addition to a potential lowering of the image resolution, these methods can suffer from spurious positive contrast due to partial volume effects and abrupt phase changes at water-fat boundaries.
The pulse sequences can instead be modified to yield bright signal from SPIO particles at the time of acquisition. “White marker” techniques exploit the magnetic field gradients to simultaneously rephase the dipole field around the paramagnetic marker and dephase the background signal in other regions (13, 14). However, the background suppression is compromised by high-spatial-frequency edges (i.e., regions of abrupt change in signal intensity) in the direction of field compensation. Alternatively, SPIO-labeled cells can be successfully tracked through selective excitation and/or refocusing of off-resonant spins (15–17). In general, these methods involve spin-echo acquisitions or high-energy preparatory radio-frequency (RF) pulses. As a result, prolonged scan times and high specific absorption rates (SARs) can hamper their applicability.
Low-tip-angle balanced steady-state free precession (bSSFP) sequences have recently been used for fast positive-contrast imaging with low SARs (18,19). The singularity points in the bSSFP spectral response at higher tip angles turn into off-resonant signal peaks at lower tip angles (< 15°) while the on-resonant signal is reduced. Nonetheless, the level of on-resonant signal suppression and thereby the achievable positive contrast are limited. Furthermore, unsuppressed fat signal also appears hyperintense in bSSFP images.
In this work, we present a new and improved method, positive contrast with alternating repetition time SSFP (PARTS), for fast, high-resolution imaging of SPIO-labeled cells. PARTS couples low tip angles for generating off-resonant signal, with alternating repetition times (20, 21) for creating a broad stop-band centered at the water resonance. To also reduce the signal from fat, the water-suppressed image can be combined with a separate acquisition where the stop-band is instead centered at the fat resonance. Simulation and experimental results indicate that the proposed method can yield reliable positive contrast for a wide range of sequence and tissue parameters. Compared with low-tip-angle bSSFP, PARTS delivers significantly improved background suppression.
Theory
A spherical paramagnetic particle, with a radius of R and a magnetic susceptibility difference of Δχ, perturbs the magnetic field at a location r outside the volume of the sphere. In turn, this perturbance creates a shift in the local precession frequency by the following amount:
| (1) |
where the perturbance is in the direction of the static magnetic field Bo, and θ is the angle between the vectors along r and Bo. Therefore, positive-contrast images can be obtained by generating hyperintense signal from a subset of these off-resonant frequencies while sup-pressing the on-resonant signal.
In the following sections, we will describe the underlying mechanism through which the proposed method yields reliable positive contrast. Because this method builds upon low-tip-angle bSSFP imaging, positive-contrast generation with bSSFP is explained along with the significant improvements PARTS provides in terms of on-resonant suppression. Finally, we propose efficient steady-state fat-suppression strategies for both techniques to enhance the delineation of positive contrast.
Positive Contrast with bSSFP
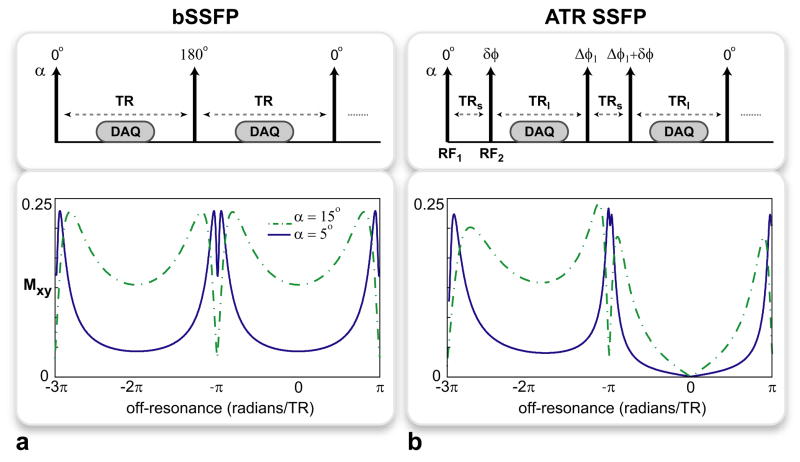
A conventional (0 180)° phase-cycled bSSFP sequence (Fig. 1a) provides fast imaging with high signal-to-noise ratio (SNR) efficiency, and produces the following periodic spectral response assuming TR ≪ T1, T2 (19):
| (2) |
where Mo is the equilibrium magnetization and α is the tip angle. High signal is generated at on-resonance when α is close to the conventional tip angle prescribed for a given tissue (i.e., a T1/T2 value). There are also equally-spaced signal nulls at certain off-resonant frequencies, fs:
| (3) |
Figure 1.
The pulse sequence diagrams and the corresponding transverse magnetization profiles for the a: bSSFP and b: ATR SSFP sequences. All RF pulses have the same tip angle, α, and the labels on top of the arrows denote the individual RF phases. The profiles were simulated for α = {5°, 15°} and T1/T2 = 5, assuming TR = TRs + TRl for ATR SSFP. While the off-resonant peaks created around -π radians are similar for both sequences, ATR SSFP achieves superior on-resonant suppression at all tip angles. For bSSFP (a), there is considerable remnant on-resonant signal even with α = 5°. On the contrary, ATR SSFP yields near-zero signal regardless of α as seen in b.
When these two effects are combined, the bSSFP sequence yields negative contrast. If, however, low tip angles (α < αconventional) are prescribed, the on-resonant signal is reduced as shown in Fig. 1a. Furthermore, signal peaks arise around the singularity points (fs) (19). Therefore, bSSFP can produce positive contrast with the appropriate choice of α. Unfortunately, this contrast is inherently limited by the nonzero on-resonant signal, the level of which increases at higher tip angles and T1/T2 ratios.
Positive Contrast with Alternating-TR SSFP
The use of alternating repetition times (TRs) has recently been proposed for modifying the regular bSSFP response (20, 21). Figure 1b displays a generic alternating-TR (ATR) sequence that can create a broad stop-band symmetric around a central null point by using two consecutive TRs, TRs and TRl (20). The width of this stop-band is inversely proportional to the total TR, TRs + TRl, and the location of the central null is determined by the phases of the RF excitations, RF1,2, prior to the intervals TRs,l respectively. This null can be placed at a target frequency ft with the following choice of Δφ1 and δφ, which denote the incremental phase-cycling of RF1, and the phase difference between RF2 and the previous RF1 pulse respectively:
| (4) |
| (5) |
Therefore, on-resonant suppression (ft = 0 Hz) can be achieved with a (0 180 180 0)° phase-cycling of the RF pulses.
An ATR SSFP sequence can also be interpreted as a regular phase-cycled bSSFP sequence with a ‘1 − 1̄’ binomial RF pulse (22, 23), where the interpulse spacing is TRs. This pulse creates a frequency-dependent tip angle α(f):
| (6) |
where S(f) is the excitation profile of a single ‘1 − 1̄’ pulse. In turn, the regular bSSFP response is modified as follows:
| (7) |
The proposed method, PARTS, couples low tip angles with a ‘1 − 1̄’ binomial excitation to significantly improve the background suppression compared to regular bSSFP. As aforementioned, the use of low tip angles reduces the on-resonant signal and creates periodic off-resonant peaks that cumulatively generate the positive signal. Nevertheless, the spatial extent of this signal is affected not only by the width of the peaks, but also by the spatial distribution of frequencies. Because lower off-resonant frequencies exhibit relatively slower spatial variations, the highest contribution to positive contrast arises from the peaks closest to the water resonance (19). Meanwhile, the binomial pulse enhances the level of suppression by further reducing the tip angle within the on-resonant stop-band. The magnetization profiles for bSSFP and ATR SSFP are displayed in Fig. 1 for several low tip angles. ATR SSFP creates a stop-band regardless of the tip angle and the T1/T2 ratio.
The level of on-resonant suppression with PARTS can be significantly improved by decreasing the tip angle, α. However, this also reduces the width of the off-resonant signal peaks. Furthermore, if α is reduced below 5°, the maximum signal amplitude in the peaks and the image SNR can be degraded. Therefore, Bloch simulations should be performed to compute the range of α values that yield optimal contrast-to-noise ratio (CNR).
Although positive contrast was defined as the maximum signal difference between off-resonant (precessing at a frequency f) and on-resonant spins (precessing at 0 Hz) in earlier work (19), this measure does not account for the frequency-dependent signal changes in the bSSFP profile. As an alternative measure, we define the positive CNR to be proportional to the difference between the mean off- and on-resonant signals:
| (8) |
Here, the off-resonant signal is averaged over a [−W, W] band around f = fs, where W = 1/(6 · TR). Because the frequency range of this band is constant for a fixed total TR, the calculated CNR reflects the variations in the full-width at half-maximum (FWHM) of the off-resonant peaks with α, T1/T2, and TRs. The second term is the mean on-resonant signal computed over f ∈ [−2W, 2W]. While CNR indicates the ability to separate the two resonances, the peak contrast can be used to quantify the level of background suppression:
| (9) |
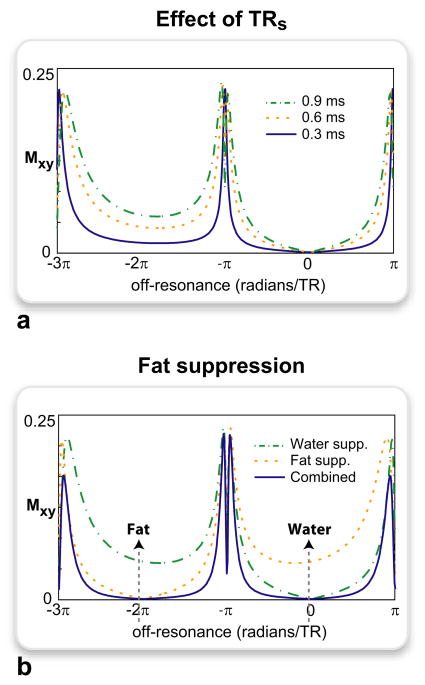
The suppression can also be enhanced with the appropriate choice of TRs. Figure 2a shows the low-tip-angle (α = 5°) ATR SSFP profiles for a fixed total TR and three different values of TRs: 0.9, 0.6, 0.3 ms. Shortening TRs expands α(f) in frequency, effectively scaling down the tip angles around the on-resonant and neighboring off-resonant bands. Although the width of the off-resonant peaks and the image SNR are reduced, this approach offers certain advantages over a direct decrease of α with fixed TRs,l. First, we can increase the stop-band width by keeping TRl constant and reducing the total TR. Alternatively, we can improve the image SNR by keeping the total TR fixed and lengthening the readout duration. In practice, however, the smallest value of TRs that can be prescribed will be limited by SNR considerations and RF subpulse durations.
Figure 2.
The low-tip-angle ATR SSFP response was simulated for the following parameters: α = 5°, T1/T2 = 5, TR = TRs + TRl, TRs = 0.9, 0.6, 0.3 ms in a and 0.9 ms in b. a: For a constant total TR, shortening TRs reduces the subpulse spacing of the ‘1 − 1̄’ binomial excitation in ATR SSFP. As a result, the effective tip angles (as described in Eq. 6) are reduced for the on-resonant stop-band and the neighboring off-resonant bands. Although this slightly reduces the width of the off-resonant peaks, the on-resonant signal suppression is improved. b: Because the adjacent bands fail to provide the near-complete suppression of the on-resonant (water) stop-band, fat suppression can be separately achieved by shifting the center of this band to the fat resonance. Both signals can then be simultaneously suppressed through a combination (multiplication) of the water- and fat-suppressed acquisitions.
Higher-order binomial pulses can also be used to enhance the suppression, but these designs will reduce the available imaging time. Furthermore, the signal amplitude will be signifi-cantly degraded in the off-resonance peaks closest to the water resonance, compromising the conspicuity of the images.
Fat Suppression
Balanced SSFP sequences typically have bright fat signal due to the relatively low T1/T2 ratio of fat. If unsuppressed, this signal will confound the positive-contrast images. Although a variety of fat-suppression techniques have been proposed for bSSFP, we choose to exploit the periodic nature of the bSSFP profile to avoid artifacts from transient signal oscillations (24). The magnitude profile of a low-tip-angle bSSFP sequence consists of periodic stop-bands, each 1/TR wide. The on-resonant and fat signals can be simultaneously reduced if the two resonances are aligned with the centers of adjacent stop-bands. Given the fat resonance resides at approximately -220 Hz for 1.5 T, this condition can be met if TR = 4.6 ms. Nonetheless, the limited suppression capability of the low-tip-angle bSSFP profile still compromises the level of fat suppression and the resulting positive contrast.
For PARTS, on the other hand, the central and the adjacent stop-bands have different magnitude profiles (Fig. 1b). Therefore, to maintain a level of fat suppression comparable to the on-resonant signal reduction, we choose to shift the center of the stop-band toward the fat resonance (Fig. 2b). This shift can be performed by directly changing the center frequency. Alternatively, the profile can be shifted from on-resonance to the target frequency, ft, by applying the phase cycling described in Eqs. 4 and 5.
If we only aim to collect a fat-suppressed image, the success of the aforementioned strategy does not depend on the specific choice of the total TR. However, if separate acquisitions with on-resonant (water) and fat suppression are to be combined, the corresponding off-resonant peaks should be reasonably well aligned. For ft = −220 Hz, this can be simply achieved with TR ≈ 4.6 ms, following the same reasoning as in the regular bSSFP case. The overlap between the off-resonant peaks of the two acquisitions significantly decreases when TR > 5.6 ms, reducing the level of positive contrast in the combined image. We can avoid this reduction by using ft = −1/TR. In spite of the slight off-centering with respect to the fat resonance, the broad stop-band can successfully suppress the fat signal.
Once the water- (Ma) and fat-suppressed (Mb) images are acquired, the two can be combined through a simple voxel-wise multiplication to suppress both signals, while retaining the signal from the off-resonant peaks:
| (10) |
Although minimum-intensity projection (mIP) is a viable alternative, it takes each output voxel from the image with the smaller signal amplitude. Therefore, an mIP is less effec-tive in preserving the off-resonant signal and the image SNR. Figure 2b shows the spectral profiles for the water- and fat-suppressed PARTS acquisitions along with that for the combination. At the expense of slightly reduced SNR and spatially varying noise, this nonlinear combination enhances the background suppression.
Methods
In this section, we thoroughly analyze the signal characteristics of PARTS for various sequence and tissue parameters. We then describe the phantom and in vivo experiments performed to demonstrate the reliability of the technique.
Simulations
The spectral profiles of the bSSFP and ATR SSFP sequences were computed with Bloch simulations to quantify the level of positive CNR and contrast as in Eqs. 8 and 9. The simulations were performed for the following parameters: α ∈ [1 20]°, T1/T2 ∈ [2 10], a total TR of 4.8 ms, and three different values of TRs/TRl (τ): 0.3/4.5 ms, 0.6/4.2 ms, and 0.9/3.9 ms. The width of the off-resonant peaks was quantified by measuring the FWHM with respect to the maximum signal in the frequency range of [−W, W] around fs = 1/(2 · TR), where W = 1/(6 · TR).
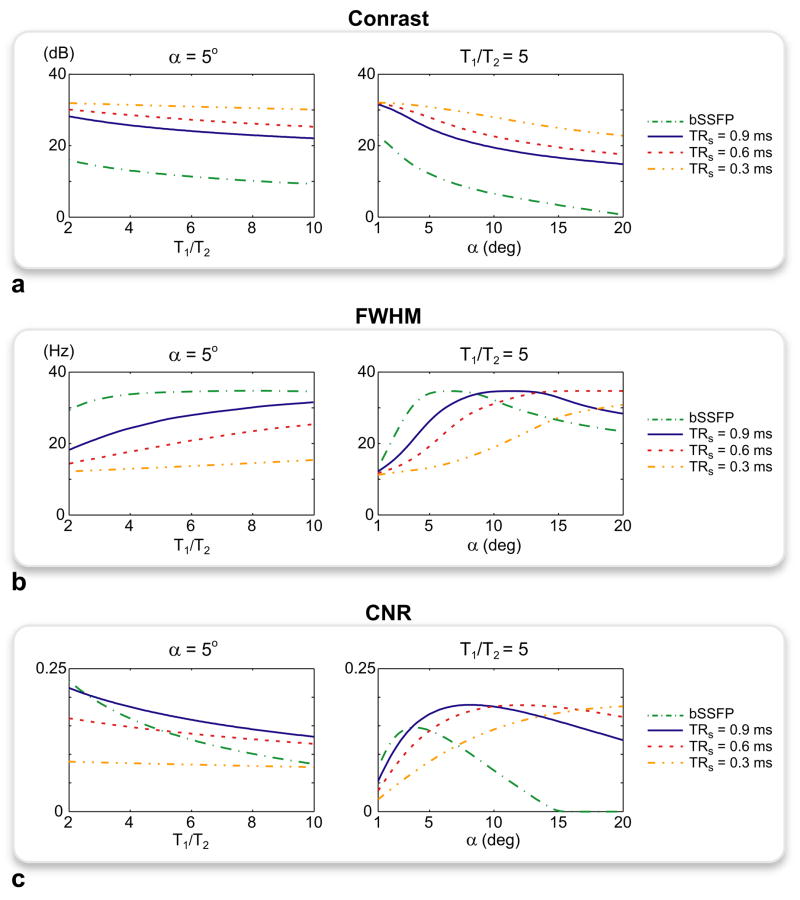
As shown in Fig. 3a, the improved stop-band suppression of PARTS leads to substantially higher contrast compared with bSSFP at all parameter values. For both sequences, smaller α and T1/T2 enhance the level of background suppression. On the other hand, decreasing α also reduces the FWHM of the off-resonant peaks (Fig. 3b) and the mean positive signal. As a result, there is a range of tip angles (αopt), with a weak dependence on T1/T2, that yields near-optimal CNR. PARTS (TRs = 0.9 ms) yields higher CNR than bSSFP except for α < 2°, where the CNR values are approximately the same and both significantly reduced (Fig. 3c). While αopt ≈ 5° for bSSFP and PARTS with TRs = 0.9 ms, the optimal tip angles are slightly higher for TRs = 0.6 and 0.3 ms due to reduced pass-band widths. The level of suppression can be further improved by shortening TRs to achieve higher peak contrast (Fig. 3a), at the expense of narrowing the pass-band (Fig. 3b) and decreasing the resulting CNR (Fig. 3c). It is also important to note that the readout duration can be increased to partially compensate for this CNR reduction. Considering the 1.5-ms-long readouts used later in this work, an additional 0.6 ms (i.e., TRs reduced from 0.9 to 0.3 ms) can help improve the CNR by 20 percent.
Figure 3.
The spectral responses of the bSSFP and ATR SSFP sequences were simulated for a range of tip angles and T1/T2 ratios. For ATR-SSFP, TRs = 0.3, 0.6, and 0.9 ms were used. The positive contrast, full-width at half-maximum (FWHM) of the off-resonant peaks, and CNR were plotted with respect to T1/T2 for α = 5°, and α for T1/T2 = 5. a: The peak positive contrast (equivalently, the suppression ratio) is displayed in dB units. PARTS achieves substantially higher contrast compared with bSSFP at all parameter values. When TRs is shortened below 0.9 ms, the contrast is further increased due to improved suppression. b: The FWHM of the peaks decreases for smaller α and T1/T2, reducing the mean off-resonant signal. c: The normalized positive CNR is assumed to be proportional to the difference between the mean off- and on-resonant signals. PARTS (TRs = 0.9 ms) mostly yields higher CNR compared to bSSFP except for α < 2°, where both sequences have significantly reduced and similar CNR. Although bSSFP and PARTS (TRs = 0.9 ms) yield the highest CNR at α ≈ 5°, the optimal tip angles are slightly increased with TRs = 0.6 and 0.3 ms due to the increased background suppression.
These simulation results clearly demonstrate the trade-off between positive contrast and CNR in the low-tip-angle range (< 15°). Prescribing smaller α and shorter TRs increases the positive contrast due to improved background suppression, while decreasing the SNR and the CNR. Therefore, we can choose to optimize for either the contrast or the CNR depending on application-specific requirements. When the background tissues have an inhomogeneous structure and a relatively broad range of T1/T2 ratios, maximizing the contrast assures reliable background suppression and thereby enhances the visual delineation of the positive signal. In the presence of a more homogeneous background, on the other hand, enhancing the CNR will minimize noise-induced errors in quantitative measurements at the expense of less effective suppression.
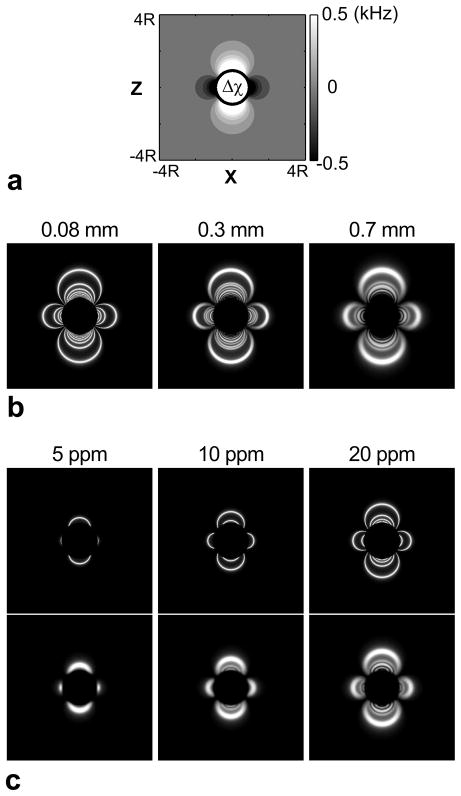
The PARTS signal from a spherical perturber was simulated to demonstrate the effect of the periodic spectral response on the image contrast. The three-dimensional (3D) distribution of the local precession frequency was computed as in Eq. 1 for the following parameters: R = 4 mm, a field-of-view (FOV) of 8·R sampled with 400 points in all three directions, Bo = 1.5 T, and susceptibility shifts of Δχ = 5, 10, 20, 30, 40 ppm. Afterward, the ATR SSFP signal at each point was calculated assuming α = 5°, TRs/TRl = 0.6/4.2 ms, and T1/T2 = 5. The images were then reconstructed at isotropic resolutions of 0.08, 0.3, and 0.7 mm.
Figure 4 displays the frequency pattern observed for Δχ = 40 ppm (Fig. 4a) along with the corresponding PARTS images at three different resolutions (Fig. 4b). The periodic off-resonant peaks in the PARTS profile generate concentric shells of hyperintense signal around the marker, where the outermost shell corresponds to the peaks closest to the water resonance. The partial-volume effects at lower resolutions yield increased signal averaging, which widens the spatial extent of the shells and merges the inner shells together. While the volume of positive signal is increased, the observed CNR could potentially be reduced at lower resolutions. On the other hand, the positive-contrast region is extended with higher Δχ as expected (Fig. 4c).
Figure 4.
The three-dimensional magnetic field distribution around of a spherical perturber was simulated along with the corresponding PARTS image for the following parameters: R = 4 mm, a field-of-view (FOV) of 8·R sampled with 400 points in all three directions, Bo = 1.5 T, α = 5°, TRs/TRl = 0.6/4.2 ms, T1/T2 = 5, and Δχ = 5, 10, 20, 30, 40 ppm. a: The cross-sectional map of the local precession frequency for Δχ = 40 ppm in the xz-plane. b: The corresponding PARTS images reconstructed at isotropic resolutions of 0.08, 0.3, and 0.7 mm. c: The PARTS images at 0.08-mm (upper row) and 0.7-mm (lower row) resolution for Δχ = 5, 10, and 20 ppm. The positive-contrast region spatially extends as the susceptibility difference is increased.
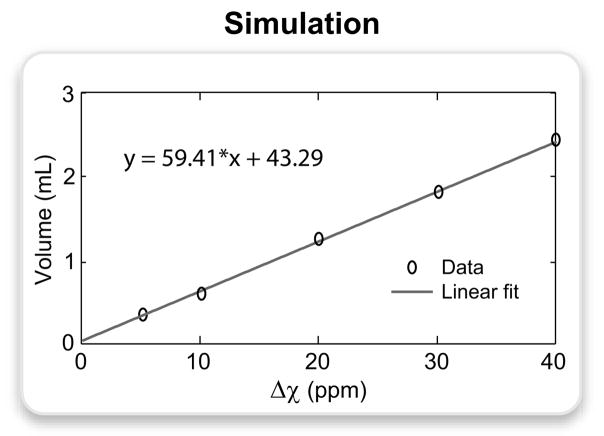
The volume of positive contrast around the perturber was quantified as a function of Δχ on the 0.7-mm-resolution images. Following the addition of bivariate Gaussian noise to yield an SNR of 20, the mean and standard deviation (σ) of the background signal were measured at identical locations. Positive-contrast voxels were identified by thresholding the signal at 3σ above the mean as described in Ref. (16). The contrast volume exhibited a highly linear correlation with Δχ as shown in Fig. 5.
Figure 5.
The volume of hyperintense signal was measured on the simulated images of the spherical perturber (0.7-mm resolution) for the following Δχ values: 5, 10, 20, 30, 40 ppm. Bivariate Gaussian noise was added to the data to achieve an SNR of 20, and the signal was thresholded at 3 standard deviations above the mean background signal. The plot displays the actual data points and the corresponding linear fit expressed by the following equation: y = 59.41 · x + 43.29, where y is the volume of positive contrast in μL, and x is the susceptibility difference in ppm.
In Vitro Experiments
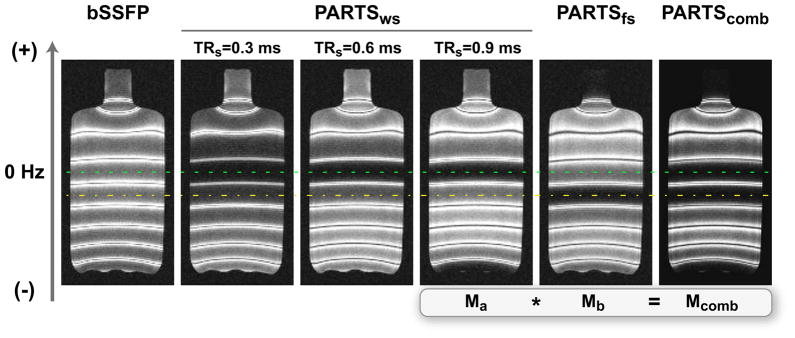
To demonstrate the simulated bSSFP and ATR SSFP profiles, 3D images of a water bottle (T1/T2 = 250/50 ms) were collected with a linear field gradient applied along the long-axis of the bottle to create spatially varying precession frequency. α = 5°, a 14-cm FOV, 4-mm slice thickness, and a total TR of 4.8 ms were used for both sequences, yielding equivalent on-resonant stop-band widths of 208 Hz. The total scan time for all acquisitions was 12 sec. To observe the effects of shortening the interpulse spacing of the binomial pulse in ATR SSFP, three separate acquisitions were performed with respective TRs/TRl values of 0.3/4.5, 0.6/4.2, and 0.9/3.9 ms. For the highest TRs/TRl ratio, a fat-suppressed ATR SSFP dataset was also collected. The two acquisitions were then combined as in Eq. 10 to achieve simultaneous on-resonant (water) and fat suppression.
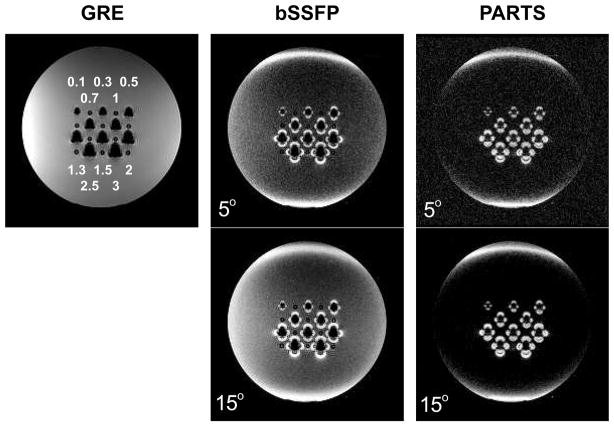
The robust background suppression with the PARTS method was demonstrated on a cylindrical agarose gel phantom. An array of post-consumer resin (PCR) tubes were inserted into the gel to create holes that were later filled with solutions containing either various numbers of human bone marrow stromal cells (hSCs) (Cognate Biosciences, Inc., Sunnyvale, CA, USA) or phosphate buffered saline (PBS). To label the hSCs, a stock solution of 1 mg/mL clinical-grade protamine sulfate (PS) (American Pharmaceuticals Partner, Schaumburg, IL, USA) was prepared in distilled water, while 100 μg/mL of ferumoxides was put into a tube containing the hSC medium. After the addition of PS to that solution at a concentration of 12 g/mL, a final ferumoxides to PS ratio of 50:6 was obtained. The number of viable cells were counted using trypan blue stain prior to the distribution into the PCR tubes with 200 μL of PBS. Out of the 20 tubes in the PCR array, 10 tubes contained the following amounts of cells: 0.1, 0.3, 0.5, 0.7, 1, 1.3, 1.5, 2, 2.5, and 3 million.
The agarose gel phantom was imaged using an 8-channel receive-only knee array on a 1.5 T GE Signa scanner with CV/i gradients (40 mT/m maximum strength and 150 T/m/s maximum slew rate). The scout-scan procedure employed standard 3-plane localization and automated gradient shimming (zeroth- and first-order) routines. When necessary, the center frequency was manually aligned with the water peak following the auto-shim. Afterward, 3D GRE, bSSFP, and ATR SSFP images were collected with the following common set of parameters: a 13-cm FOV, 0.7×0.7×1 mm3 resolution, and 192×192×44 encoding matrix. For the GRE acquisition, α = 30°, and TR = 22 ms were used to yield a scan time of 3 min 9 sec. Meanwhile, bSSFP and ATR SSFP datasets were acquired with a total TR of 4.8 ms, a readout bandwidth of 62.5 kHz, and a scan time of 42 sec each. For both sequences, α = 5° and 15° were prescribed. TRs values of 0.3, 0.6, and 0.9 ms were used for ATR SSFP.
In Vivo Experiments
To demonstrate the capability of PARTS for in vivo positive-contrast generation, images of sodium dichloroisocyanurate mice (Charles River Laboratories, Inc., Wilmington, MA, USA) were acquired with 1.5 and 3 million labeled hSCs injected into the right and left hind-limb muscles respectively. The cell medium was prepared according to the aforementioned scheme. The mice were anesthetized with ketamine, and placed in the prone position on top of a 3-inch receive-only surface coil. All animal protocols were approved by the administrative panel on laboratory animal care at Stanford University. Immediately after the injection of the hSCs, 3D GRE, bSSFP, and ATR SSFP acquisitions were performed along with the aforementioned scout scan on a 1.5 T GE Signa scanner. The following sequence parameters were prescribed: a 12-cm FOV, 0.6×0.6×0.8 mm3 resolution, and 192×192×34 encoding matrix. The GRE dataset was collected with α = 30°, TR = 22 ms, and a scan time of 2 min 24 sec. For the bSSFP and ATR SSFP sequences, a total TR of 4.7 ms, a readout bandwidth of 62.5 kHz, and scan times of 32 sec were prescribed. Using α = 5° and TRs = 0.3 ms for ATR SSFP, the visualization of positive contrast was enhanced through a high level of suppression. Meanwhile, bSSFP acquisitions were performed with α = 2° to achieve improved background suppression for a fairer comparison. Another ATR SSFP dataset was collected with a frequency shift of −212 Hz ≈ −1/(4.7 ms), and combined with the original water-suppressed image to reduce both water and fat signals.
Measurements
In vitro and in vivo PARTS images were postprocessed to measure the volume of positive contrast as a function of the number of cells. First, the images were zero-padded in the slice direction to achieve isotropic resolutions of 0.7 and 0.6 mm in all directions respectively. The volumes of positive contrast around separate groups of cells were then manually segmented from the 3D datasets. The mean and standard deviation (σ) of the background signal were measured at locations close to the injection sites on the source images. Finally, the voxels with hyperintense signal were identified using the aforementioned scheme.
To compare the levels of background suppression with various techniques, the peak positive contrast was measured in identical locations of the source images for both in vitro and in vivo experiments. The peak off-resonant signal was identified within the volume of positive contrast on the source images. Afterward, neighboring background pixels were selected to measure the mean background signal. The positive contrast was computed as the logarithmic ratio of the peak off-resonant signal to the mean background signal.
Results
The water phantom images acquired with bSSFP and ATR SSFP are displayed in Fig. 6. The on-resonant stop-band of PARTS yields decreased remnant signal compared with bSSFP, and this signal is further reduced for shorter TRs as predicted by theory. However, the adjacent band centered at the fat resonance has considerable residual signal. The fat signal can be suppressed by shifting the central stop-band to the fat resonance (PARTSfs in Fig. 6), at the expense of less effective water suppression. Finally, the multiplication of the water- and fat-suppressed acquisitions successfully reduces the signal in both bands (PARTScomb in Fig. 6), while preserving the off-resonant signal peaks.
Figure 6.
A water bottle (T1/T2 = 250/50 ms) was imaged with a linear field gradient in the vertical direction to generate spatially varying precession frequency. Water-suppressed (ws) bSSFP and PARTS data were collected with these parameters: α = 5°, TR = 4.8 ms for bSSFP, and TRs/TRl = 0.3/4.5, 0.6/4.2, and 0.9/3.9 ms for PARTSws. PARTSws achieves a significantly higher level of suppression over the central on-resonant band (marked with the dashed line). The level of suppression is further improved for shorter TRs at the expense of reducing the width of the off-resonant peaks. The PARTS stop-band was shifted to the fat resonance (marked with the dash-dot line) to collect fat-suppressed (fs) data for TRs/TRl = 0.9/3.9 ms. PARTSws can be simply multiplied with PARTSfs to suppress both background signals simultaneously.
The PARTS data (TRs = 0.9 ms) were measured to yield 12 dB higher contrast than bSSFP as listed in Tab. 1. This value closely matches the theoretical estimate of 13 dB for α = 5° and T1/T2 = 5. On the other hand, approximately 1-dB incremental improvement was observed for each 0.3 ms decrease in TRs, which was lower than the theoretical estimate of 3 dB.
Table 1.
The logarithmic ratio of the peak off-resonant signal to the mean background signal was measured on the positive-contrast images acquired with bSSFP and PARTS: water-suppressed (ws) and combined (comb). The first half of the measurements were performed on the water bottle and the agarose gel phantom data. For both cases, PARTS yields improved suppression compared with bSSFP. For the agarose gel phantom, the increasing background signal at α = 15° reduces the peak contrast for bSSFP as expected. Contrarily, PARTS maintains near-complete background suppression at both tip angles, and the noise level is comparable to the background signal at α = 5°. Therefore, the smaller peak contrast at α = 5° might be attributed to the inadvertent increase in the measured background signal due to noise. The peak contrast was also measured on in vivo mouse images. Similar to the phantom results, PARTSws achieves superior background suppression compared with bSSFP. PARTScomb further improves the peak contrast by simultaneously suppressing the water and fat signals.
| Method | bSSFP | PARTSws | PARTScomb |
|---|---|---|---|
| Phantom (water bottle) | 7.46 | 20.04 | 24.96 |
| Phantom (agarose, α = 5°) | 9.51 | 17.00 | – |
| Phantom (agarose, α = 15°) | 7.27 | 23.45 | – |
| Mouse (axial) | 10.34 | 19.18 | 28.50 |
| Mouse (coronal) | 6.38 | 17.83 | 23.77 |
Figure 7 shows the agarose gel phantom images produced with the bSSFP and PARTS techniques at α = 5°, 15°. Because PARTS readily yields a high level of suppression for the gel phantom even at α = 15°, the images with TRs =0.6 ms are displayed. While the bSSFP background signal increases at α = 15°, PARTS achieves near-complete suppression of the background at both tip angles. Table 1 lists the peak-positive-contrast values measured on the phantom images. The PARTS peak contrast exceeds that of bSSFP by 8 dB at α = 5°, and 16 dB at α = 15°.
Figure 7.
The GRE, bSSFP, and PARTS sequences were used to image an agarose gel phantom with tubes containing different numbers of SPIO-labeled cells at 1.5 T. The numbers of cells are marked in millions on the GRE image for each tube. PARTS achieves superior background suppression compared to bSSFP for both tip angles (5° and 15°). While the bSSFP background signal increases with α = 15°, PARTS successfully maintains the near-complete background suppression. Finally, higher SNR is achieved with α = 15° for PARTS. It is important to note that hyperintense signal is also generated at the edges of the cylindrical phantom due to the strong susceptibility drifts.
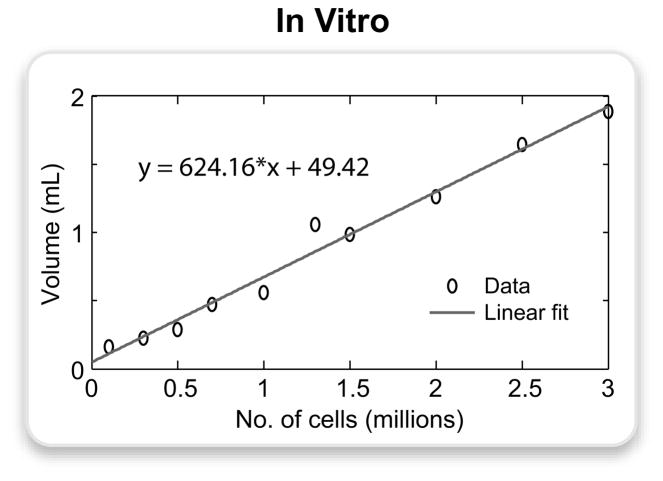
The sensitivity analysis was performed on the PARTS image collected with α = 15° and TRs = 0.6 ms, which had sufficiently high SNR to perform reliable measurements while maintaining effective background suppression. The volume of positive contrast around each tube in the phantom is shown in Fig. 8. While this volume linearly scales with the number of cells, similar CNR values were measured and the PARTS method can detect cell concentrations as low as 0.1-million/200-μL.
Figure 8.
The PARTS image of the agarose gel phantom (α = 15°) was processed to measure the volume of hyperintense signal around the tubes containing the following numbers of cells in 200-μL spaces: 0.1, 0.3, 0.5, 0.7, 1, 1.3, 1.5, 2, 2.5, 3 million. These volumes were manually segmented, and the signal was thresholded at 3 standard deviations above the mean background signal. The plot displays the actual data points and the corresponding linear fit expressed by the following equation: y = 624.16 · x + 49.42, where y is the volume of positive contrast in μL, and x is the number of cells in millions.
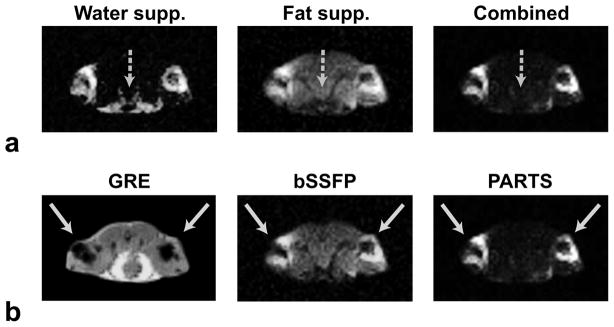
Figure 9a demonstrates the importance of simultaneous water- and fat-suppression for in vivo imaging. The axial water-suppressed PARTS images have considerable remnant fat signal, whereas the fat-suppressed images suffer from increased water signal. On the other hand, a multiplication of these acquisitions successfully reduces the signal from both sources to yield improved contrast, at the expense of a two-fold increase in scan time.
Figure 9.
Axial slices from in vivo acquisitions performed at 1.5 T, obtained in a mouse injected with SPIO-labeled cells into its hind limbs. a: The water- and fat-suppressed PARTS acquisitions are separately displayed along with the final combination. The water-suppressed image has residual fat signal (dashed arrow), while the fat-suppressed image has remnant on-resonant signal. Their combination simultaneously suppresses both sources of background signal. b: The GRE, bSSFP and combined PARTS images of the same slice, where the solid arrows pinpoint the injection sites. While bSSFP yields considerable background signal, PARTS produces near-complete background suppression.
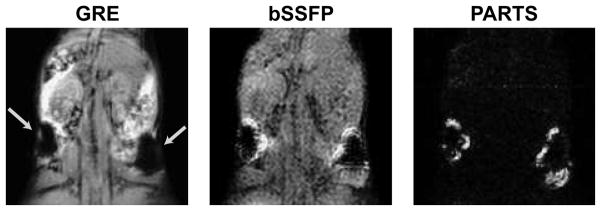
In vivo GRE, bSSFP, and combined PARTS images of mice from two separate experiments are shown in Fig. 9b (axial slices) and Fig. 10 (coronal projections) respectively. While the bSSFP images are confounded by suboptimal background suppression, PARTS yields near-complete suppression with reliable positive contrast. Table 1 lists the peak-positive-contrast measurements performed on these datasets. On average, PARTS images surpass the peak contrast of bSSFP by 10 dB when only water-suppressed, and 18 dB when combined. The following pairs of positive-contrast volumes were quantified around (1.5, 3)-million cells with PARTS: (270, 421)-μL and (256, 455)-μL for the images in Figs. 9 and 10 respectively. The average ratio of the volumes, comparing 1.5 and 3 million cells, was 0.6. Meanwhile, the CNR values for the two cell clusters were approximately identical.
Figure 10.
Coronal projections (over 4 slices) from in vivo GRE, bSSFP, and PARTS acquisitions at 1.5 T. The mouse was injected with 1.5 and 3 million SPIO-labeled cells at two sites (arrows). Separate water- and fat-suppressed data were combined to generate the PARTS image. The suboptimal background suppression with bSSFP compromises the conspicuity of the positive contrast images. On the other hand, the background is almost nonexistent in the PARTS image.
Discussion
The PARTS method offers significantly improved on-resonant signal reduction compared with regular bSSFP at low tip angles. Furthermore, the PARTS stop-band can be frequency-shifted to reduce the fat signal in a separate acquisition. By combining these two acquisitions, the proposed method simultaneously suppresses the on-resonant and fat signals. This effec-tive suppression is provided over a wide range of tip angles and tissue parameters, facilitating the visualization of positive contrast.
Quantitative positive-contrast measurements validate the improvement in background suppression PARTS provides over bSSFP. Although these measurements are in general agreement with the theoretical predictions, a smaller improvement in contrast was observed while decreasing TRs in the water phantom images. Furthermore, the PARTS image of the agarose gel phantom had smaller peak contrast at α = 5° compared with α = 15°. Both deviations might result from the adverse effect of the increased noise on the mean-background-signal measurements.
The enhanced background suppression of PARTS may enable more accurate quantification of SPIO-labeled cells with respect to regular low-angle bSSFP. However, while a high level of linearity has been demonstrated in vitro between the contrast volume and the cell concentration, magnetic field perturbations also depend on the geometric distribution of SPIO particles in addition to the total number of cells. Because the accuracy of in vivo measurements can be compromised by conditions such as the migration, clustering, proliferation, or death of cells, absolute quantification of cellular concentrations may not possible. The irregular distribution of particles can also contract regions with certain levels of frequency shift, at which PARTS yields positive signal, and reduce the volume of positive contrast or the CNR. The decreased symmetry of the in vivo injection volumes might have caused the relatively larger central signal voids in the positive-contrast patterns, compared with the in vitro experiments.
Several other positive-contrast methods have been proposed for effectively generating hyper-intense signal from superparamagnetic markers at the time of acquisition (13–17). These techniques are based on spin-echo sequences (15), GRE sequences (13,14,17), or their variations (16), and they can generate positive signal from a broader range of frequencies. Meanwhile, PARTS employs the relatively narrower off-resonant peaks in bSSFP acquisitions, and its signal profile is directly determined by the choice of TR. As a result, the spatial-resolution limits in the readout direction are more heavily dependent on the gradient strength compared with other methods. In addition, PARTS may not be easily adaptable for use at higher field strengths unless a direct shortening of the TRs is possible. Similar to other off-resonance techniques, regions of considerable field inhomogeneity and susceptibility boundaries can yield high signal with PARTS, and reduce the specificity of the positive contrast in the vicinity of SPIO-labeled cells.
The off-resonance excitation (15), off-resonance saturation (17), and “white marker” techniques (13, 14) are expected to successfully maintain higher levels of background suppression compared with PARTS. However, the off-resonance excitation (15) and saturation (17) methods use high-energy RF pulses that yield increased SAR and limit their applicability. Meanwhile, for the “white marker” techniques (13,14), the background suppression can be degraded in areas of abrupt signal-intensity changes and tissue borders along the field-compensation direction. The inversion-recovery with on-resonant water suppression (IRON) method (16) is a different approach that provides improved flexibility by separating the imaging and contrast-generation parts of the sequence. Although the level of background suppression with IRON is comparable to that with PARTS, this level can be compromised by the recovery of the prepared magnetization during the course of acquisition (16).
The TRs prescribed for the PARTS method are typically 4–5 times shorter than even those for the more time-efficient GRE sequences. Because PARTS is based on a low-tip-angle ATR SSFP sequence, it has short acquisition times, high SNR efficiency and low SAR along with reduced flow sensitivity. As clearly observed in the in vitro and in vivo experiments, PARTS does not yield spurious signal enhancement in regions of abrupt variations in signal intensity. Furthermore, the background suppression in steady-state PARTS acquisitions does not suffer from signal-recovery related problems. PARTS can produce three-dimensional high-resolution positive-contrast images in less than a minute. The smallest number of cells imaged with the method (0.1 million in vitro) is comparable to the findings of others (15,16), but the detectability thresholds are yet to be determined.
Potential Improvements
This work has shown that low-tip-angle ATR SSFP acquisitions can successfully generate positive-contrast images of susceptibility markers, with up to 18-dB higher level of background suppression compared to conventional bSSFP methods. Meanwhile, the sensitivity of the technique will benefit from increased CNR efficiency, which can be achieved using higher field strengths or longer TRs (25).
Higher field strengths degrade the field homogeneity, whereas longer TRs increase the sensitivity to off-resonance by shrinking the spectral response in the frequency axis. For such cases, improved shimming routines can be used to decrease the field inhomogeneity (26,27). Furthermore, two additional gradient waveforms, with identical areas and opposing polarities, can be applied in a certain axis prior to and after the readout respectively (28). While the first waveform dephases and reduces the spurious positive signal due to field inhomogeneity, the second one satisfies the zero-net-moment condition required for bSSFP imaging. Therefore, these gradients can act as a complementary contrast mechanism and improve the delineation of the SPIO-induced positive signal (13,28,29).
Several potential improvements are viable under different imaging conditions. First of all, the proposed method requires two sequential acquisitions to suppress the fat signal in addition to the on-resonant signal. Although this results in increased sensitivity to motion, we did not observe significant effects on image quality due to the short acquisition times of the technique. With considerable motion or longer scan times, cardiac and respiratory gating may be used along with navigators to avoid motion artifacts. Furthermore, the suppression of the background signal with positive-contrast techniques often necessitates a separate acquisition to provide anatomical information. The proposed method can also image the anatomy at higher tip angles while still allowing a positive contrast from SPIO-labeled cells. Finally, magnetization preparation and segmented k-space acquisitions can readily be incorporated into the sequence if appropriate catalyzation schemes are used (24). Combined with the method’s speed, these modifications may enable the application of this method to the real-time tracking and guiding of interventional devices in addition to cellular imaging.
Conclusion
PARTS is a fast and reliable technique for the detection of susceptibility-generating contrast agents. The ATR SSFP spectral response is exploited to yield bright signal from susceptibility-induced magnetic field perturbations at low tip angles, while suppressing the on-resonant and fat signals. High levels of background suppression are maintained over a wide range of tip angles and tissue parameters. High-resolution positive-contrast PARTS images of SPIO-labeled stem cells have been presented in vitro and in vivo.
Acknowledgments
This work was supported by National Institutes of Health (NIH) under Grant R01 HL039297, Grant R01 HL075803 and by GE Healthcare.
The work of Tolga Çukur was supported by a Rambus Corporation Stanford Graduate Fellowship.
References
- 1.Kim JK, Kucharczy W, Henkelman RM. Cavernous hemangiomas: dipolar susceptibility artifacts at MR imaging. Radiology. 1993;187:735–741. doi: 10.1148/radiology.187.3.8497623. [DOI] [PubMed] [Google Scholar]
- 2.Weissleder R, Elizondo G, Wittenberg J, Lee AS, Josephson L, Brady TJ. Ultrasmall superparamagnetic iron oxide: an intravenous contrast agent for assessing lymph nodes with MR imaging. Radiology. 1990;175:494–498. doi: 10.1148/radiology.175.2.2326475. [DOI] [PubMed] [Google Scholar]
- 3.Bakker CJ, Hoogeven RM, Weber J, van Vaals JJ, Viergever MA, Mali WP. Visualization of dedicated catheters using fast scanning techniques with potential for MR-guided vascular interventions. Magn Reson Med. 1996;36:816–820. doi: 10.1002/mrm.1910360603. [DOI] [PubMed] [Google Scholar]
- 4.Anzai Y, Prince MR, Chenevert TL, Maki JH, Londy F, London M, Mclachan SJ. MR angiography with an ultrasmall superparamagnetic iron oxide blood pool agent. J Magn Reson Imaging. 1997;7:209–214. doi: 10.1002/jmri.1880070132. [DOI] [PubMed] [Google Scholar]
- 5.Schmitz SA, Taupitz M, Wagner S, Wolf KJ, Beyersdorff D, Hamm B. Magnetic resonance imaging of atherosclerotic plaques using superparamagnetic iron oxide particles. J Magn Reson Imaging. 2001;14:355–361. doi: 10.1002/jmri.1194. [DOI] [PubMed] [Google Scholar]
- 6.Bulte JW, Kraitchman DL. Iron oxide MR contrast agents for molecular and cellular imaging. NMR Biomed. 2004;17:484–499. doi: 10.1002/nbm.924. [DOI] [PubMed] [Google Scholar]
- 7.Frank JA, Miller BR, Arbab AS, Zywicke HA, Jordan EK, Lewis BK, Bryant LH, Bulte JW. Clinically applicable labeling of mammalian and stem cells by combining superparamagnetic iron oxides and transfection agents. Radiology. 2003;228:480–487. doi: 10.1148/radiol.2281020638. [DOI] [PubMed] [Google Scholar]
- 8.Bowen CV, Zhang X, Saab G, Gareau PJ, Rutt BK. Application of the static dephasing regime theory to superparamagnetic iron-oxide loaded cells. Magn Reson Med. 2002;48:52–61. doi: 10.1002/mrm.10192. [DOI] [PubMed] [Google Scholar]
- 9.Heyn C, Bowen CV, Rutt BK, Foster PJ. Detection threshold of single SPIO-labeled cells with FIESTA. Magn Reson Med. 2005;53:312–320. doi: 10.1002/mrm.20356. [DOI] [PubMed] [Google Scholar]
- 10.Reichenbach JR, Venkatesan R, Yablonskiy DA, Thompson MR, Lai S, Haacke EM. Theory and application of static field inhomogeneity effects in gradient-echo imaging. J Magn Reson Imaging. 1997;7:266–279. doi: 10.1002/jmri.1880070203. [DOI] [PubMed] [Google Scholar]
- 11.Bakker CJ, Seppenwoolde JH, Vincken KL. Dephased MRI. Magn Reson Med. 2006;55:92–97. doi: 10.1002/mrm.20733. [DOI] [PubMed] [Google Scholar]
- 12.Dahnke H, Liu W, Herzka D, Frank JA, Schaeffter T. Susceptibility gradient mapping (SGM): A new postprocessing method for positive contrast generation applied to superparamagnetic iron oxide particle (SPIO)-labeled cells. Magn Reson Med. 2008;60:595–603. doi: 10.1002/mrm.21478. [DOI] [PMC free article] [PubMed] [Google Scholar]
- 13.Seppenwoolde JH, Viergever MA, Bakker CJ. Passive tracking exploiting local signal conservation: the white marker phenomenon. Magn Reson Med. 2003;50:784–790. doi: 10.1002/mrm.10574. [DOI] [PubMed] [Google Scholar]
- 14.Mani V, BrileySaebo KC, Itskovich VV, Samber DD, Fayad ZA. Gradient echo acquisition for superparamagnetic particles with positive contrast (GRASP): sequence characterization in membrane and glass superparamagnetic iron oxide phantoms at 1. 5 T and 3 T. Magn Reson Med. 2006;55:126–135. doi: 10.1002/mrm.20739. [DOI] [PubMed] [Google Scholar]
- 15.Cunningham CH, Arai T, Yang PC, Xu D, McConnell MV, Pauly JM, Conolly SM. Positive contrast magnetic resonance imaging of cells labeled with magnetic nanoparticles. Magn Reson Med. 2005;53:999–1005. doi: 10.1002/mrm.20477. [DOI] [PubMed] [Google Scholar]
- 16.Stuber M, Gilson WD, Schar M, Kedziorek DA, Hofmann LV, Shah S, Vonken EJ, Bulte JW, Kraitchman DL. Positive contrast visualization of iron oxide-labeled stem cells using inversion-recovery with ON-resonant water suppression (IRON) Magn Reson Med. 2007;58:1072–1077. doi: 10.1002/mrm.21399. [DOI] [PubMed] [Google Scholar]
- 17.Zurkiya O, Hu X. Off-resonance saturation as a means of generating contrast with superparamagnetic nanoparticles. Magn Reson Med. 2006;56:726–732. doi: 10.1002/mrm.21024. [DOI] [PubMed] [Google Scholar]
- 18.Mekle R, Hofmann E, Scheffler K, Bilecen D. A polymer-based MR-compatible guidewire: A study to explore new prospects for interventional peripheral magnetic resonance angiography (ipMRA) J Magn Reson Imaging. 2006;23:145–155. doi: 10.1002/jmri.20486. [DOI] [PubMed] [Google Scholar]
- 19.Dharmakumar R, Koktzoglou I, Li D. Generating positive contrast from off-resonant spins with steady-state free precession magnetic resonance imaging: theory and proof-of-principle experiments. Phys Med Biol. 2006;51:4201–4215. doi: 10.1088/0031-9155/51/17/006. [DOI] [PubMed] [Google Scholar]
- 20.Leupold J, Hennig J, Scheffler K. Alternating repetition time balanced steady state free precession. Magn Reson Med. 2006;55:557–565. doi: 10.1002/mrm.20790. [DOI] [PubMed] [Google Scholar]
- 21.Nayak KS, Lee HL, Hargreaves BA, Hu BS. Wideband SSFP: Alternating repetition time balanced steady state free precession with increased band spacing. Magn Reson Med. 2007;58:931–938. doi: 10.1002/mrm.21296. [DOI] [PubMed] [Google Scholar]
- 22.Hardy CJ, Dixon WT. Steady-state free precession imaging with inherent fat suppression. Proceedings of the 10th Annual Meeting of ISMRM; Honolulu. 2002. p. 473. [Google Scholar]
- 23.Lin H, Raman SV, Chung Y, Simonetti OP. Rapid phase-modulated water excitation steady-state free precession for fat suppressed cine cardiovascular MR. J Cardiovasc Magn Reson. 2008;10:22. doi: 10.1186/1532-429X-10-22. [DOI] [PMC free article] [PubMed] [Google Scholar]
- 24.Hargreaves BA, Vasanawala SS, Pauly JM, Nishimura DG. Characterization and reduction of the transient response in steady-state MR imaging. Magn Reson Med. 2001;46:149–158. doi: 10.1002/mrm.1170. [DOI] [PubMed] [Google Scholar]
- 25.Dharmakumar R, Koktzoglou I, Li D. Factors influencing fast low angle positive contrast steady-state free precession (FLAPS) magnetic resonance imaging. Phys Med Biol. 2007;52:3261–3272. doi: 10.1088/0031-9155/52/11/021. [DOI] [PubMed] [Google Scholar]
- 26.Lee J, Lustig M, Kim DH, Pauly JM. Improved shim method based on the minimization of the maximum off-resonance frequency for balanced steady-state free precession (bSSFP) Magn Reson Med. 2009;61:1500–1506. doi: 10.1002/mrm.21800. [DOI] [PMC free article] [PubMed] [Google Scholar]
- 27.Kim DH, Adalsteinsson E, Glover GH, Spielman DM. Regularized higher-order in vivo shimming. Magn Reson Med. 2002;48:715–722. doi: 10.1002/mrm.10267. [DOI] [PubMed] [Google Scholar]
- 28.Koktzoglou I, Li D, Dharmakumar R. Dephased FLAPS for improved visualization of susceptibility-shifted passive devices for real-time interventional MRI. Phys Med Biol. 2007;52:277–286. doi: 10.1088/0031-9155/52/13/N01. [DOI] [PubMed] [Google Scholar]
- 29.Bieri O, Patil S, Quick HH, Scheffler K. Morphing steady-state free precession. Magn Reson Med. 2007;58:1242–1248. doi: 10.1002/mrm.21421. [DOI] [PubMed] [Google Scholar]


