Abstract
Time-of-flight secondary ion mass spectrometry and atomic force microscopy are employed to characterize a wedge-shaped crater eroded by a 40keV C60+ cluster ion beam on an organic film of Irganox 1010 doped with Irganox 3114 delta layers. From an examination of the resulting surface, the information about depth resolution, topography and erosion rate can be obtained as a function of crater depth for every depth in a single experiment. It is shown that when measurements are performed at liquid nitrogen temperature, a constant erosion rate and reduced bombardment induced surface roughness is observed. At room temperature, however, the erosion rate drops by ~1/3 during the removal of the 400 nm Irganox film and the roughness gradually increased to from 1 nm ~4 nm. From SIMS lateral images of the beveled crater and AFM topography results, depth resolution was further improved by employing glancing angles of incidence and lower primary ion beam energy. Sub-10 nm depth resolution was observed under the optimized conditions on a routine basis. In general, we show that the wedge-crater beveling is an important tool for elucidating the factors that are important for molecular depth profiling experiments.
INTRODUCTION
Molecular depth profiling with energetic polyatomic primary ions has now been demonstrated to be feasible for a number of model systems consisting of thin films of lipids, metabolites, polymer additives and polymers.1–7 By combining depth profiling with imaging, 3-dimensional information can also be achieved as shown using both model systems and biological cells.8–10 The basic idea is to bombard the sample with a fluence of polyatomic ions that is sufficient to remove up to several microns of material from the sample surface, typically requiring 1013 to 1015 ions-cm−2 of primary ion fluence. With atomic ions and cluster ions that contain a small number of atoms, this amount of fluence typically leads to chemical damage accumulation which destroys the fundamentally important molecular specificity.11–14 For larger polyatomic projectiles such as C60 and Ar1500, however, the characteristic high sputtering rate allows any chemical damage to be removed as quickly as it is created.15–18
Now that molecular depth profiling appears to be a practical strategy, there is considerable interest in determining the factors that yield the highest quality result. For example, it is desirable to minimize damage accumulation and maximize the depth resolution observed when eroding through interfaces.3–4 So far, the makeup, kinetic energy and angle of incidence of the primary particle as well as the target temperature have been shown to influence these factors.4, 6, 19–22 Depth resolution has been proposed to be related to topography formation during erosion.3 Many of these issues have been discussed in connection with a standard sample of Irganox 1010 constructed to contain buried delta layers of Irganox 3114.3, 22–24 This sample was prepared at the National Physical Laboratory (Middlesex, UK) and studied by 12 different laboratories in round-robin fashion.25
Recently we have acquired molecular depth profiles by using a wedge crater sputtering strategy.26 With this scheme, a beveled structure is cut into the organic thin film by adjusting the incident cluster ion beam fluence to remove more material from one end of the crater than the other.27–29 Typically, the wedge is created from a 500 µm by 500 µm crater with a beveling angle measured with respect to the surface of about 0.03°. This small angle leads to lateral amplification of buried structures so that nm features can be resolved using conventional SIMS imaging. From a detailed characterization of the surface of the wedge using atomic force microscopy (AFM), the sputtering rate, topography and depth resolution can be obtained continuously at every point in the depth profile.26 Hence, this configuration provides a wealth of information that is useful in obtaining a fundamental understanding of the important phenomena associated with molecular depth profiling, and in determining the parameters needed to optimize depth resolution and minimize chemical damage accumulation.
Although these preliminary results show that the important parameters can be easily measured, it remains to be shown whether the beveling process itself introduces artifacts that might prevent the results from being directly employed to elucidate normal molecular depth profiles. Here, we examine this issue in considerable detail. The results show that the depth resolution acquired by SIMS imaging on the bevel in some circumstances do indeed provide an excellent model for the erosion process. Moreover, the wedge provides a convenient platform for assessment of the factors that degrade depth profiles. We show, for example, that the depth resolution at organic interfaces can be reduced to 8 nm when utilizing glancing incident angles and low temperature, even after erosion through several hundred nanometers into a buried interface. This value appears not to be influenced by topography formation since the AFM data show the surface roughness remains around 1 nm throughout the bevel. These studies also suggest that temperature effects are exceedingly important in inhibiting chemical damage and topography. The wedge strategy reveals that several different mechanisms appear to be contributing to this observation. In general, we suggest that wedge crater sputtering is a unique and powerful way to characterize molecular depth profiling and will be an important asset in performing 3-dimensional imaging experiments, particularly on biological samples.
EXPERIMENTAL SECTION
Materials and Samples
The samples were manufactured at The National Physical Laboratory, U.K.3 Silicon substrates of 10 mm × 10 mm were cleaned and treated before insertion into an Edwards AUTO306 vacuum coater with Irganox 1010 and Irganox 3114 (CIBA, Macclesfield, U.K.) held in crucibles. A quartz crystal microbalance (QCM) was used to monitor the thickness of the layers during vapor deposition. Delta layers of Irganox 3114 were embedded into the Irganox 1010 coated Si substrates. The thickness accuracy of each delta layer is ± 0.3 nm.22 The film thicknesses of each layer from surface to substrate are listed in Table 1.
Table 1.
Structure of the Irganox 1010/3114 delta layer sample manufactured by NPL in the course of a recent VAMAS interlaboratory study22, 25 Four Irganox 3114 delta layers are embedded into an Irganox 1010 matrix film of approximately 400 nm thickness deposited on a silicon substrate.
| Layer | Type | Thickness (nm) |
|---|---|---|
| 1 | 1010 | 47.6 |
| 2 | 3114 | 3 |
| 3 | 1010 | 48.2 |
| 4 | 3114 | 3.1 |
| 5 | 1010 | 95.1 |
| 6 | 3114 | 3.7 |
| 7 | 1010 | 95.6 |
| 8 | 3114 | 3.7 |
| 9 | 1010 | 95.1 |
| Irganox | 395.1 |
Instrumentation
Experiments were performed using TOF-SIMS instrumentation previously described.30 For the studies presented here, the instrument is equipped with a 40 keV-C60+ primary ion source (IOG 40–60, Ionoptika, Southampton, UK). The beam produced by this source is directed toward the sample surface at an angle of 40° relative to the surface normal. The beam is mass selected via a wien filter and is focused to a spot size ranging from 5 ~ 8 µm for a DC beam and 7 ~ 12 µm for pulsed beam after passing through a 300 µm beam-defining aperture. The dc current measured at a Faraday cup is typically 20–200 pA depended on focus. Some experiments were performed at 20 keV by reducing the extraction voltage from the source.
The mass spectrometer itself was operated in delayed extraction mode with a 50-ns delay time between the primary ion pulse of 50-ns and the secondary ion extraction pulse. This procedure allows the ion impact to occur with the sample at ground potential and in a field-free region. We have found that under these circumstances, charge compensation is not necessary as long as more than one positive ion is emitted from the sample for each C60+ impact. The sample block could be cooled by passing liquid nitrogen directly through the sample holder. The sample temperature during this cooling process was typically 100 K, as determined by a thermocouple measurement.
To change the angle of incidence of the primary ion beam, a special sample holder was fabricated with a beveled angle of 31°, yielding an impact angle of 71° during sputter erosion. Since this configuration distorts the extraction field during SIMS analysis, the craters were subsequently imaged using the standard flat sample mount with the C60+ beam incident at 40°.
For crater erosion, the C60+ ion beam is rastered in dc mode over a 550 µm×420 µm area with a resolution of 256 × 256 pixels. The dwell time on each pixel was restricted to 10 µs during each pass to minimize any possible redeposition of material into nearby regions. The protocol for wedge creation has been described in some detail previously in connection with inorganic depth profiling experiments.27 The idea is to control the ion beam fluence at each pixel such that a beveled crater bottom is produced.
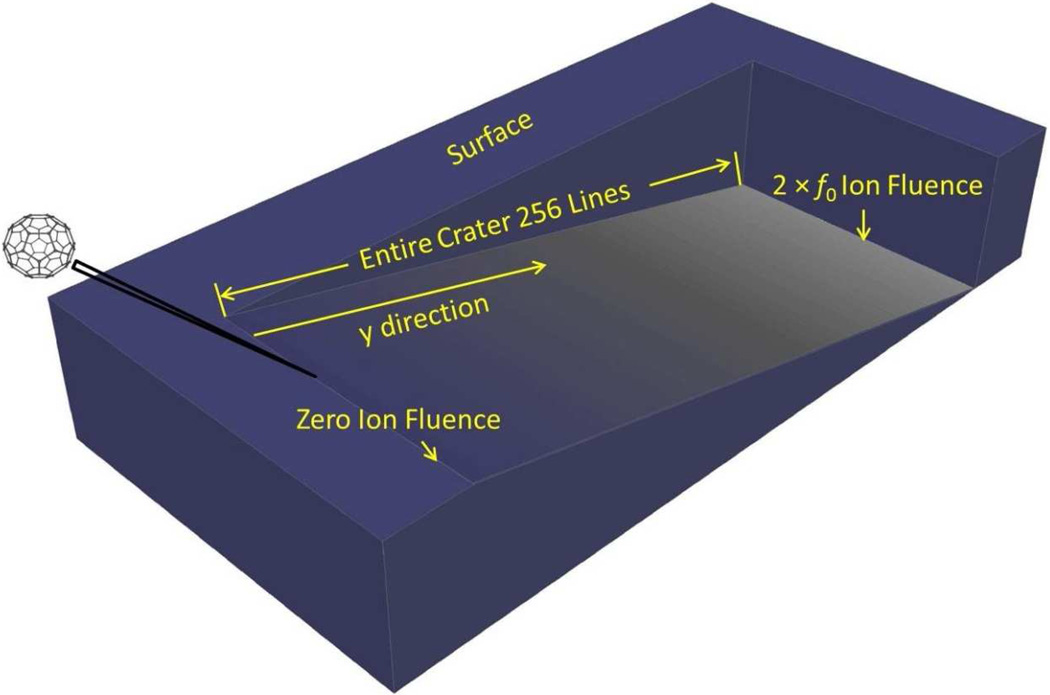
Creation of the wedge-shaped crater is easily accomplished using a simple algorithm to determine which pixels are bombarded by the C60+ beam and for how long. Our protocol, as illustrated in Figure 1, involves setting up a series of frames. For the first frame, each of the 256 × 256 pixels receives the same ion fluence. In the second the frame, the first line corresponding to 256 pixels in the y direction is skipped, with the same fluence being applied to the remaining pixels. Subsequent frames are acquired with an additional line of y pixels skipped each time. In this way, the lines of pixels along the y direction receive linearly increasing ion fluence. For the entire crater, the applied ion fluence is
| (1) |
where Ly is the crater dimension in the y direction (550 µm) and f0 is the average applied ion fluence on the entire crater. The SIMS images are acquired in pulsed mode, with negligible ion fluence and a raster field-of-view covering the entire erosion area.
Figure 1.
The top cross-section view of the wedge crater process. A C60+ primary ion source is used to remove material in a rastered area divided into 256 pixels × 256 pixels. A wedge-shaped crater is eroded by applying an increasing ion fluence along the y direction of the raster area. The resulting crater contains information from zero to 2 ×f0projectile ion fluence. Depth profile information is obtained by taking a SIMS image of the resulting crater bottom. In this case, the y dimension of the crater is 600 µm, and the maximum depth is 400 nm. Note that the angle of the wedge with respect to the surface is .
Atomic Force Microscopy (AFM) Measurement
Surface topography, crater depth and size were characterized using AFM (Nanopics 2100, KLA-Tencor, San Jose, CA). Measurements were performed by removing the sample from the SIMS instrument and immediately placing it in the AFM for analysis. There is some question as to whether material moves as a function of time,3 although our measurements yielded identical results for up to many hours after crater formation. The 1 mm × 1 mm maximum scanning area of AFM in contact mode allows a convenient one-step measurement of the entire wedge-shaped sputter crater. Extreme care was taken to correct the obtained images for curvature effects by making sure that line scans taken outside of and parallel to the eroded crater were flat.
RESULTS AND DISCUSSION
Previous studies have shown that by utilizing the topological precision of AFM to characterize a beveled crater the topographical line scan along the y direction of the wedge crater can be converted into roughness and erosion rate curves.26 Briefly, the macroscopic lateral derivative of the eroded depth reflects the depth dependent erosion rate, whereas the microscopic fluctuations reflect the surface roughness. The purpose of this work is to fully utilize the wedge strategy to examine the factors that influence surface topography and the erosion rate, with the goal of gaining fundamental insights into the factors that are involved. At the same time, the strategy provides an opportunity to optimize the depth resolution by investigating the effect of temperature, incident angle and primary ion beam energy on the shape of the resulting wedge-crater.
Surface Roughness
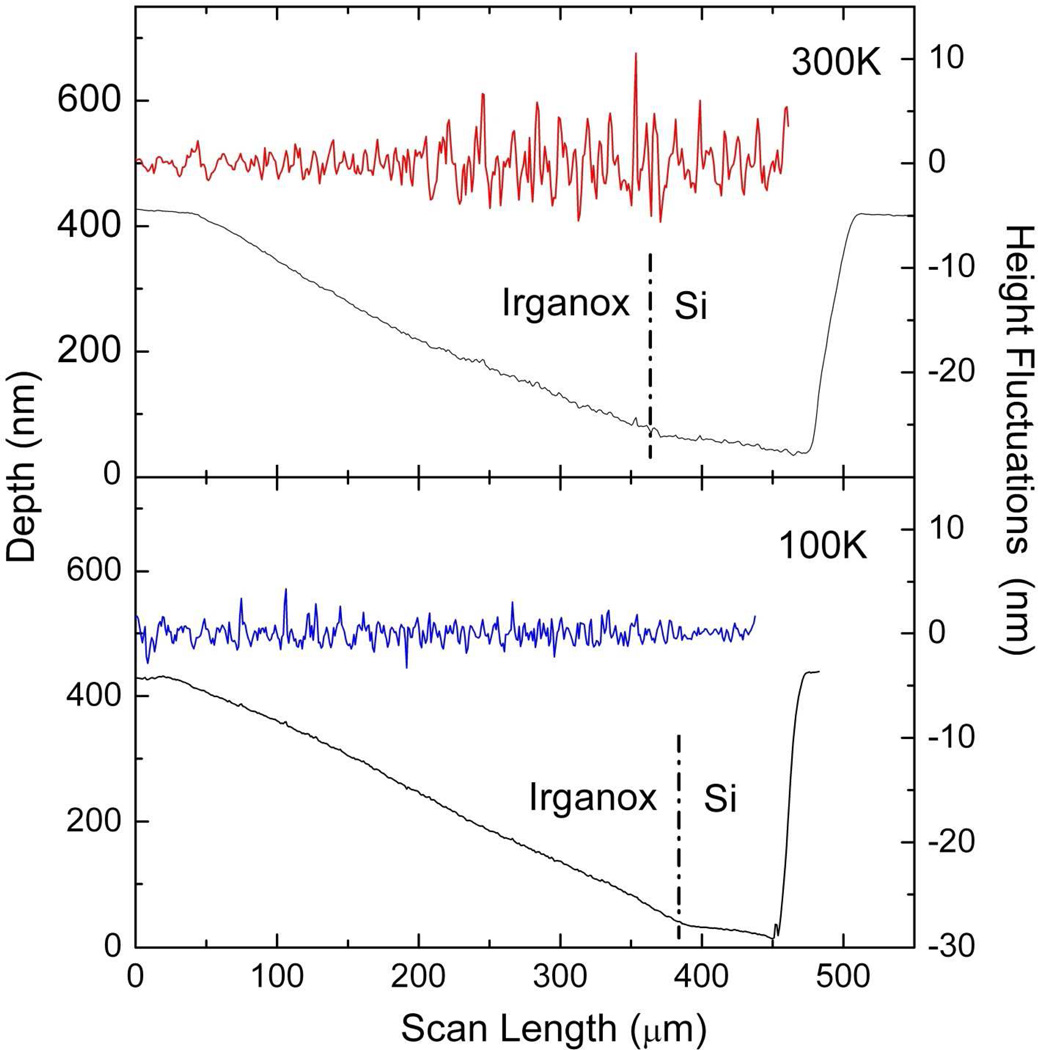
To evaluate the surface roughness as a function of the eroded depth, the microscopic height fluctuations obtained from the AFM data are analyzed as previously described.26 In order to eliminate the macroscopic depth variations, the AFM topography scan is first smoothed by a 36-point Savitzky-Golay algorithm, resulting in a curve representing the average height of the depth for each point in the crater. By subtracting this curve from the unsmoothed AFM data, the microscopic height fluctuations representing the surface roughness can be obtained. The results acquired at room temperature and liquid nitrogen temperature are shown in Figure 2. The roughness build-up during the removal of the Irganox film is obvious if the ion bombardment is performed at room temperature. Height fluctuations at room temperature (red curve) are less than 1 nm on the initial surface, increase to ~ 3 nm at roughly 200 nm depth, and continue to increase until reaching the Si substrate. At liquid nitrogen temperature (blue curve), the roughness remains constant throughout the removal of the entire organic layer. After reaching the Si interface, the height fluctuations dropped at both room and liquid temperature.
Figure 2.
AFM topography scan along the wedge shaped crater eroded into a 400-nm Irganox 1010 film doped with four Irganox 3114 delta layers by a 40-keV C60+ ion beam impinging at 40° with respect to the surface normal. Upper panel: ion erosion with the sample at room temperature. Lower panel: ion erosion performed at liquid nitrogen temperature. The red and blue curves represent the roughness fluctuations around the average crater profile calculated by smoothing the AFM scan data as described in the text.
For a more quantitative assessment, we determine the rms roughness value Rq as a running average
| (2) |
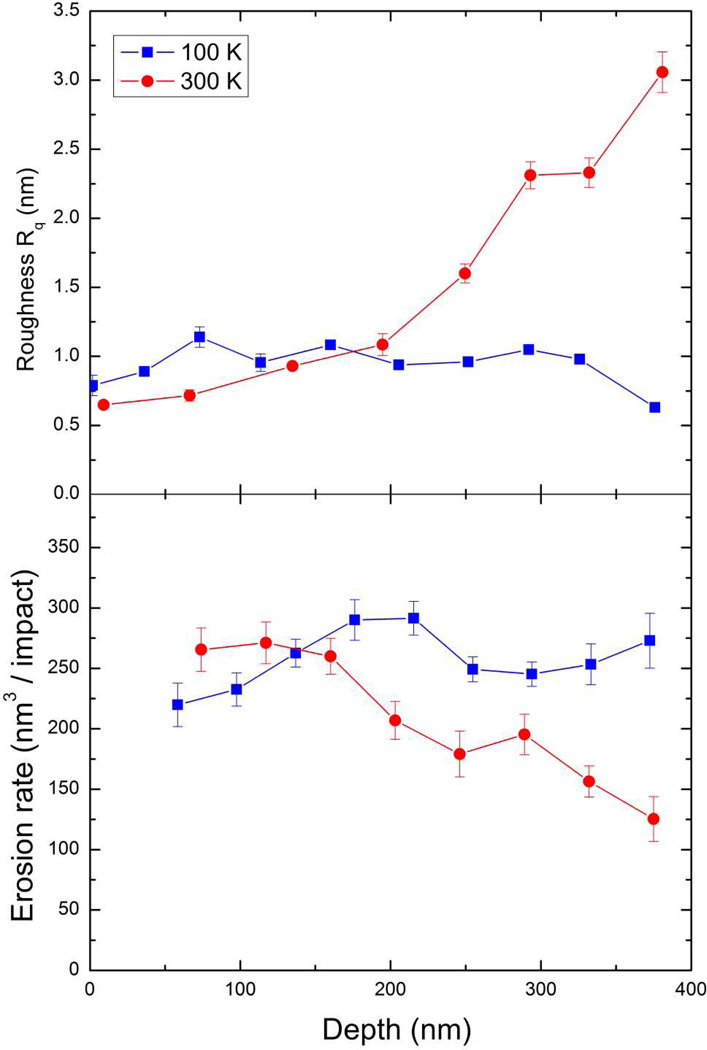
taken over 2N data points around a specific point (i) in the line scan. Using N = 20, these values are plotted as a function of eroded depth in upper panel of Figure 3. The error bars reflect the standard deviation of Rq determined with the center points (i) being displaced by up to five points to each side of a plotted data point. The roughness starts low at the surface with Rq values less than 1 nm at both room temperature and liquid nitrogen temperature. The roughness remains low during erosion of the entire film at liquid nitrogen temperature. At room temperature, on the other hand, the roughness starts to increase at ~200 nm eroded depth and keeps increasing until reaching the Si substrate, resulting in Rq ~ 3 nm at this point. These roughness data are extremely valuable because they are obtained as a function of real eroded depth at every point of the beveled crater. These data would be difficult to acquire in a conventional depth profile since multiple carters would be required at each depth for subsequent AFM analysis.
Figure 3.
Upper panel: RMS roughness (Rq value, see text) as a function of temperature and eroded depth during sputtering of the Irganox 1010/3114 delta layer film with a 40-keV C60+ ion beam impinging at 40° with respect to the surface normal. Lower panel: Erosion rate (see text) as a function of eroded depth during bombardment of the Irganox 1010 / 3114 delta layer film at two different sample temperatures. Both wedge craters were created by a 40-keV C60+ ion beam impinging at 40° with respect to the surface normal.
Erosion Rate
Due to the linear relation between scan length y and ion fluence as given in eq. (1), the erosion rate can be calculated from the AFM data,26 as the numerical derivative of the smoothed topographical line scan. To show the erosion rate variation as a function of eroded depth, the average of the derivative was calculated for sets of 40 data points, and the resulting value was plotted at the depth corresponding to the center of each of these intervals. The erosion rate for room temperature (red solid dots) and liquid nitrogen temperature (blue solid dots) are shown in the lower panel of Figure 3, where the error bars reflect the standard deviation of the straight line slope fits determined for each interval.
In general, the sputter yield volume ranges from 120 ~ 300 nm3/impact for a 40-keV C60+ ion beam. At room temperature, the erosion rate starts to drop after removal of about 150 nm and continues to drop throughout the erosion of the rest of the organic film, where it has finally decayed to about 60% of the original surface value before reaching the Si substrate. Interestingly, the decay of the erosion rate begins rather abruptly and appears to be correlated with the buildup of surface roughness. If the analysis is performed at liquid nitrogen temperature, the erosion rate remains at the same level as the initial rate, and no decrease is observed during the removal of the entire Irganox film.
Depth Resolution
Depth resolution during molecular depth profiling is one of the most important parameters since the value ultimately determines the range of applications for this methodology. The sample investigated here consists of a 395 nm thin film of Irganox 1010 doped with four delta layers of Irganox 3114 with thicknesses ranging from 3.0 to 3.7 nm located at depths of 47, 97, 194, and 293 nm below the surface.22, 25.
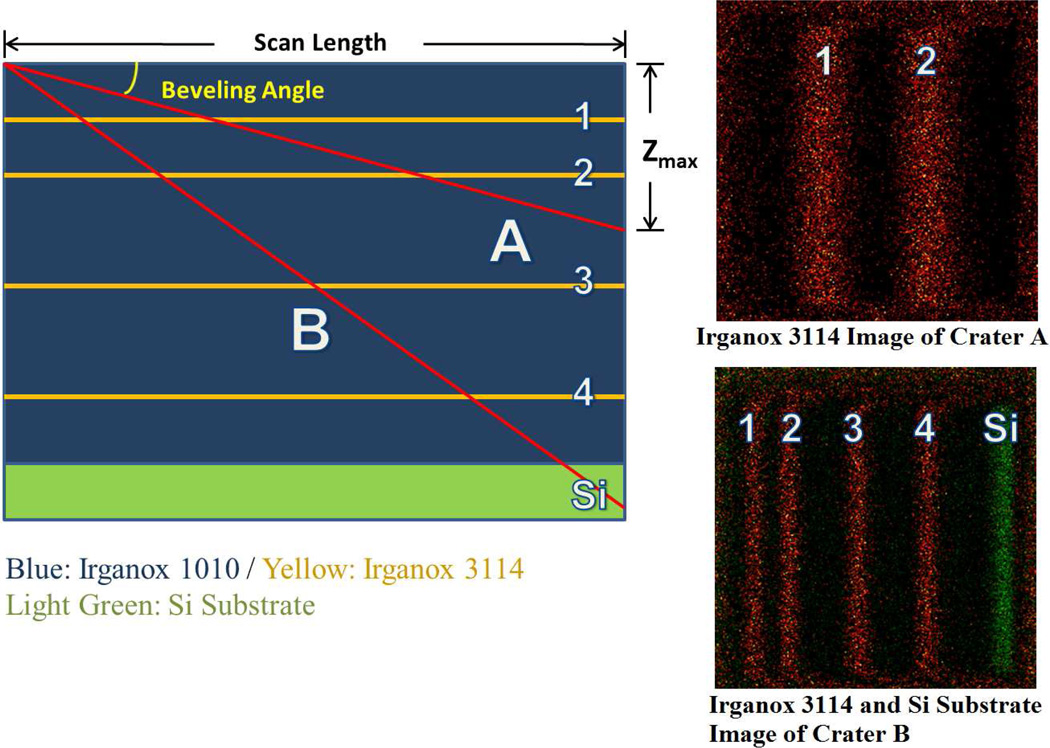
In wedge experiments of laterally homogenous layers, a depth profile can be obtained by taking a single SIMS image of the eroded beveled crater. This concept is illustrated in Figure 4, which shows the imaging plane of two wedges eroded to different maximum depth zmax as red lines. In the SIMS image, the delta layers can be identified as stripes of the highest intensity Irganox 3114 specific signal CNO− at m/z 42, which is shown for two different beveling angles (A and B) in the upper and lower right panels of Figure 4, respectively. It is obvious that the lateral width of these stripes must be connected to the beveling angle and the apparent vertical width Δz of the layer. The full width half maximum (FWHM) of the 1st and 2nd stripe can be measured by means of a line scan across such an image, and the apparent depth resolution is calculated from this width as
| (3) |
Figure 4.
Left panel: schematic illustration of the wedge shaped crater imaging technique used to identify the Irganox 3114 delta layers (yellow) embedded into the Irganox 1010 matrix (blue) film deposited on a silicon substrate (green). Right panels: SIMS images of the Irganox 3114 specific secondary ion signal at m/z 42 taken on the wedge shaped crater bottom for two different beveling angles as indicated by the red lines.
In the experiments performed here, the images were taken using a slightly larger rastering area than used during sputter erosion. Hence, the scan length entering eq. (3) is the same as the respective crater dimension in eq. (1), and therefore both Ly and zmax can be determined from the AFM measurement of the eroded crater.
Calculation of the depth resolution from eq. (3) implicitly assumes there is a linear relation between depth and ion fluence (i.e., the y coordinate along the line scan), which in turn relies on the assumption of a constant erosion rate. An advantage of the wedge depth profiling experiment is that this assumption is not necessary, since the determination of the depth resolution can be based on the actual depth scale taken from the AFM data. For that purpose, a scan across the AFM crater data is made along the same line as that performed across the SIMS image, thereby allowing us to determine the actual eroded depth z at every point y along the line scan. From the resulting z(y) data, the SIMS line scan can then be converted into a true depth profile even in cases where the erosion rate strongly varies as a function of eroded depth.
The improvements of depth resolution have been reported by optimizing the experimental conditions, including lowering sample temperature, reducing primary ion beam energy, and increasing impact angle.4, 22, 29 In order to investigate the wedge depth profiling strategy and compare it to standard depth profiling results, similar conditions were investigated and analyzed.
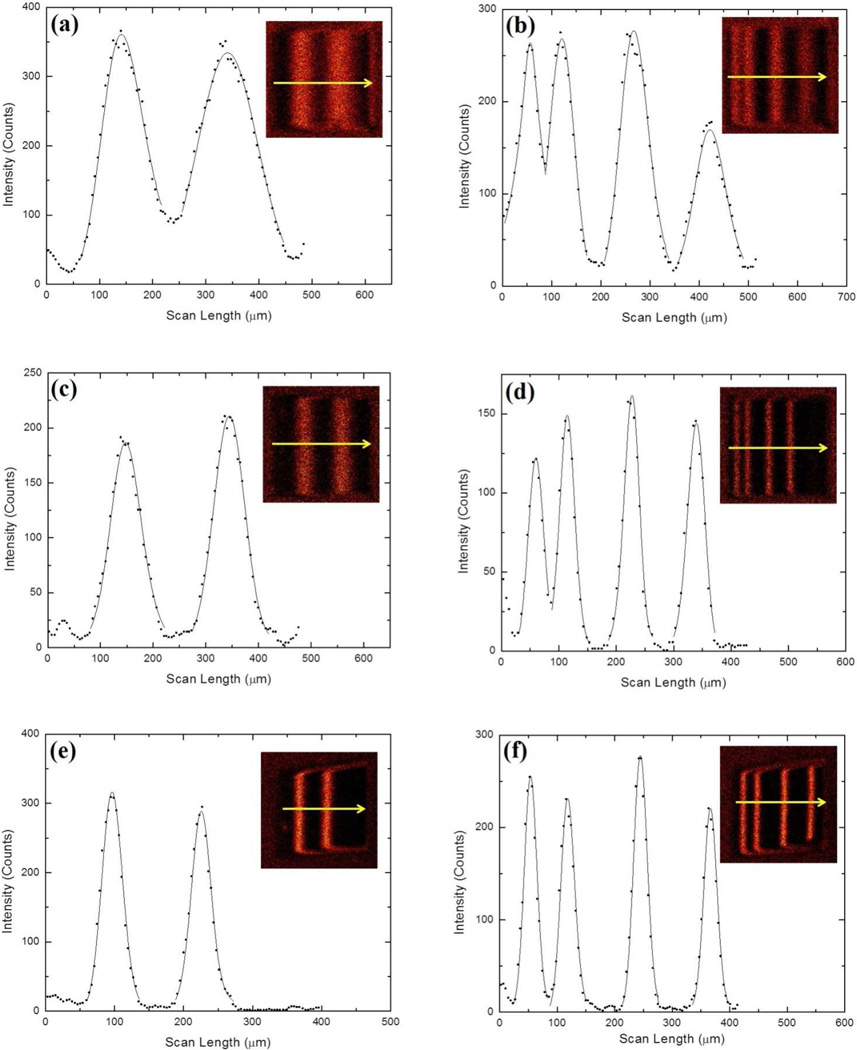
The SIMS images of the Irganox 3114 signal including line scans along the indicated arrows obtained under four different sets of experimental conditions are shown in Figure 5. The data in the upper row were measured at room temperature with the ion beam impinging at 40° with respect to the surface normal. The data displayed in the middle row were obtained at low temperature using the same impact angle, and the lower panels refer to an increased impact angle of 71° eroded at low temperature. The left and right columns refer to two different beveling angles by eroding the wedge to different depths zmax. All three sets of experiments were performed with a 40-keV C60+ ion source, wedge crater sizes ranging from 500 to 600 µm and typical erosion times from 10 to 60 minutes depending upon the value of zmax and primary ion beam current. The apparent depth resolutions Δz for the four delta layers determined under those conditions are shown in Table 2.
Figure 5.
SIMS images of the Irganox 3114 specific secondary ion signal at m/z 42 (inserts) and line scans of the respective signal intensity along the lines indicated by the arrows as obtained after erosion of a wedge shaped crater under different experimental conditions. Top panels: ion erosion at room temperature under 40° incidence; Middle panels: ion erosion at 100 K under 40° incidence; lower panels: ion erosion at 100 K under 71° incidence with respect to the surface normal. The left and right columns refer to two different or beveling angles characterized by the maximum eroded depth zmax at the deepest side of the wedge shaped crater. Left panels: partial with zmax ~ 120 nm (between 2nd and 3rd delta layer); Right column: wedge erosion down to the silicon substrate with zmax ~ 450 nm. All wedged craters were eroded under bombardment with a 40-keV C60+ ion beam.
Table 2.
Apparent depth resolution (FWHM) determined from line scans across SIMS images of the Irganox 3114 specific secondary ion signal CNO− at m/z 42 as described in the text. The data refer to different experimental conditions regarding the sample temperature, the incidence angle and energy of the bombarding C60+ ion beam and the beveling angle of the eroded wedge shaped crater. Upper rows: crater eroded to maximum depth between 2nd and 3rd delta layer (zmax ~ 120 nm); lower rows: crater eroded down to silicon substrate (zmax ~ 400 nm).
| Depth Resolution |
300 K 40 keV C60+ 40° Impact |
100 K 40 keV C60+ 40° Impact |
100 K 40 keV C60+ 71° Impact |
100 K 20 keV C60+ 71° Impact |
Regular DP 300 K, 40° 40 keV C60+ |
Regular DP 100 K, 40° 40 keV C60+ |
Beveling Angle |
|---|---|---|---|---|---|---|---|
| 1st Layer | 20 nm | 16 nm | 10 nm | 8 nm | 18 nm | 17 nm | 0.01° |
| 2nd Layer | 27 nm | 17 nm | 10 nm | 8 nm | 23 nm | 18 nm | 0.01° |
| 1st Layer | 40 nm | 25 nm | 13 nm | 18 nm | 17 nm | 0.04° | |
| 2nd Layer | 45 nm | 27 nm | 15 nm | 23 nm | 18 nm | 0.04° | |
| 3rd Layer | 48 nm | 31 nm | 15 nm | 30 nm | 18 nm | 0.04° | |
| 4th Layer | 45 nm | 29 nm | 14 nm | 22 nm | 0.04° |
There are important trends apparent in the data. First, as already noted the depth resolution clearly improves when performing the experiment at 100 K rather than at room temperature and is further improved by sputtering at glancing impact angle. Second, the apparent width of the delta layer peaks visible in Figure 4 increases with increasing layer depth at room temperature, whereas it remains practically the same for all four layers if the erosion is performed at low temperature. Inspection reveals that this effect is entirely caused by the depth dependent decrease of the erosion rate. The depth resolution remains constant within error limits if the nonlinear fluence-to-depth conversion is taken into account (see Table 2). The third key observation is that the depth resolution measured for the 1st and 2nd delta layer at the smaller beveling angle (i.e., when the wedge shaped craters were eroded to only about 120 nm maximum depth) is similar to that obtained using a regular depth profiling protocol under otherwise identical experimental conditions.
Another central criterion needed to evaluate the effectiveness of our protocol is to determine whether the measured depth resolution obtained from wedge craters is identical to that obtained by direct depth profiling experiments,3, 6, 31 under all conditions or whether other factors need to be considered. At this point, the answer to this question is not straightforward. In general, we find that for small beveling angles and for small values of zmax, very good agreement is found between the two approaches as seen by comparing the first and regular depth profile column of Table 2. As the beveling angle is increased, however, the measured depth resolution becomes considerable larger than that obtained by conventional means.
The apparent depth resolution is observed to be significantly worse when the beveling angle is increased by eroding the wedge shaped crater to 400 nm maximum depth. Since the ion fluence applied to expose a particular delta layer is independent of the beveling angle, this apparent broadening cannot be induced by a vertical broadening of the delta layer response caused, for instance, by ion induced interlayer mixing effects. It must therefore be caused by a peculiarity of the conversion from lateral to vertical resolution via the wedge shaped crater. The thickness of each Irganox 3114 delta layer is about 3nm. In the absence of vertical broadening effects, the lateral width of the delta layer exposed by the beveled cross section can be calculated as
| (4) |
Taking the data obtained at liquid nitrogen temperature and 40° impacts for example, for a 580 µm crater, when the wedge was eroded to 120 nm, the 1st layer exposed width should be 14.5 whereas the measured width is 94 µm, corresponding to 19 nm depth resolution. When the wedge is eroded to 400 nm, the 1st layer exposed width should be 4.35 µm, and hence the 1st layer FWHM should be 28 µm according to the calculation from eq. (4). However, the measured FWHM is much larger (51 µm), which converts to an apparent depth resolution of about 40 nm after depth scale calibration.
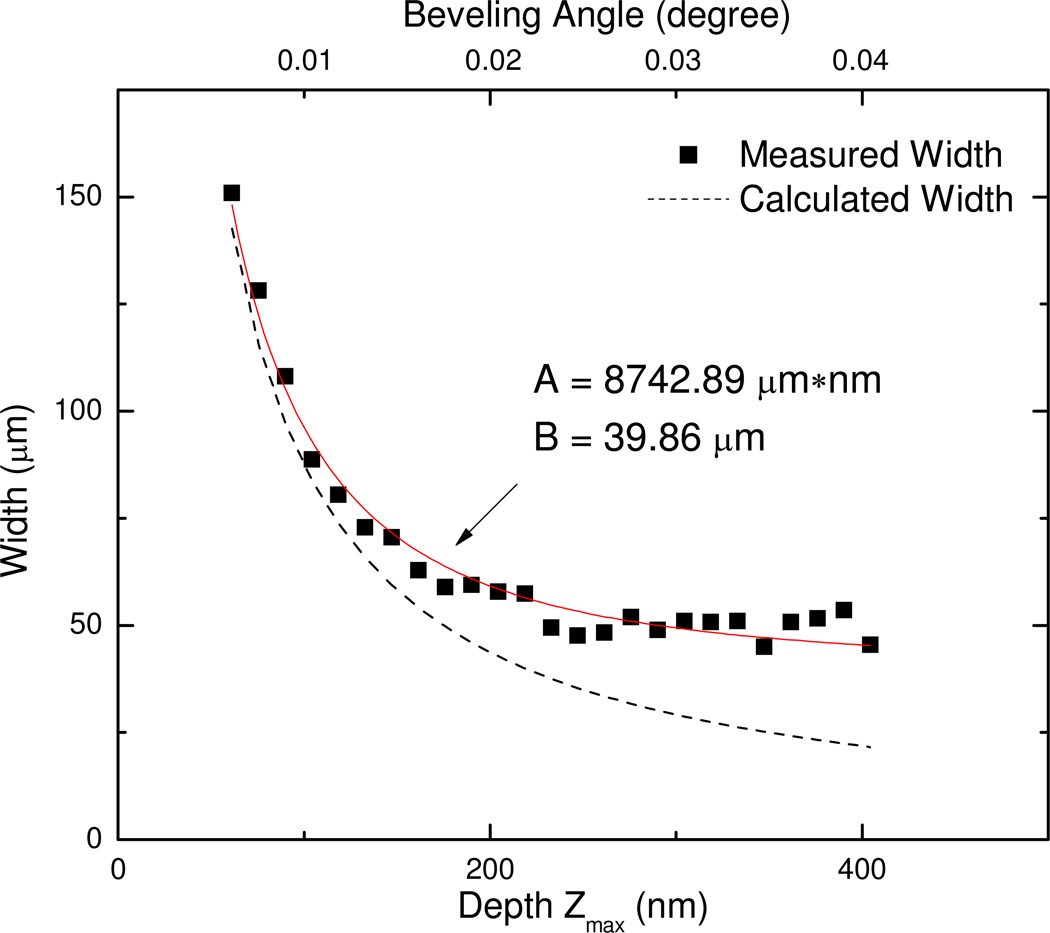
Apparently other factors besides fluence dependent interlayer mixing are causing the broadening of the measured strip width in the SIMS image with increasing beveling angle. In principle, this observation is expected, because the lateral resolution during acquisition of the SIMS image must enter the measured FWHM, which is ultimately restricted by the primary ion beam width. In order to understand the role of this restriction, a series of experiments were carried out where the erosion of the wedged shaped crater was stopped at different depths and SIMS images were taken from the resulting crater in a way similar to a standard imaging depth profile. The experiment was performed under 40° incidence at low temperature, and data acquisition was started when the first delta layer showed up in the image and ended when the entire film was removed at the deep side of the crater. The lateral width (FWHM) of the 1st Irganox 3114 delta layer was determined and plotted as the function of eroded maximum depth zmax in Figure 6. The dark squares are the measured FWHM of the 1st Irganox 3114 delta layer. It is seen that the FWHM of the 1st layer starts from 150 µm and decreases to about 50 µm with increasing beveling angle, where it appears to become constant. Since the experiment was performed under conditions where the erosion rate remains constant, eq. (4) should hold and the measured FWHM strip width should be given as
| (5) |
Figure 6.
Measured width (FWHM) of the m/z 42 secondary ion signal peak representing the uppermost Irganox 3114 delta layer in the line scans as depicted in Figure 5 as a function of beveling angle characterized by maximum crater erosion depth zmax as indicated in Figure 4. Black dots: experimental data; Solid line: least square fit of eq. (6) to the experimental data; Dotted Line: calculation according to eq. (5) by setting the fitting parameter B to zero.
This relation is plotted as a dotted line in Figure 6, and it is obvious that it does not describe the experimental data correctly. Fitting a function
| (6) |
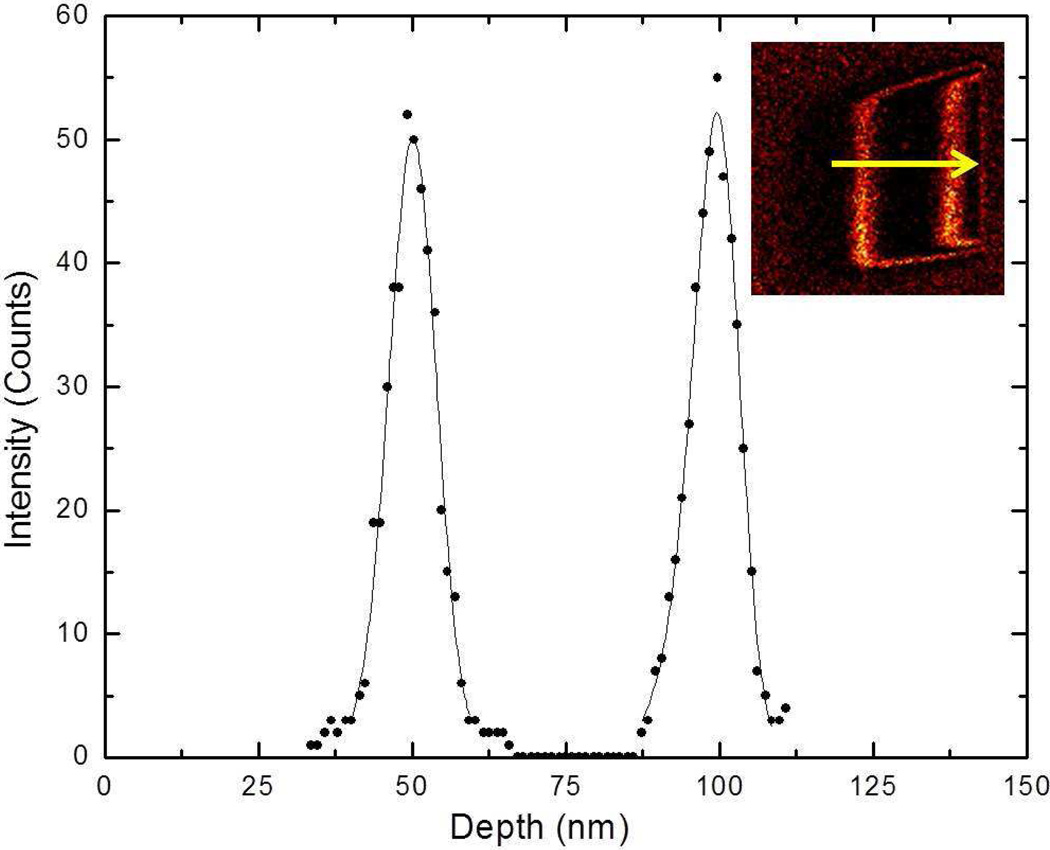
to the data, we obtain parameters A = Δz · Ly and B as indicated in the Figure which can then be used to determine the actual vertical broadening Δz of the delta layer response function as the ultimate depth resolution achievable in this experiment. From the known scan length Ly = 580 µm, we obtain Δz ~ 15 nm, which is very close to the values measured at zmax = 120 nm. I f the same experiment is performed under oblique ion incidence at 71° impact angle and at a reduced impact energy of 20-keV during erosion, we obtain the data displayed in Figure 7, which translate into an apparent depth resolution of about 8 nm.
Figure 7.
Depth profile of 1st and 2nd Irganox 3114 delta layers obtained using the wedge crater imaging technique at low temperature and oblique ion incidence. Crater erosion was performed at 100 K with a 20-keV C60+ primary ion beam impinging under 71 ° with respect to the surface normal. Insert: image of the m/z 42 secondary ion signal acquired at this experimental conditions. The plot was derived from a line scan as indicated in the image with the depth scale being calibrated from AFM data as described in the text. Measured depth resolution (FWHM) for 1stand 2ndlayer:8.2 and 7.9 nm, respectively.
If the wedge is eroded deeper, the measured apparent depth resolution is worsened by the constant width B, which is of the order of 40 µm in this example. At present, it is not clear what may cause this additional lateral broadening, which is significantly larger than the imaging ion beam width of about 12 µm (FWHM). A similar analysis of the data obtained under 71° incidence (again at 100 K) reveals Δz ~ 8 nm and B ~ 21 µm, respectively, measured with an imaging ion beam width of 8 µm (FWHM). Interestingly, both Δz and B appear to be reduced by approximately the same factor as compared to the 40° impact angle measurement. At present, we can only speculate about possible reasons for the observed lateral broadening. In principle, surface roughness could lead to such an effect, but the resulting broadening would be independent of zmax only if the rms roughness value would increase linearly with the crater beveling angle. However, the AFM data provide no indication of such an effect, which would also be difficult to explain since the ion fluence (or erosion depth) needed to expose a delta layer is independent of the beveling angle. Another possible cause of image broadening would be the lateral relocation of surface material during the ion beam erosion. Although computer simulations suggest that lateral movement is indeed possible,12 the modeling suggests that the magnitude of the effect is on the order of a few hundred nanometers, much less than the tens of microns suggested by the data in Figure 6. Determination of origin of this effect could provide important insight into the sputtering process, since it is currently not predicted by any theory. The wedge protocol may hence provide an interesting platform for examining the dynamics of material motion.
CONCLUSION
We demonstrate that an organic delta layer system (Irganox delta layers) can be successfully characterized by combining wedge molecular depth profiling and AFM. Fundamental parameter associated with molecular depth profiling including surface roughness, erosion rate and depth resolution can be easily determined as a function of the primary ion dose. Depth resolution can be measured directly from the converted actual depth scale depth profile and is comparable to regular depth profiling. Preliminary evidence is also presented that suggests that there may be a large amount of material motion in the lateral plane that would not be observed under normal conditions. In general, we show that the wedge crater strategy can provide an important investigative tool for unraveling the complexities of molecular depth profiling.
ACKNOWLEDGMENT
Financial support from the National Institute of Health under Grant No. 2R01 EB002016-18, the National Science Foundation under Grant No. CHE-0908226, and the Department of Energy Grant No. DE-FG02-06ER15803 is acknowledged. The authors are grateful to Alex Shard for providing the delta-layer sample.
Contributor Information
Dan Mao, The Pennsylvania State University, Department of Chemistry, University Park, PA 16802, USA.
Caiyan Lu, The Pennsylvania State University, Department of Chemistry, University Park, PA 16802, USA.
Nicholas Winograd, Email: nxw@psu.edu, The Pennsylvania State University, Department of Chemistry, University Park, PA 16802, USA.
Andreas Wucher, Faculty of Physics, University of Duisburg-Essen, 47048 Duisburg, Germany.
REFERENCE
- 1.Mahoney CM, Roberson SV, Gillen G. Depth profiling of 4-acetamindophenol-doped poly(lactic acid) films using cluster secondary ion mass spectrometry. Anal Chem. 2004;76(11):3199–3207. doi: 10.1021/ac035532n. [DOI] [PubMed] [Google Scholar]
- 2.Wagner MS. Molecular depth profiling of multilayer polymer films using time-of-flight secondary ion mass spectrometry. Anal Chem. 2005;77(3):911–922. doi: 10.1021/ac048945c. [DOI] [PubMed] [Google Scholar]
- 3.Shard AG, Green FM, Brewer PJ, Seah MP, Gilmore IS. Quantitative molecular depth profiling of organic delta-layers by C-60 ion sputtering and SIMS. J Phys Chem B. 2008;112(9):2596–2605. doi: 10.1021/jp077325n. [DOI] [PubMed] [Google Scholar]
- 4.Zheng LL, Wucher A, Winograd N. Depth resolution during C-60(+) profiling of multilayer molecular films. Anal Chem. 2008;80(19):7363–7371. doi: 10.1021/ac801056f. [DOI] [PMC free article] [PubMed] [Google Scholar]
- 5.Willingham D, Kucher A, Winograd N. Molecular depth profiling and imaging using cluster ion beams with femtosecond laser postionization. Appl Surf Sci. 2008;255(4):831–833. [Google Scholar]
- 6.Lu CY, Wucher A, Winograd N. Molecular Depth Profiling of Buried Lipid Bilayers Using C-60-Secondary Ion Mass Spectrometry. Anal Chem. 2011;83(1):351–358. doi: 10.1021/ac102525v. [DOI] [PMC free article] [PubMed] [Google Scholar]
- 7.Fletcher JS, Conlan XA, Lockyer NP, Vickerman JC. Molecular depth profiling of organic and biological materials. Appl Surf Sci. 2006;252(19):6513–6516. [Google Scholar]
- 8.Wucher A, Cheng J, Winograd N. Protocols for three-dimensional molecular imaging using mass spectrometry. Anal Chem. 2007;79(15):5529–5539. doi: 10.1021/ac070692a. [DOI] [PubMed] [Google Scholar]
- 9.Fletcher JS, Lockyer NP, Vaidyanathan S, Vickerman JC. TOF-SIMS 3D biomolecular imaging of Xenopus laevis oocytes using buckminsterfullerene (C-60) primary ions. Anal Chem. 2007;79(6):2199–2206. doi: 10.1021/ac061370u. [DOI] [PubMed] [Google Scholar]
- 10.Nygren H, Hagenhoff B, Malmberg P, Nilsson M, Richter K. Bioimaging TOF-SIMS: High resolution 3D Imaging of single cells. Microsc Res Techniq. 2007;70(11):969–974. doi: 10.1002/jemt.20502. [DOI] [PubMed] [Google Scholar]
- 11.Sun S, Szakal C, Roll T, Mazarov P, Wucher A, Winograd N. Use of C-60 cluster projectiles for sputter depth profiling of polycrystalline metals. Surf Interface Anal. 2004;36(10):1367–1372. [Google Scholar]
- 12.Postawa Z, Czerwinski B, Winograd N, Garrison BJ. Microscopic insights into the sputtering of thin organic films on Ag{111} induced by C-60 and Ga bombardment. J Phys Chem B. 2005;109(24):11973–11979. doi: 10.1021/jp050821w. [DOI] [PubMed] [Google Scholar]
- 13.Wagner MS, Gillen G. Impact energy dependence of SF5+ ion beam damage of poly(methyl methacrylate) studied by time-of-flight secondary ion mass spectrometry. Appl Surf Sci. 2004;231–2:169–173. doi: 10.1021/ac035330r. [DOI] [PubMed] [Google Scholar]
- 14.Mahoney CM, Fahey AJ, Gillen G, Xu C, Batteas JD. Temperature-controlled depth profiling of poly(methyl methacrylate) using cluster secondary ion mass spectrometry. 2. Investigation of sputter-induced topography, chemical damage, and depolymerization effects. Anal Chem. 2007;79(3):837–845. [Google Scholar]
- 15.Gillen G, Roberson S. Preliminary evaluation of an SF5+ polyatomic primary ion beam for analysis of organic thin films by secondary ion mass spectrometry. Rapid Commun Mass Sp. 1998;12(19):1303–1312. doi: 10.1002/(SICI)1097-0231(19981015)12:19<1303::AID-RCM330>3.0.CO;2-7. [DOI] [PubMed] [Google Scholar]
- 16.Ninomiya S, Nakata Y, Ichiki K, Seki T, Aoki T, Matsuo J. Measurements of secondary ions emitted from organic compounds bombarded with large gas cluster ions. Nucl Instrum Meth B. 2007;256(1):493–496. [Google Scholar]
- 17.Cheng J, Wucher A, Winograd N. Molecular depth profiling with cluster ion beams. J Phys Chem B. 2006;110(16):8329–8336. doi: 10.1021/jp0573341. [DOI] [PubMed] [Google Scholar]
- 18.Wucher A, Cheng J, Winograd N. Molecular Depth Profiling Using a C-60 Cluster Beam: The Role of Impact Energy. J Phys Chem C. 2008;112(42):16550–16555. doi: 10.1021/jp8049763. [DOI] [PMC free article] [PubMed] [Google Scholar]
- 19.Cheng J, Winograd N. Depth profiling of peptide films with TOF-SIMS and a C-60 probe. Anal Chem. 2005;77(11):3651–3659. doi: 10.1021/ac048131w. [DOI] [PubMed] [Google Scholar]
- 20.Mahoney CM, Fahey AJ, Gillen G. Temperature-controlled depth profiling of poly(methyl methacrylate) using cluster secondary ion mass spectrometry. 1. Investigation of depth profile characteristics. Anal Chem. 2007;79(3):828–836. [Google Scholar]
- 21.Piwowar AM, Fletcher JS, Kordys J, Lockyer NP, Winograd N, Vickerman JC. Effects of Cryogenic Sample Analysis on Molecular Depth Profiles with TOF-Secondary Ion Mass Spectrometry. Anal Chem. 2010;82(19):8291–8299. doi: 10.1021/ac101746h. [DOI] [PubMed] [Google Scholar]
- 22.Sjovall P, Rading D, Ray S, Yang L, Shard AG. Sample Cooling or Rotation Improves C-60 Organic Depth Profiles of Multilayered Reference Samples: Results from a VAMAS Interlaboratory Study. J Phys Chem B. 2010;114(2):769–774. doi: 10.1021/jp9095216. [DOI] [PubMed] [Google Scholar]
- 23.Shard AG, Rafati A, Ogaki R, Lee JLS, Hutton S, Mishra G, Davies MC, Alexander MR. Organic Depth Profiling of a Binary System: the Compositional Effect on Secondary Ion Yield and a Model for Charge Transfer during Secondary Ion Emission. J Phys Chem B. 2009;113(34):11574–11582. doi: 10.1021/jp904911n. [DOI] [PubMed] [Google Scholar]
- 24.Lee JLS, Ninomiya S, Matsuo J, Gilmore IS, Seah MP, Shard AG. Organic Depth Profiling of a Nanostructured Delta Layer Reference Material Using Large Argon Cluster Ions. Anal Chem. 2010;82(1):98–105. doi: 10.1021/ac901045q. [DOI] [PubMed] [Google Scholar]
- 25.Shard AG, Foster R, Gilmore IS, Lee JLS, Ray S, Yang L. VAMAS interlaboratory study on organic depth profiling. Part I: Preliminary report. Surf Interface Anal. 2011;43(1–2):510–513. [Google Scholar]
- 26.Mao D, Wucher A, Winograd N. Molecular Depth Profiling with Cluster Secondary Ion Mass Spectrometry and Wedges. Anal Chem. 2010;82(1):57–60. doi: 10.1021/ac902313q. [DOI] [PMC free article] [PubMed] [Google Scholar]
- 27.Voigtmann R, Moldenhauer W. Quantification of Sputter Depth Profiles by Means of Wedge Crater Sputtering - a New Technique for Depth Scale Calibration. Surf Interface Anal. 1988;13(2–3):167–172. [Google Scholar]
- 28.Gillen G, Fahey A, Wagner M, Mahoney C. 3D molecular imaging SIMS. Appl Surf Sci. 2006;252(19):6537–6541. [Google Scholar]
- 29.Kozole J, Wucher A, Winograd N. Energy deposition during molecular depth profiling experiments with cluster ion beams. Anal Chem. 2008;80(14):5293–5301. doi: 10.1021/ac8002962. [DOI] [PMC free article] [PubMed] [Google Scholar]
- 30.Braun RM, Blenkinsopp P, Mullock SJ, Corlett C, Willey KF, Vickerman JC, Winograd N. Performance characteristics of a chemical imaging time-of-flight mass spectrometer. Rapid Commun Mass Sp. 1998;12(18) doi: 10.1002/(SICI)1097-0231(19980930)12:18<1246::AID-RCM316>3.0.CO;2-C. 1246-+ [DOI] [PubMed] [Google Scholar]
- 31.Gillen G, Batteas J, Michaels CA, Chi P, Small J, Windsor E, Fahey A, Verkouteren J, Kim KJ. Depth profiling using C60+SIMS - Deposition and topography development during bombardment of silicon. Appl Surf Sci. 2006;252(19):6521–6525. [Google Scholar]


