Summary
The structure of the collagen fibers that composes tendon and ligament are disrupted or damaged during injury and healing. Quantification of these changes is traditionally a laborious and subjective task. In this work we apply two automated techniques, Fourier transformation (FFT) and fractal dimension analysis (FA) to quantify the organization of collagen fibrils. Using multi-photon images we show that for healing ligament FA differentiates more clearly between the different time-points during healing. Using scanning electron microcopy images of overstretched tendon we show that combining FFT and FA measures separates the damaged and undamaged groups more clearly than either method individually.
Keywords: Fractal, Fourier transform, FFT, collagen, organization, tendon, ligament
Introduction
Tendons are composed of a hierarchical system of collagen fibrils, fibers, and bundles of fibers. Injured tendons, or tendons subjected to sub-failure damage by overstretching exhibit fiber and fibril damage, ruptured fibrils, and general disorganization. The collagen in excised specimens can be visually examined using variety of imaging techniques including scanning electron microscopy (SEM) and multi-photon imaging to identify these signs of damage. With the aid of a microscope an observer can easily recognize these signs of damage, but is difficult to quantify results for scientific inquiry. Ranking systems are subjective and often not repeatable between researchers. Therefore, it would be advantageous to have an objective and repeatable method to quantify disruption and damage in fiber and fibrils. Subjectivity can be removed from image characterization by removing the element of human judgment, which requires the implementation of an image analysis program capable of recognizing and quantifying patterns.
One method often employed to remove subjectivity when analyzing sample organization is the two-dimensional (2D) fast Fourier transform algorithm (FFT). A single dimension FFT algorithm breaks an electronic signal into its component frequencies and then counts how often those frequencies occur. A 2D FFT performs the same operations on a two-dimensional signal, or image. Using this technique, the 2D FFT can determine the distribution of fiber orientation in an image of collagen fibers. The shape of the spatial distribution of the data, i.e. the plot of frequencies in orthogonal, planar directions, often projects into an elliptical shape. This allows for quantification by an aspect ratio (AR) of the major and minor axes of the ellipse. An image with a preferred direction of fiber orientation has a higher AR. Two-dimensional Fourier analysis has been used to quantify organization of collagen fibrils in the dermis (de Vries et al. 2000), the cochlea (Tsuprun & Santi 1999), and ligament (Vidal & Mello 2010), (Cicchi et al. 2010),(Bashford et al. 2008). The technique has been extensively validated in ligament, with the fiber direction corresponding directly with regions of damage (Sereysky et al. 2010).
A second technique for objectively quantifying organization in an image is fractal analysis (FA). First used by Bernard Mandelbrot in the 1975, the word “fractal” describes a pattern that repeats as it gets smaller. A simple example of this repeating self-similarity is the Koch Curve (also known as the Koch Snowflake), in which four lines of equal length are arranged so that they are the length of only three segments and then four of the line groups are treated the same way (Fig 1b). There are many well-known fractals occurring in multiple dimensions, including the Sierpinski Triangle (Fig 1c) the more complex Julius and Mandelbrot Sets. Fractals are also commonly seen in nature: fjords, cloud shapes, trees (Mandelbrot 1982), and artery branching (Gazit et al. 1997). Each of these fractal patterns has a degree of self-similarity that can be measured using a fractal number. A fractal number describes the amount of space and self-similarity of the structure. For example, a line exists in a single dimension, therefore it has a fractal dimension of 1 (Fig 1a), while a square exists in two dimensions and has a fractal number of 2 (Fig 1b). A simple fractal like the Koch Curve has more “dimension” and self-similarity than a line but not as much as a square, so its fractal dimension is 1.26, between 1 and 2 and the Sierpinski Triangle, which is closer to a square than the Koch Curve has a greater fractal dimension of 1.58. Fractal analysis has been applied in several different biological and medical applications (Lopes & Betrouni 2009). For collagen and related structures it has been used to quantify the periodontal bone-ligament interface (Bosshardt et al. 2008, Madan et al. 2007, Wagle et al. 2005), muscle attachment sites (Zumwalt 2005), and ACL bone-ligament interface (Buckland-Wright et al. 2000).
Figure 1.
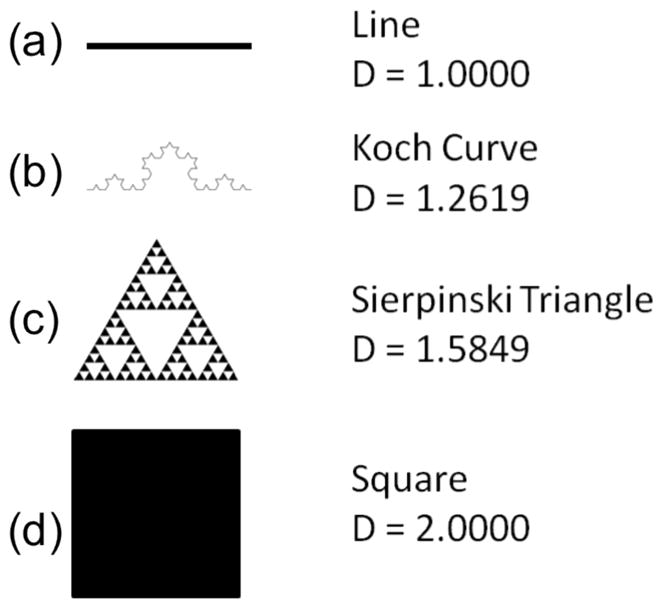
Examples of fractals with dimensions. a) A line is one-dimensional [Fractal Dimension = 1.0000]. b) The Koch Curve is somewhere between one and two dimensions [D = 1.2619]. c) The Sierpinski Triangle is closer to two dimensions that the Koch Curve [Fractal Dimension = 1.5849]. d) A solid rectangle is two-dimensional [Fractal Dimension = 2.0000].
In this study we perform both Fourier (FFT) and fractal (FA) analysis on images of tendon collagen at various levels of organization. One group of specimens is multi-photon images of rat MCL healing. The other group of specimens is SEM images of porcine digital flexor tendon following overstretch injury. We hypothesize that both the aspect ratio and the fractal number will be altered as a result of injury and these differences can be used to differentiate between normal and damaged or healing tissues.
Materials and Methods
Fourier Transform Analysis
The grayscale images were subjected to 2D Fourier transformation analysis using Matlab. For each image the frequencies that occurred between the 9th and 10th percentiles were plotted in 2D space and an ellipse was fit to the resulting data. The ratio of the long axis to the short axis was calculated for each image and compared between groups.
Fractal Analysis
Prior to fractal analysis the images were converted from grayscale to binary images using the automatic threshold value generated in Matlab (Mathworks, Natick, MA). To improve contrast the image was divided into 32 regions and the threshold value for each region was determined separately. The image sections were then re-aggregated to form a black and white version of the original grayscale image. Fractal analysis of each image was performed using a custom Matlab routine that calculated the fractal dimension using the Minkowski-Bouligand dimension, also known as the “box counting” dimension (Moisy 2006). The box counting dimension is determined by covering the image in successively smaller grids of boxes and at each level counting how many boxes are required to cover the image. The number of boxes is then plotted as a function of the box size and the slope of the line is computed. If the slope of the line remains constant as the boxes get smaller that number is the fractal dimension. We confirmed that the slope of the line was approximately constant for each image and then averaged the slope value for the three smallest box sizes to calculate the fractal dimension for each image.
Image Preparation
Multiphoton
Four groups of three rats each underwent transection of the medial collateral ligament (MCL) according to a procedure approved by the University of Wisconsin-Madison Animal Care and Use Committee. Animals were then allowed to heal for 7, 14, 21, or 28 days, according to group. A fifth group was used as an intact control. After collection, the ligament was longitudinally cryosectioned into 5μm thick sections, mounted on microscopy slides and stained with Hematoxin & Eosin (H&E). The healing region of the tendon was then imaged at 40X magnification using multi-photon microscopy and three images from the transected region were used for analysis.
SEM
Five porcine digital flexor tendons were excised and preconditioned (to 2% strain) using a sinusoidal strain wave in a mechanical testing system (MTS Bionix, Minneapolis, MN). Control specimens (n = 3) were removed following preconditioning, whereas damage specimens (n = 2) were stretched to 13% strain at 10mm/sec prior to removal.
Following removal from the testing system, all specimens were stretched flat under mild tension and fixed in a 2% gluteraldehyde solution. Specimens were then dehydrated in ethanol, freeze-fractured in liquid nitrogen, dried in a critical point drying system, and sputter-coated with gold prior to SEM imaging. Images were taken at 2000x magnification, and fifteen representative images from each group (damaged and normal) were chosen.
Statistics
All groups were compared using unpaired, two tailed Student’s T-tests. Significance was set at p = 0.05.
Results
Multiphoton
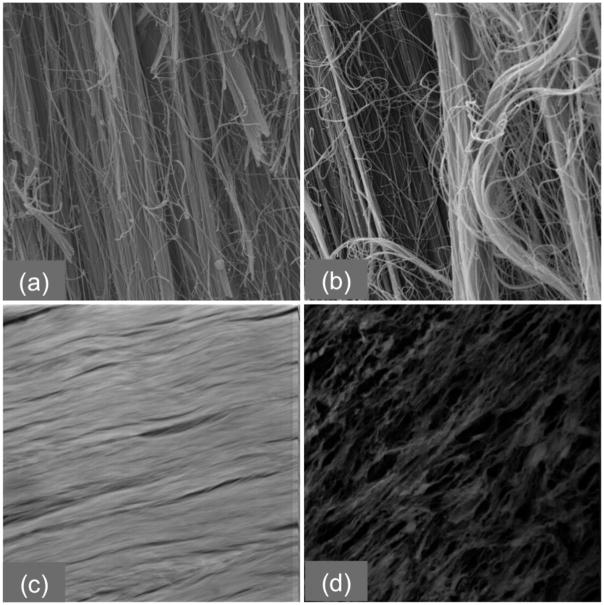
Multiphoton images of healthy ligaments showed well-organized collagen with all of the fibers running in the same direction (Fig 3c). After the ligament had been transected and allowed to heal for one week, images showed disorganized collagen fibrils, with no preferred direction of alignment (Fig 3d). As healing progressed the collagen structure began to preferentially align along the direction of loading, until at four weeks post injury it looked similar to the tissue before injury (not pictured). P values are shown in Table 1.
Figure 3.
SEM images of a) undamaged and b) damaged tendon at 2000× magnification and Multi-photon images of c) healthy and d) 7 days post injury tendon at 40X Magnification.
Table 1.
Statistical significance for FFT aspect ratio analysis of multi-photon images (* p<0.001)
| day | Intact | 7 | 14 | 21 | 28 |
|---|---|---|---|---|---|
| Intact | x | 0.000* | 0.000* | 0.000 * | 0.057 |
| 7 | x | 0.584 | 0.273 | 0.000* | |
| 14 | x | 0.574 | 0.000* | ||
| 21 | x | 0.000* | |||
| 28 | x |
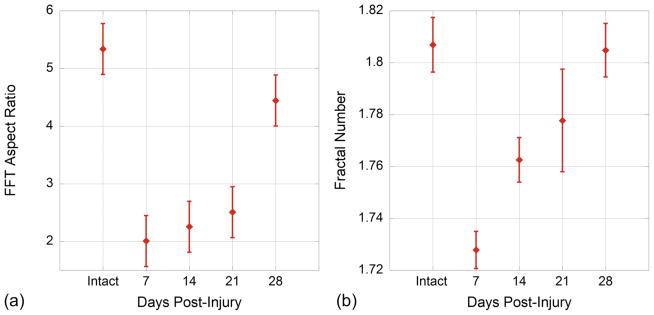
The fractal analysis technique showed significant differences between time points for the healing multiphoton images (Fig 4a). The fractal number for intact ligament was 1.807 (standard deviation ± 0.011). At seven days post-injury the fractal number dropped significantly to 1.728 (p<0.001). As the healing progressed the fractal number increased significantly relative to each of the proceeding time points with the exception of 21 days relative to 14 days. The fractal number over healing time also remained significantly lower than the intact tendon until four weeks post injury (day 28) when it had returned to 1.805. P values are shown in Table 2.
Figure 4.
(a) Average Fractal Dimension decreases after injury, then increases over healing time. Statistical significance is shown in Table 1. (b) Average FFT aspect ratio decreases after injury, then recovers four weeks after injury. Statistical significance is shown in Table 2.
Table 2.
Statistical significance for fractal analysis of multi-photon images (* p<0.001, ^p<0.01)
| day | Intact | 7 | 14 | 21 | 28 |
|---|---|---|---|---|---|
| Intact | x | 0.000 * | 0.000 * | 0.002 ^ | 0.698 |
| 7 | x | 0.000 * | 0.000 * | 0.000 * | |
| 14 | x | 0.066 | 0.000 * | ||
| 21 | x | 0.004 ^ | |||
| 28 | x |
The fractal number pattern reflected the differences described both qualitatively and quantitatively using FFT analysis for this set of multiphoton images. For all intermediate healing time points the FFT aspect ratio was significantly lower than the intact ligament and at day 28 the ligament had recovered to levels similar to the intact ligament (Fig 4b, Table 1). However the intermediate healing time points did not show significant differences relative to one another (Table 1).
In fact, fractal analysis differentiated more clearly among the different time points, showing significant differences relative to preceding time points (Table 2) while the FFT aspect ratio method showed a trend (Fig 4b) but no significance for the days relative to one another (Table 1).
SEM
SEM images of control specimens showed organized, intact fibrils without breaks (Fig 3a). The fibrils were mainly oriented along the long axis of the tendon. Images of overstretched specimens showed broken fibrils, disrupted groups of fibers, and general disorganization (Fig 3b). While many fibrils were still oriented along the long axis of the tendon, the ends of broken fibrils followed no pattern, giving the damaged tendon an overall disorganized appearance.
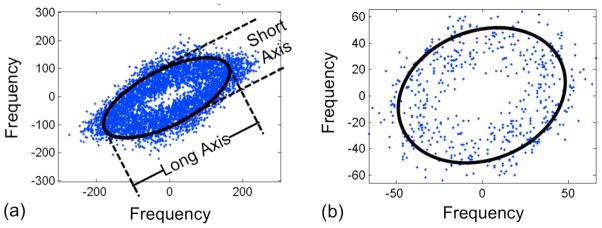
For normal tendon tissue the ellipse generated by the two-dimensional FFT analysis was elongated (Fig 2a), giving an aspect ratio greater than one (average 2.36, standard error 0.21). The ellipse generated by the analysis for the damaged tendon tended to be more circular (Fig 2b), leading to an aspect ratio closer to one (average 1.57, standard error 0.06). The aspect ratio was significantly higher in images from normal specimens (p < 0.001).
Figure 2.
Frequency distribution for intact vs. damaged SEM images. Note the long and short axes of the ellipse used for the quantification ratio.
The fractal dimension algorithm returned significantly higher (p < 0.001) values for images of the damaged specimens, with an average value of 1.76 (standard error 0.012), than for the images of normal specimens, with an average value of 1.71 (standard error 0.007). Fig 3 shows the fractal number plotted as a function of the aspect ratio for each image.
Discussion
We hypothesized that both the aspect ratio and the fractal number would be altered after injury and indeed, our results show that both Fourier analysis and fractal analysis are capable of differentiating between healthy and healing or damaged collagenous tissue.
With the multiphoton images we found that during healing both the FFT aspect ratio and the fractal number initially decreased, then recovered over the healing time course. The reorganization of collagen fibers over the time course of healing is an established fact, however it is usually characterized using a tedious and subjective visual ranking process (Chamberlain et al. 2009). Recently it has been shown that quantification of collagen organization can be performed using Fourier analysis (Sereysky et al. 2010). Our results show that the fractal analysis technique has a greater sensitivity to the progression of healing using the same set of healing tendon images. This suggests that fractal analysis individually or in combination may be a stronger tool for analyzing the organization of collagen fibers.
SEM images of normal and damaged tendon show an increase in fractal number and a decrease in aspect ratio after damage. Using FFT analysis and fractal analysis in combination works well for quantifying overstretch damage in porcine flexor tendon. Our results suggest that FFT analysis by itself would have little success differentiating between the normal and damaged groups, however when the two techniques are combined they create a clear differentiation between the two groups.
We found that SEM images of normal tendon would have a lower fractal number than damaged tendon, since damaged tendon is less regular with bent and broken fibrils. This is the opposite of the effect observed in the multi-photon images, where the fractal number decreases with disorganization. This discrepancy occurs because of differences in what is being imaged. The SEM images of the overstretched tendon are looking at broken fiber ends and irregularities in a field of tendon fibers. Multiphoton images are examining only collagen organization, thus early on, while the collagen is developing (days 7–21), there appears to be empty space between collagen fibrils (Fig 3c and 3d), leading to a lower fractal number in the healing images than in healthy images, where the collagen fills the image in a regular pattern. If fractal analysis were to be applied to the H&E images of the healing ligament we would expect the fractal number to increase because it would be measuring general disorganization, instead of collagen only.
In conclusion, we found that both Fourier analysis and fractal analysis have potential to significantly decrease the burden of manually and subjectively quantifying collagen organization in diseased and healing tissues. This technique combination also has potential to be applied to other imaging modalities, including non-invasive diagnostic ones such as ultrasound or MRI and could be a useful characterization and diagnostic tool, but changes in fractal number must be interpreted individually by modality.
Figure 5.
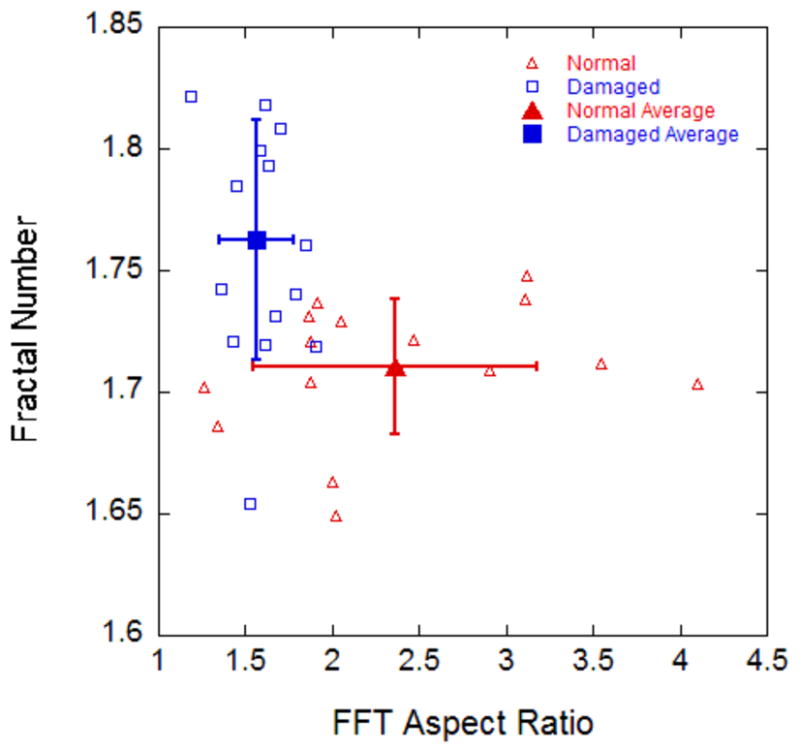
Fractal Number as a function of Aspect Ratio for intact vs. damaged SEM images of pig flexor tendon. Note the distinction between groups that appears when the two are plotted together.
Acknowledgments
The authors would like to acknowledge contributions by the following groups, individuals and organizations: LOCI Laboratory at UW-Madison, BBPIC Laboratory at UW-Madison, Connie Chamberlain PhD, Hirohito Kobayashi PhD, Heather Watters, and Zac Lefler, NIH Grant Nos. AR049266, AR059916, AR056201, NSF Grant No. CMS0553016.
Contributor Information
Kayt E. Frisch, Email: cefrisch@wisc.edu.
Sarah E. Duenwald-Kuehl, Email: duenwald@wisc.edu.
Roderic S. Lakes, Email: lakes@engr.wisc.edu.
Ray Vanderby, Jr., Email: vanderby@ortho.wisc.edu.
References
- Bashford GR, et al. Tendinopathy discrimination by use of spatial frequency parameters in ultrasound B-mode images. IEEE Trans Med Imaging. 2008;27(5):608–615. doi: 10.1109/TMI.2007.912389. [DOI] [PubMed] [Google Scholar]
- Bosshardt DD, et al. Regional structural characteristics of bovine periodontal ligament samples and their suitability for biomechanical tests. J Anat. 2008;212(3):319–329. doi: 10.1111/j.1469-7580.2008.00856.x. [DOI] [PMC free article] [PubMed] [Google Scholar]
- Buckland-Wright JC, Lynch JA, Dave B. Early radiographic features in patients with anterior cruciate ligament rupture. Ann Rheum Dis. 2000;59(8):641–646. doi: 10.1136/ard.59.8.641. [DOI] [PMC free article] [PubMed] [Google Scholar]
- Chamberlain CS, Crowley E, Vanderby R. The spatio-temporal dynamics of ligament healing. Wound Repair and Regeneration. 2009;17(2):206–215. doi: 10.1111/j.1524-475X.2009.00465.x. [DOI] [PMC free article] [PubMed] [Google Scholar]
- Cicchi R, et al. Scoring of collagen organization in healthy and diseased human dermis by multiphoton microscopy. J Biophotonics. 2010;3(1–2):34–43. doi: 10.1002/jbio.200910062. [DOI] [PubMed] [Google Scholar]
- Gazit Y, et al. Fractal characteristics of tumor vascular architecture during tumor growth and regression. Microcirculation (New York, NY: 1994) 1997;4(4):395–402. doi: 10.3109/10739689709146803. [DOI] [PubMed] [Google Scholar]
- Lopes R, Betrouni N. Fractal and multifractal analysis: a review. Medical Image Analysis. 2009;13(4):634–649. doi: 10.1016/j.media.2009.05.003. [DOI] [PubMed] [Google Scholar]
- Madan MS, et al. Effects of human relaxin on orthodontic tooth movement and periodontal ligaments in rats. Am J Orthod Dentofacial Ortho. 2007;131(1):8.e1–10. doi: 10.1016/j.ajodo.2006.06.014. [DOI] [PMC free article] [PubMed] [Google Scholar]
- Mandelbrot BB. The fractal geometry of nature. Freeman; New York: 1983. [Google Scholar]
- Moisy F. MATLAB Central - File detail - boxcount. [Accessed June 15, 2009];Matlab Central. 2006 Available at: http://www.mathworks.com/matlabcentral/fileexchange/13063-boxcount.
- Sereysky JB, et al. Automated image analysis method for quantifying damage accumulation in tendon. J Biomech. 2010;43(13):2641–2644. doi: 10.1016/j.jbiomech.2010.04.043. [DOI] [PMC free article] [PubMed] [Google Scholar]
- Tsuprun V, Santi P. Ultrastructure and immunohistochemical identification of the extracellular matrix of the chinchilla cochlea. Hear Res. 1999;129(1–2):35–49. doi: 10.1016/s0378-5955(98)00219-6. [DOI] [PubMed] [Google Scholar]
- Vidal BDC, Mello MLS. Optical anisotropy of collagen fibers of rat calcaneal tendons: An approach to spatially resolved supramolecular organization. Acta Histochem. 2010;112(1):53–61. doi: 10.1016/j.acthis.2008.07.005. [DOI] [PubMed] [Google Scholar]
- de Vries HJ, et al. Dermal organization in scleroderma: the fast Fourier transform and the laser scatter method objectify fibrosis in nonlesional as well as lesional skin. Lab Invest. 2000;80(8):1281–1289. doi: 10.1038/labinvest.3780136. [DOI] [PubMed] [Google Scholar]
- Wagle N, et al. Fractal analysis of the PDL-bone interface and implications for orthodontic tooth movement. Am J Orthod Dentofacial Ortho. 2005;127(6):655–661. doi: 10.1016/j.ajodo.2004.02.022. quiz 754. [DOI] [PubMed] [Google Scholar]
- Zumwalt A. A new method for quantifying the complexity of muscle attachment sites. Anat Rec Part B, New Anatomist. 2005;286(1):21–28. doi: 10.1002/ar.b.20075. [DOI] [PubMed] [Google Scholar]


