Abstract
The AgBr loaded TiO2 catalyst was prepared by a feasible approach with AgBr and tetraisopropyl orthotitanate and characterized by BET surface area measurement, diffuse reflectance spectra (DRS), scanning electron microscope (SEM), energy dispersive spectra (EDS), X-ray diffraction (XRD), transmission electron microscope (TEM) and atomic force microscope (AFM) analysis. The results of characterization reveal that AgBr loaded TiO2 has a nanostructure. Formation of the nanostructure in AgBr loaded TiO2 results in substantial shifting of the absorption edge of TiO2 to red and enhancement of visible light absorption. Electrochemical impedance spectroscopy measurements reveal that AgBr loaded TiO2 has a higher photoconductivity than prepared TiO2 due to higher separation efficiency of electron-hole pairs. Cyclic voltammetric studies reveal enhanced conductivity in AgBr loaded TiO2, which causes an increase in its photocatalytic activity. AgBr loaded TiO2 exhibited a higher photocatalytic activity than TiO2-P25 and prepared TiO2 in the photodegradation of Reactive Red 120 (RR 120).
1. Background
Azo dyes, which contain one or more azo bonds, are the most widely used synthetic dyes and generally are major pollutants in dye wastewater. Due to their toxicity and slow degradation, these dyes are classified as environmentally hazardous materials. Advanced oxidation technologies (AOTs) are widely used for environmental remediation of toxic organic pollutants from the domestic use and industrial activities [1-4]. AOT is characterized by the generation of highly reactive radicals which can initiate the oxidative degradation of organic pollutants. TiO2 is the most widely studied photocatalyst due to its efficiency, low cost, non-toxicity and high stability [5]. But ultraviolet (UV) light (l < 385 nm) is required to overcome the band gap of TiO2 to produce electron (-)/hole (+) pairs. Since the generation of UV photons is relatively expensive and requires special equipments, it is advantageous to use solar radiation as an abundant and inexpensive light source for photocatalysis. In solar spectrum, UV radiation accounts for about 4%, compared to more than 50% for the visible light. Nowadays research is focused on the development of visible light active catalysts [6-9]. Silver halides are known as visible light sensitive materials and are widely used in photographic films. Absorption of a photon by silver halides liberates an electron and a positive hole. The electrons will combine with mobile interstitial silver ions, leading to separation of a silver atom. If the photographic process is inhibited, the photogenerated electron and hole could be used in the photocatalytic process [10]. AgBr is one of the primary materials used in the photographic industry and its photographic processes are given in equations 1-3 [11].
| (1) |
| (2) |
| (3) |
However, AgBr could maintain its stability and photocatalytic activity if it is well dispersed on support materials. Al-MCM-41 [12] (Aluminium loaded Mobile Crystalline Material) and titanium dioxide (TiO2) [13] were used as the support to deposit AgBr and these catalysts were active and stable while applied in gas phase or aqueous solution under UV or visible irradiation for the degradation of organic compounds.
In this study, we report the synthesis of AgBr loaded TiO2 photocatalyst without using any surfactant or solvent at moderate temperature and its characterization. Reactive Red 120 (RR 120) was chosen as the model pollutant to evaluate the photoactivity and stability of the synthesized catalyst under direct sunlight. RR 120 is one of the most widely used synthetic azo dye in textile industries. Direct sunlight was employed to illustrate the possibility of solar energy utilization.
2. Results and discussion
2.1 Characterization of AgBr loaded TiO2 photocatalyst
2.1.1 XRD analysis
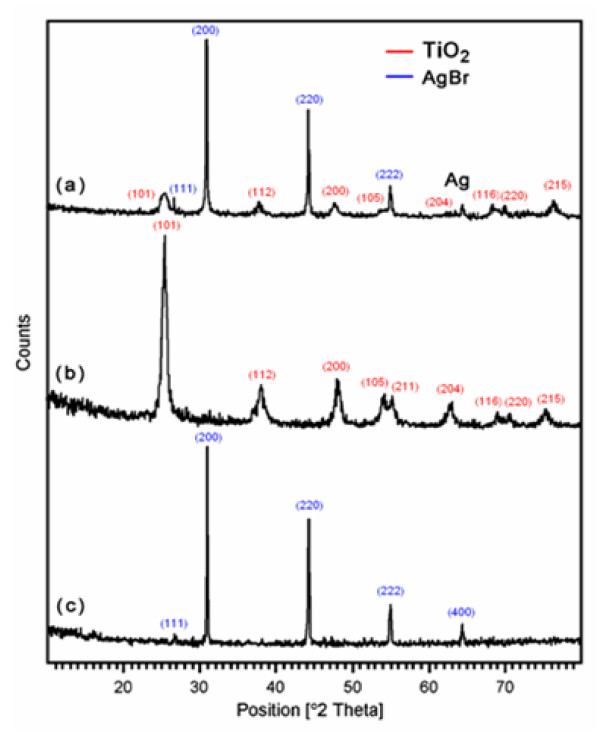
In order to confirm the crystalline structure of prepared AgBr loaded TiO2 catalyst, powder XRD study was carried out. Figure 1 displays the XRD pattern of AgBr loaded TiO2 (a), prepared TiO2 (b) and AgBr (c). In AgBr loaded TiO2 system there are two well defined peaks with 2θ values of 30.9° and 44.3° corresponding to (200) and (220) crystal planes of cubic AgBr (JCPDS No.79-0149), respectively (Figure 1a). Moreover, the diffraction peak at 64.4° assigned to metal Ag is also displayed in AgBr loaded TiO2 system [14,15]. The crystalline size of both prepared TiO2 and AgBr loaded TiO2 were determined using Debye-Scherrer equation (4).
| (4) |
Figure 1.
XRD patterns of:(a) AgBr loaded TiO2; (b) prepared TiO2;(c) AgBr alone.
where D is the crystal size of the catalyst, K is dimensionless constant (0.9). λ is the wavelength of X-ray, β is the full width at half-maximum (FWHM) of the diffraction peak and θ is the diffraction angle. The average crystalline size of AgBr loaded TiO2 is found to be 31.8 nm which is less than the size of prepared TiO2 (34.7 nm).
2.1.2 BET surface area analysis
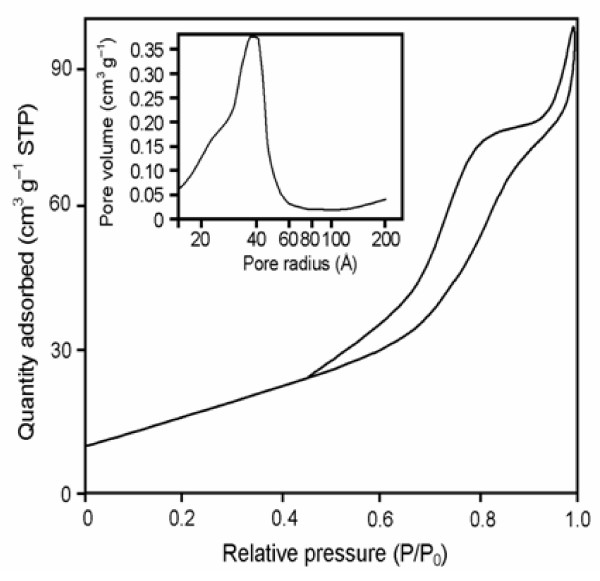
In general the surface area of the catalysts is the most important factor influencing the catalytic activity. The BET surface, pore volume and pore diameter of AgBr loaded TiO2 are given in Table 1. BET surface area of AgBr loaded TiO2 (55.4 m2 g-1) is higher than the commercial TiO2-P25 (50.0 m2g-1). The N2 adsorption/desorption isotherms of the synthesized AgBr loaded TiO2 exhibited typical IUPAC type IV pattern with the presence of hysterisis loop as exemplified in Figure 2 for the sample calcined at 450°C for 2 h. This catalyst provided the highest photocatalytic degradation of Reactive Red 120 dye (based on 200 mg of AgBr loaded TiO2) as discussed later. A clear hysterisis at high relative pressure is observed, which is related to capillary condensation associated with large pore channels. Average pore diameter of AgBr loaded TiO2 is shown in the inset of Figure 2 is 37.2 Å (3.72 nm). The pore size distribution of the AgBr loaded TiO2 samples thus confirm the mesoporosity. As illustrated in the inset in Figure 2 the pore size distribution calculated by BJH (Barret-Joyner-Halenda) method of samples obtained from this deposition precipitation method is quite narrow, verifying good quality of the samples [16].
Table 1.
Surface properties of AgBr loaded TiO2.
| Properties | Values |
|---|---|
| BET surface area | 55.4 (m2 g-1) |
| Total pore volume (single point) | 0.146 (cm3 g-1) |
| BJH desorption average pore diameter (2 V/A) | 3.72 nm |
| Median pore width | 12.54 nm |
Figure 2.
N2 adsorption-desorption isotherms and BJH analysis for AgBr loadedTiO2.
2.1.3 SEM and EDS analysis
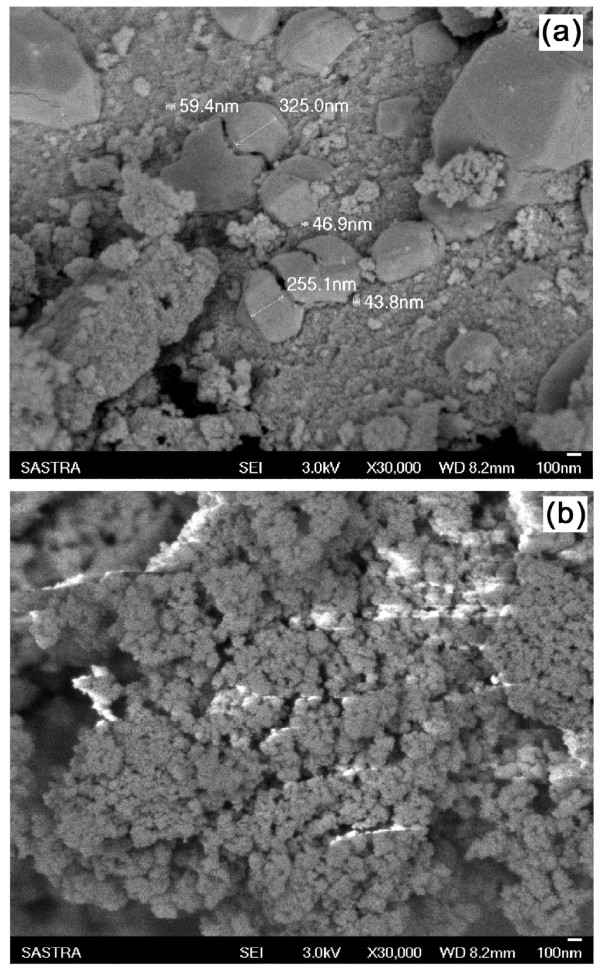
The texture and morphology of prepared TiO2 and AgBr loaded TiO2 samples are very important parameters and might influence the photocatalytic activity. The SEM images of AgBr loaded TiO2 and prepared TiO2 are shown in Figures 3a and 3b. The SEM image of prepared TiO2 (Figure 3b) depicts that the particles are in the form of aggregates and the surface of the prepared TiO2 is irregular and not spherical. In the case of AgBr loaded TiO2 composite material, distribution of smaller size AgBr particles on the TiO2 particles could be seen (Figure 3a). Because of the smaller size, several AgBr particles are capable of interacting with a single TiO2 particle. The grape bunch-type clusters in AgBr loaded TiO2 create nanostructured pores of various dimensions within the surface. Such a direct contact between the two particles may to be crucial for improving the photocatalytic activity of the composite semiconductor materials [17].
Figure 3.
SEM images of: (a) AgBr loaded TiO2; (b) prepared TiO2.
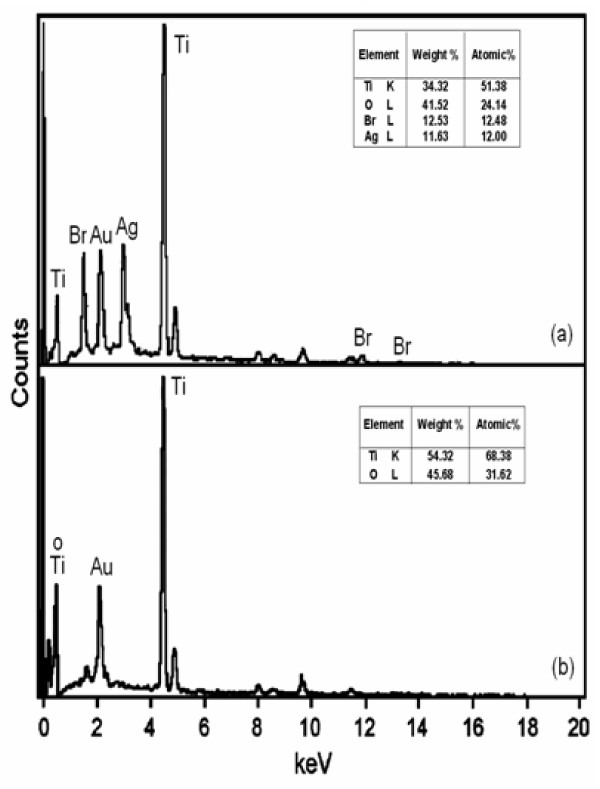
The EDS of AgBr loaded TiO2 and prepared TiO2 are displayed in Figures 4a and 4b. The EDS of AgBr loaded TiO2 (Figure 4a) shows the presence of Ag and Br in the catalyst. The weight percentages of Ag and Br in 42.4 wt% AgBr loaded TiO2 at a particular region are 11.63 and 12.53, respectively (Table, in inset Figure 4a).
Figure 4.
EDS analysis of: (a) AgBr loaded TiO2; (b) prepared TiO2.
2.1.4 TEM analysis of AgBr loaded TiO2
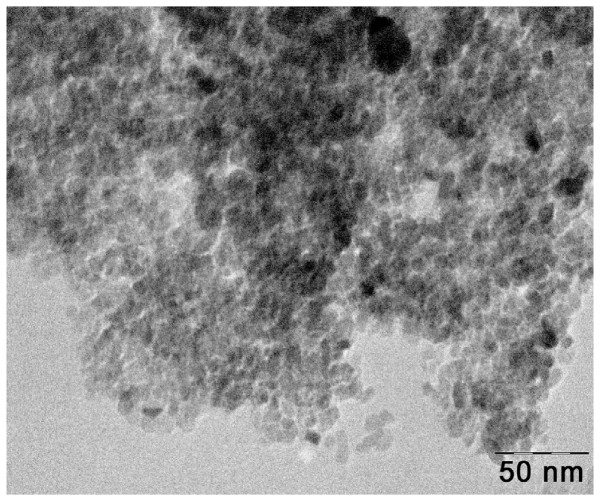
Figure 5 shows the typical bright-field TEM image of the 42.4 wt% AgBr loaded TiO2 powder. TEM image reveals the presence of highly crystalline AgBr loaded TiO2 nanoparticles with a few aggregations and also the presence of AgBr as dark spots on TiO2. The size of the TiO2 nanoparticles is in the range of 10 to 50 nm, which is consistent with the average crystallite size (31.8 nm) estimated from XRD analysis.
Figure 5.
TEM image of AgBr loadedTiO2.
2.1.5 AFM analysis of AgBr loaded TiO2
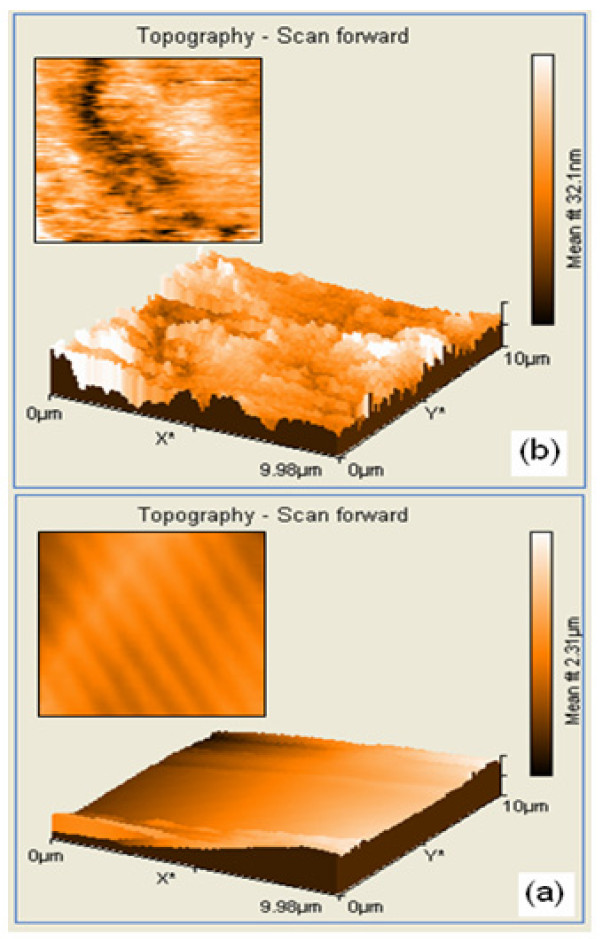
The striking differences in morphology of the prepared TiO2 and AgBr loaded TiO2 become very clear in their AFM images. The existence of nano sized particles in the AgBr loaded TiO2 nanocomposite is more clearly reflected in its 3D AFM image (Figure 6a) which is characterized by a wave type projection in the z direction (uniform array). Interestingly, one can notice the AgBr loaded TiO2 composite in the form of uniform assembled entities and fine crystals. On the other hand, these features are completely absent in the 3D image of the prepared TiO2 (Figure 6b), which in fact shows an random array of cluster like nodules (cloud assembled entities) projection in the z direction. Film imperfections in the form of large aggregation and scratches can also be noticed in the case of prepared TiO2. The fine surface and small crystalline size of AgBr loaded TiO2, may enhance the photocatalytic activity [18]. Thus the AFM results confirm the structural differences in the surface morphology of the prepared TiO2 and AgBr loaded TiO-2.
Figure 6.
AFM image of: (a) AgBr loaded TiO2; (b) prepared TiO2.
2.1.6 DRS analysis
Optical absorption spectra of prepared TiO2 and 42.4 wt% AgBr loaded TiO2 are shown in Figure 7. It can be seen from the Figure 7b that the absorption onset is around 400 nm for prepared TiO2, This absorption extends into the visible region (510 nm) for AgBr loaded TiO2. The band gap energy value of corresponding spectrum was calculated using the equation Ebg = 1239.8/λ nm [19]. The band gap energy value of AgBr loaded TiO2 is 2.47 eV, which is smaller than that of prepared TiO2 (3.1 eV). Thus AgBr loading causes the adsorption edge of TiO2 to shift to the lower energy region. This extended absorption may be due to the band gap of AgBr -TiO2 nanojunction.
Figure 7.
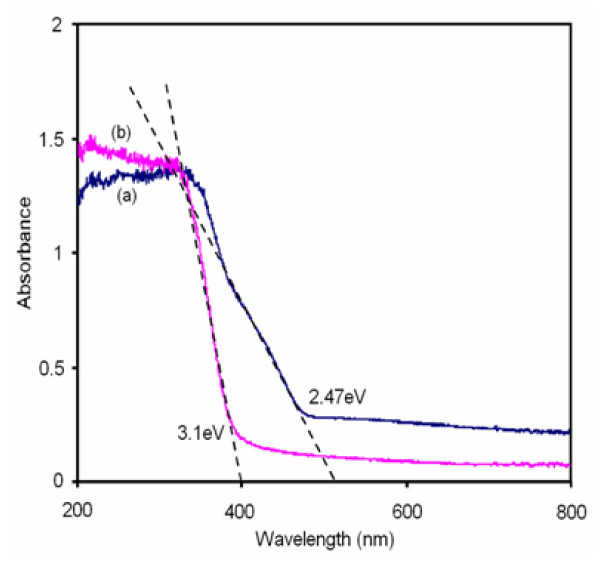
DRS spectra of: (a) AgBr loaded TiO2; (b) prepared TiO2.
2.1.7 Electrochemical impedance spectroscopy
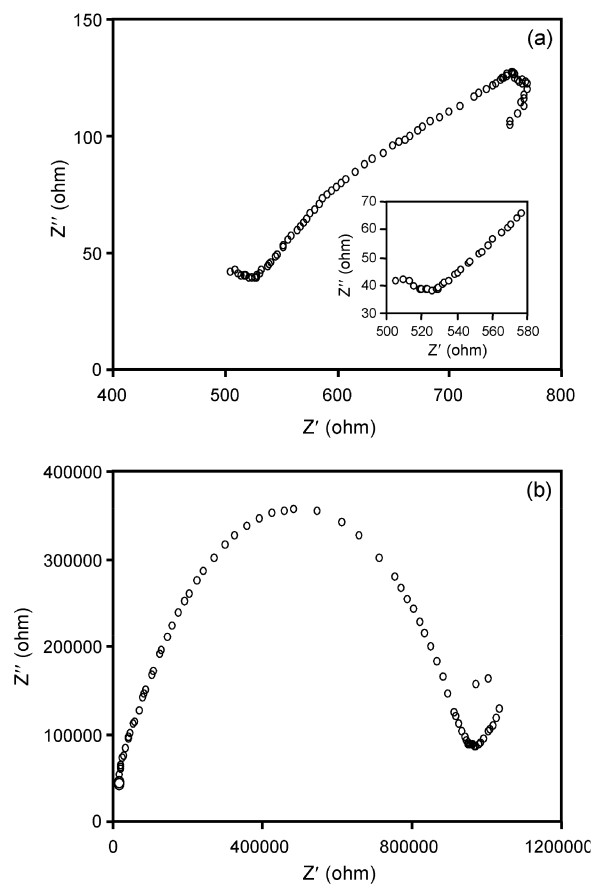
Electrochemical impedance spectroscopy (EIS) is a relatively new and powerful tool to probe the electrical properties of semiconductors. As a widely used electrochemical method, EIS is very effective to investigate the properties of the electron-transfer process across the TiO2-electrolyte interfaces under light [20-22]. It is well established that of EIS Nyquist plots are associated with the charge transfer resistance and the separation efficiency of the photohole-electron pairs [23]. Figure 8b shows the Nyquist plot of the prepared TiO2 catalyst material and the frequency for EIS measurement is scanned from 0 to 1200000 Hz. A large circular radius usually shows a higher charge transfer resistance indicating the lower conductivity of TiO2. Therefore pure TiO2 has a lower separation efficiency of the electron-hole pairs. Nyquist plot of AgBr-TiO2 (Figure 8a) is scanned from 400-800 Hz. Enlarged Nyquist plot of AgBr-TiO2 (inset of Figure 8a) shows a small circular radius indicating lower charge transfer resistance. Hence AgBr-TiO2 has higher separation efficiency. This increases the photoconductivity and photocatalytic activity of AgBr loaded TiO2. Equivalent circuit model used for analyzing the EIS is given in Figure 9. ([ ]-unknown resistance, [Q]- Known resistance).
Figure 8.
EIS Nyquist plots of: (a) AgBr loaded TiO2; (b) prepared TiO2. (Electrolyte = AgBr loaded TiO2 solid ectrolyte, Frequenzy range = 400-800 Hz for AgBr loaded TiO2 and 0- 1200000 Hz for prepared TiO2 )
Figure 9.
Equivalent circuit model of EIS.
2.1.8 Cyclic voltammetry analysis
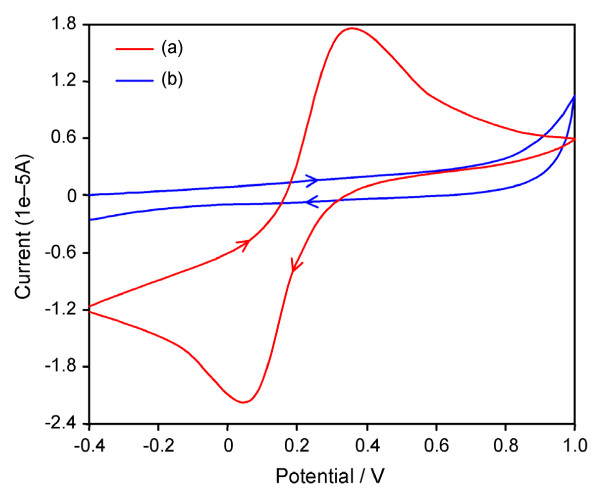
CV of the reversible redox pair [Fe(CN)6]4-/3- is a valuable method to monitor the properties of the modified electrode [24]. Prepared TiO2/GCE composite electrode was initially cycled with 3 mM Fe(CN)6 4-/3- in 0.1 M KCl electrolyte solution giving a working potential window from -0.4 V to +1.0 V versus a Ag/AgCl reference electrode, as shown in curve (b) of Figure 10 This large 1.4 V potential window demonstrated that prepared TiO2 is unable to induce either oxidation or reduction of ferro/ferri cyanide. The AgBr loaded TiO2/GCE nanocomposite electrode was tested for detection of 3 mM Fe(CN)6 4-/3- in 0.1 M KCl. The peak to-peak separation (ΔEp) is 309 mV (Figure 10a) indicating a quasi-reversible redox reaction at the electrode [25]. The AgBr loaded TiO2 electrode shows a reversible peak current ratio, Ip, red/Ip, ox, of ~1.13 which approaches the limit for a reversible one electron transfer. This ideal reversible behavior of a fully conductive electrode indicates the presence of AgBr in TiO2.
Figure 10.
Cyclic voltammograms of (a) AgBr loaded TiO2 (b) prepared TiO2. (scan rate = 100 mV/s, scan rage = -0.4 to 1.0 V vs. Ag/AgCl, Electrolyte concentration = 3 mM potassium ferricyanide in 0.1 M KCl solution.
2.2 Photodegradability of RR 120
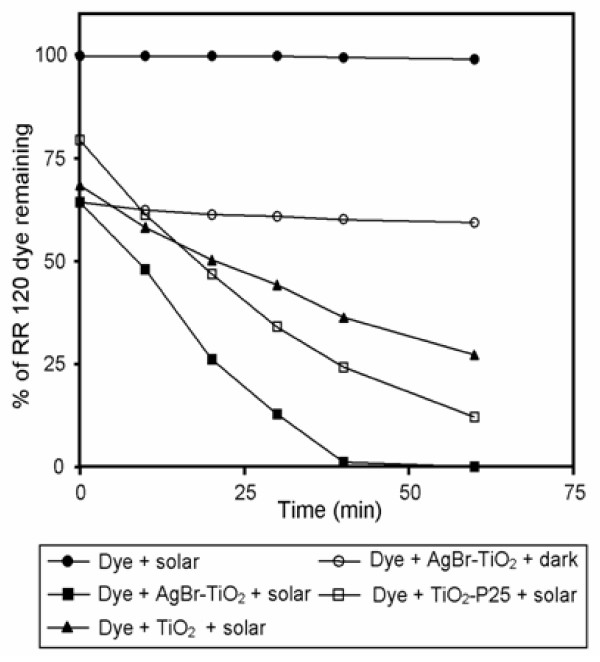
Experiments were carried out to test the photocatalytic activity of by AgBr loaded TiO2 catalyst and to compare its efficiency with prepared TiO2 and TiO2-P25. The results are presented in Figure 11. Prior to irradiation, the dispersions were air purged in the dark for 30 min to achieve the adsorption-desorption equilibrium between AgBr loaded TiO2 and RR 120. In the presence of AgBr loaded TiO2 the adsorption of RR 120 was 35.6% which is slightly higher than the adsorption of dye by prepared TiO2 (31.5%) and TiO2-P25 (20.5%). The dye is not degradable by direct photolysis and by AgBr loaded TiO2 in dark. However, a rapid degradation of RR 120 occurred by irradiation in the presence of AgBr loaded TiO2. In the presence of AgBr loaded TiO2 98.0% degradation of RR 120 was achieved in 40 min whereas 60.1 and 75.0% degradations were observed with prepared TiO2 and TiO2-P25 respectively in 40 min. Higher degradation efficiency of AgBr loaded TiO2 is due to its higher separation efficiency of electron-hole pair as revealed by Nyquist plot of AgBr-TiO2 (Figure 8a).
Figure 11.
Dye degradation with AgBr-TiO2/prepared TiO2/TiO2-P25 in solar light: dye concentration = 2 × 10⁻⁴ M, catalyst suspended = 4 g L-1, pH = 5, airflow rate = 8.1 mL s-1.
Degradation efficiency of AgBr-TiO2 was also tested with a colorless toxic chemical 4-nitrophenol. It was found that 83.0% degradation occurred with UV light where as only 66% degradation was observed with solar light in 60 min. Higher efficiency in solar light for dye degradation reveals the presence of dye sensitization mechanism along with Ag-Br-TiO2 sensitization. Since this dye sensitization is common for AgBr-TiO2, TiO2-P25 and prepared TiO2, higher efficiency of AgBr-TiO2 may be due to the plasmonic photocatalytic mechanism reported for AgCl-TiO2 system [26]. Further work in the study of mechanism is in progress.
2.3 Catalyst recyclability
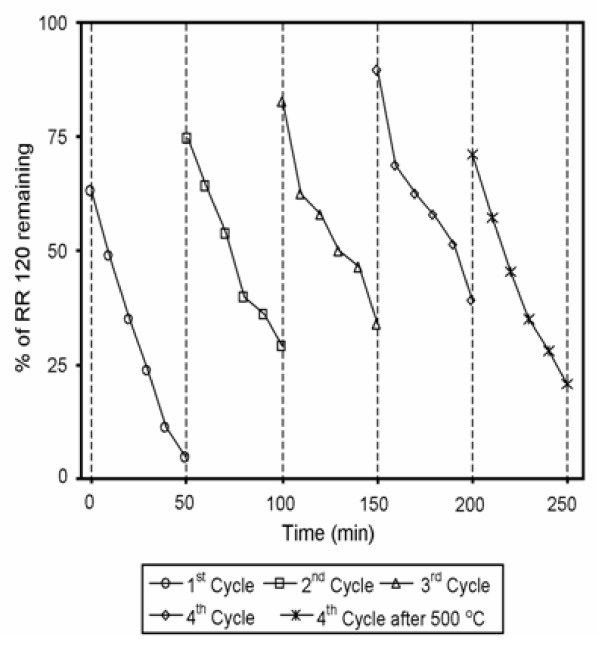
The stability of synthesized catalysts was investigated by the repeated use of the catalyst for four runs under the same conditions. After each run, the catalyst was separated by centrifugation and dried at 110°C for 12 h. The results are displayed in Figure 12. Although the degradation efficiency of RR 120 decreased after each run, the catalyst exhibited significant activity after four successive cycles under the natural sunlight irradiation. To test the effect of annealing the catalyst after the 4th run was calcined at 500°C for 3 h and used for the degradation. In this case, it was found that degradation efficiency increased to 26.4% when compared with 4th cycle. This may be due to the formation of metallic silver during calcination [27]. These results indicated that AgBr loaded TiO2 catalyst remained effective and stable under successive sunlight illumination if calcinated at 500° for 3 h.
Figure 12.
Catalyst reusability: [RR 120] = 2 × 10⁻⁴ M, pH = 5, catalyst suspended = 4 g L-1, airflow rate = 8.1 mL s-1, AgBr content = 42.4 wt%, irradiation time = 50 min.
3. Conclusions
Nanostructured AgBr loaded TiO2 catalyst has been prepared at room temperature by the facile deposition-precipitation method. The UV-Vis spectra indicate that the range of visible-light photoresponse of AgBr loaded TiO2 system is broadened increasing its visible-light-driven photocatalytic activity. The formation of AgBr loaded TiO2 nanocluster has been revealed by the XRD, SEM, TEM and AFM analysis. Electron-hole recombination in TiO2 is reduced by AgBr loading as revealed by Nyquest plots of Eelectrochemical Impedance Spectrascopy. Cyclic voltammetric studies reveal enhanced conductivity in AgBr loaded TiO2. The increase of electro conductivity of AgBr loaded TiO2 enhances its photocatalytic activity. Nano AgBr loaded TiO2 is found to be more efficient than prepared TiO2 and TiO2-P25 for degradation of RR 120. Nano AgBr loaded TiO2 is found to be a stable, recyclable and efficient photocatalyst at pH 5, for the degradation of RR 120 under solar light.
4. Experimental
4.1 Materials
A gift sample of TiO2-P25 (80:20 mixture of anatase and rutile) was obtained from Degussa (Germany). It has the particle size of 30 nm and BET specific surface area of 50 m2 g-1. Titaniumisopropoxide (Himedia), sodium bromide (99.0%) and silver nitrate (99.5%) analytical grade from Merck were used as received. The model pollutant, azo dye (Reactive Red 120), obtained from Balaji Colour Chem, Chennai, was used without further purification. Double distilled water was used for all the experiments.
4.2 Irradiation experiments
All photocatalytic experiments were carried out under similar conditions on sunny days of April-May 2010 between 11 am and 2 pm. An open borosilicate glass tube of 50 mL capacity, 40 cm height and 20 mm diameter was used as the reaction vessel. The suspensions were magnetically stirred in the dark for 30 min to attain adsorption-desorption equilibrium between dye and AgBr loaded TiO2. Irradiation was carried out in the open-air condition. Fifty mL of dye solution with AgBr loaded TiO2 was continuously aerated by a pump to provide oxygen and for the complete mixing of reaction solution. During the illumination time no volatility of the solvent was observed.
After dark adsorption the first sample was taken. At specific time intervals 2-3 mL of the sample was withdrawn and centrifuged to separate the catalyst. One mL of the centrifugate was diluted to 10 mL and its absorbance 285 nm was measured. The absorbance at 285 nm represents the aromatic content of RR 120 and its decrease indicates the degradation of dye.
Solar light intensity was measured for every 30 min and the average light intensity over the duration of each experiment was calculated. The sensor was always set in the position of maximum intensity. The intensity of solar light was measured using LT Lutron LX-10/A Digital Lux meter and the intensity was 1250 × 100 ± 100 lux. The intensity was nearly constant during the experiments.
4.3 Preparation of photocatalyst
AgBr loaded TiO2 was prepared by the deposition-precipitation method [14]. NaBr-ethanol solution was obtained by dissolving 0.1028 g of NaBr in 4 mL of ethanol. AgNO3-ethanol solution was obtained by dissolving 0.1690 g of AgNO3 in 15 mL of ethanol by sonication. The NaBr solution was mixed with the AgNO3 solution under magnetic stirring. AgBr formed was added to a mixture of 10 mL of Ti(OBu)4, 80 mL of 2-propanol and 10 mL water under magnetic stirring. Pale yellow precipitate was obtained and it was filtered, washed thoroughly with distilled water and then with acetone, dried in air oven for 5 h at 90°C and then calcined in muffle furnace at 450°C for 2 h. AgBr loaded TiO2 was formed as a greenish yellow powder. This catalyst contained 42.4 wt% of AgBr. Pure titania (TiO2) was prepared by a similar procedure without the addition of AgBr.
4.4 Analytical methods
The specific surface areas of the samples were determined through nitrogen adsorption at 77 K on the basis of BET equation using a micrometrics ASAP 2020 V3.00 H. Scanning electron microscope (SEM) analysis was performed on gold coated samples using a JEOL-JSM 5610 LV, equipped with OXFORD energy dispersive X-ray microanalysis (EDS). A quantity of AgBr loaded TiO2 suspensions were dropped onto copper grids with holey carbon film. The grids were dried under natural conditions and examined using a TEM Hitachi H-7500. The surface morphology and particle shape were obtained from atomic force microscope (AFM, JSPM-5200TM, JEOL). Powder X-ray diffraction patterns of AgBr loaded TiO2 catalyst was obtained using X'Per PRO diffractometer equipped with a CuKα radiation (wavelength 1.5406 Å) at 2.2 kW Max. Peak positions were compared with the standard files to identify the crystalline phase. Diffuse reflectance spectra were recorded using Shimadzu UV-2450. The solution containing beaker was then kept in sonication bath (33 KHz, 350 W) at room temperature. UV spectral measurements were done using Hitachi-U-2001 spectrometer. The pH of the solution was measured by using ELICO (LI-10T model) digital pH meter.
4.5 Electrochemical impedance spectroscopy analysis
The values of bulk electrical resistance (Rb) of all the synthesized samples were estimated from the complex impedance data collected in the temperature range 298-363 K using a computer-controlled Hewlett-Packard Model HP 4284A Precision LCR Meter over the frequency range 1MHz-20Hz and at an applied potential difference of 500 mV. The complex impedance data were obtained for prepared TiO2 and AgBr loaded TiO2 by employing a specially designed conductivity cell having a fixed sample thickness of 2 mm. As AgBr is an electroactive material AgBr-TiO2 acts as a solid electrolyte. The samples were effectively held between a pair of cylindrical silver non-blocking electrodes in conjunction with a teflon spacer and suitably placed in a temperature controlled oven. The electrical conductivity (σ) values of individual catalyst specimens were evaluated using the eqn. 5.
| (5) |
where A is the area of cross section, t is the thickness of the sample, σ is conductivity and Rb is resistance of the catalyst material.
4.6 Preparation of AgBr loaded TiO2 nanocomposite electrode for cyclic voltammety study
A predetermined amount of AgBr loaded TiO2 was dispersed in a 0.1% nafion in ethanol solution for 1 h in an ultrasonic bath to form a stable suspension. In this case, a uniformly dispersible solution containing up to 1.0 mg/1 mL (AgBr loaded TiO2 solution) is stable. AgBr loaded TiO2 nanocomposite was deposited on the glassy carbon electrode by droplet evaporation for 15 min and then drying in nitrogen atmosphere for 20 minutes. Finally the electrodes were washed with water, before use. For comparison experiments, Prepared TiO2/GCE electrode was prepared, using the the same procedure.
Abbreviations
BET: Brunauer, Emmett and Teller; TEM: Transmission Electron Microscopy; SEM: Scanning Electron Microscopy; EDS: Energy Dispersive X-ray microanalysis; XRD: X-ray Diffraction; EIS: Electrochemical Impedance Spectroscopy: UV: Ultraviolet AFM: Atomic Force Microscope; RR 120:Reactive Red 120.
Competing interests
The authors declare that they have no competing interests.
Authors' contributions
RV carried out all the experiments used in this study, BS is involved in the characterization of catalyst. MS conceived of the study and participated in its design and coordination. All authors read and approved the final manuscript.
Contributor Information
Rengasamy Velmurugan, Email: velmurugan_chem@yahoo.com.
Bojja Sreedhar, Email: sreedharb@iict.res.in.
Meenakshisundaram Swaminathan, Email: chemsam50@gmail.com.
Acknowledgements
The authors thank the Ministry of Environment and Forests (MOEF), New Delhi, for the financial support through research grant No. 315-F-36, F. No. 19/9/2007-RE. We thank Catalysis Laboratory, IIT Madras, Chennai for BET and XRD measurements.
References
- Galindo C, Jacques P, Kalt A. Photodegradation of the aminoazobenzene acid orange 52 by three advanced oxidation processes: UV/H2O2,UV/TiO2 and VIS/TiO2:comparative mechanistic and kinetic. J Photochem Photobiol. 2000;130:35–47. doi: 10.1016/S1010-6030(99)00199-9. [DOI] [Google Scholar]
- Alaton IA, Balcioglu IA, Bahnemann DW. Advanced oxidation of a reactive dye bath effluent: comparison of O3, H2O2/UV-C and TiO2/UV-A processes. Water Res. 2002;36:1143–1154. doi: 10.1016/S0043-1354(01)00335-9. [DOI] [PubMed] [Google Scholar]
- Hu C, Yu JC, Hao Z, Wong PK. Photocatalytic degradation of triazine-containing azo dyes in aqueous TiO2 suspensions. Appl Catal B. 2003;42:47–55. doi: 10.1016/S0926-3373(02)00214-X. [DOI] [Google Scholar]
- Ravichandran L, Selvam K, Krishnakumar B, Swaminathan M. Photovalorisation of pentafluorobenzoic acid with platinum doped TiO2. J Hazard Mater. 2009;167:763–769. doi: 10.1016/j.jhazmat.2009.01.048. [DOI] [PubMed] [Google Scholar]
- Muruganandham M, Swaminathan M. Solar photocatalytic degradation of a reactive azo dye in TiO2-suspension. Sol Energy Mater Sol Cells. 2004;81:439–457. doi: 10.1016/j.solmat.2003.11.022. [DOI] [Google Scholar]
- Asahi R, Ohwaki T, Aoki K, Taga Y. Visible-Light photocatalysis in nitrogen-doped Titanium oxides. Science. 2001;293:269–271. doi: 10.1126/science.1061051. [DOI] [PubMed] [Google Scholar]
- Burda C, Lou Y, Chen X, Samia ACS, Stout J, Gole JL. Enhanced nitrogen doping in TiO2 nanoparticles. Nano Lett. 2003;3:1049–1051. doi: 10.1021/nl034332o. [DOI] [Google Scholar]
- Livraghi S, Paganini MC, Giamello E, Selloni A, Valentin CD, Pacchioni G. Origin of photoactivity of N doped TiO2 under visible light. J Am Chem Soc. 2006;128:15666–15671. doi: 10.1021/ja064164c. [DOI] [PubMed] [Google Scholar]
- Reyes-Garcia EA, Sun YP, Reyes-Gil K, Raftery D. 15N solid state NMR and EPR characterization of N-doped TiO2 photocatalysts. J Phys Chem C. 2007;111:2738–2748. doi: 10.1021/jp0652289. [DOI] [Google Scholar]
- Kakuta N, Goto N, Ohkita H, Mizushima T. Silver bromide as a photocatalyst for hydrogen generation from CH3OH/H2O solution. J Phys Chem B. 1999;103:5917–5919. doi: 10.1021/jp990287q. [DOI] [Google Scholar]
- Hoyen HA, Wen X. Proudfoot CN Ed., handbook of photographic science and engineering, the society for imaging science and technology. Springfield, VA, IS&T; 1997. Image recording in silver halide media. [Google Scholar]
- Rodrigues S, Uma S, Martyanov IN, Klabunde KJ. AgBr/Al-MCM-41 visible-light photocatalyst for gas-phase decomposition of CH3CHO. J Catal. 2005;233:405–410. doi: 10.1016/j.jcat.2005.05.011. [DOI] [Google Scholar]
- Hu C, Lan Y, Qu J, Hu X, Wang A. Ag/AgBr/TiO2 Visible light photocatalyst for destruction of azo dyes and bacteria. J Phys Chem B. 2006;110:4066–4072. doi: 10.1021/jp0564400. [DOI] [PubMed] [Google Scholar]
- Li Y, Zhang H, Guo Z, Han J, Zhao X, Zhao Q, Kim SJ. Highly efficient visible-Light-induced photocatalytic activity of nanostructured AgI/TiO2 photocatalyst. Langmuir. 2008;24:8351–8357. doi: 10.1021/la801046u. [DOI] [PubMed] [Google Scholar]
- Zhang L, Wong KH, Chen Z, Jimmy CY, Zhao J, Hu C, Chan C, Wong PK. AgBr-Ag Bi2WO6 nanojunction systemA novel and efficient photocatalyst with double visible-light active components. Appl Catal A. 2009;363:221–229. doi: 10.1016/j.apcata.2009.05.028. [DOI] [Google Scholar]
- Jitputti J, Pavasupree S, Suzuki Y, Yoshikawa S. Synthesis and photocatalytic activity for water-splitting reaction of nanocrystalline mesoporous titania prepared by hydrothermal method. J Solid State Chem. 2007;180:1743–749. doi: 10.1016/j.jssc.2007.03.018. [DOI] [Google Scholar]
- Vinodgopal K, Bedja I, Kamat PV. Nanostructured semiconductor films for photocatalysis. photoelectrochemical behavior of SnO2/TiO2 composite systems and its role in photocatalytic degradation of a textile azo dye. Chem Mater. 1996;8:2180–2187. doi: 10.1021/cm950425y. [DOI] [Google Scholar]
- Abou-Helal MO, Seeber WT. Preparation of TiO2 thin films by spray pyrolysis to be used as a photocatalyst. Appl Surf Sci. 2002;195:53–62. doi: 10.1016/S0169-4332(02)00533-0. [DOI] [Google Scholar]
- Anandan S, Kathiravan K, Murugesan V, Ikuma Y. Anionic (IO3-) non- metal doped TiO2 nanoparticles for the photocatalytic degradation of hazardous pollutant in water. Catal Commun. 2009;10:1014–019. doi: 10.1016/j.catcom.2008.12.054. [DOI] [Google Scholar]
- Marsh J, Gorse D. A photoelectrochemical and ac impedance study of anodic titanium oxide films. Electrochim Acta. 1997;43:659–670. doi: 10.1016/S0013-4686(97)00210-7. [DOI] [Google Scholar]
- Zaban A, Meier A, Gregg BA. Electric potential distribution and short range screening in nanoporous TiO2 electrodes. J Phys Chem B. 1997;101:7985–7990. doi: 10.1021/jp971857u. [DOI] [Google Scholar]
- Santiago FF, Belmonte GG, Bisquert J, Zaban A, Salvador P. Decoupling of transport, charge storage, and interfacial charge transfer in the nanocrystalline TiO2/electrolyte syst. J Phys Chem B. 2002;10:6334–339. [Google Scholar]
- Zheng J, Yu H, Li X, Zhang S. Enhanced photocatalytic activity of TiO2 nano-structured thin film with a silver hierarchical configuration. Appl Surf Sci. 2008;254:1630–1635. doi: 10.1016/j.apsusc.2007.07.165. [DOI] [Google Scholar]
- Kang J, Li X, Wu G, Wang Z, Lu G, Wang Z, Lu X. A new scheme of hybridization based on the Au nano -DNA modified glassy carbon electrode. Anal Biochem. 2007;364:165–170. doi: 10.1016/j.ab.2007.01.037. [DOI] [PubMed] [Google Scholar]
- Qureshi A Kang WP Davidson JL Gurbuz Y Review on carbon Derived solid-state, micro and nano sensors for electrochemical sensing applications Diamond & Related Materials 2009181401–1420. 10.1016/j.diamond.2009.09.00821807182 [DOI] [Google Scholar]
- Yu J, Dai G, Huang B. Fabrication and characterization of Visible-Light - Driven plasmonic photocatalyst Ag/AgCl/TiO2 nanotube arrays. J Phys Chem C. 2009;113:16394–16401. doi: 10.1021/jp905247j. [DOI] [Google Scholar]
- Zang Y, Farnood R, Currie J. Photocatalytic activities of AgBr/Y zeolite in water under visible light irradiation. Chem Eng Sci. 2009;64:2881–2886. doi: 10.1016/j.ces.2009.03.015. [DOI] [Google Scholar]


