Abstract
There is increasing evidence for the involvement of plasma membrane microdomains in insulin receptor function. Moreover, disruption of these structures, which are typically enriched in sphingomyelin and cholesterol, results in insulin resistance. Treatment strategies for insulin resistance include the use of vanadium compounds which have been shown in animal models to enhance insulin responsiveness. One possible mechanism for insulin-enhancing effects might involve direct effects of vanadium compounds on membrane lipid organization. These changes in lipid organization promote the partitioning of insulin receptors and other receptors into membrane microdomains where receptors are optimally functional. To explore this possibility, we have used several strategies involving vanadium complexes such as [VO2dipic]− (pyridin-2,6-dicarboxylatodioxovanadium(V)), decavanadate (V10O286−, V10), BMOV (bis(maltolato)oxovanadium(IV)) and [VO(saltris)]2 (2-salicylideniminato-2-(hydroxymethyl)-1,3-dihydroxypropane-oxovanadium(V)). Our strategies include an evaluation of interactions between vanadium-containing compounds and model lipid systems, an evaluation of the effects of vanadium compounds on lipid fluidity in erythrocyte membranes, and studies of the effects of vanadium-containing compounds on signaling events initiated by receptors known to use membrane microdomains as signaling platforms.
Introduction
Plasma membrane microdomains, typically small membrane regions characterized by detergent insolubility and enrichment in sphingomyelin and cholesterol [1], are increasingly associated with their ability to concentrate membrane proteins involved in transmembrane signaling. As an example of this, insulin receptors function optimally in membrane microdomains [2]. Exclusion of the insulin receptor from membrane microdomains, as seen under conditions where these is an excess of the ganglioside GM3 [3] or in Neimann-Pick disease where membrane microdomains are altered [4], produces an insulin-resistant state.
This role for membrane microdomains in insulin-mediated signaling suggests a pharmacologic strategy to increase insulin responsiveness. It has been known for many years that some vanadium-containing compounds can enhance insulin responsiveness [5-10]. Selected compounds can normalize both elevated blood glucose and lipid levels and may have long-term benefits to cardiovascular health, which is a frequent complication of diabetes [11] [12]. Vanadium compounds are generally not believed to bind to the insulin receptor [13–15] and thus exert their insulin-enhancing effects downstream of the insulin receptor [10] [16–19]. However, the likely effects on multiple pathways have recently been documented in for example the DNA microarray analysis of global gene expression levels documenting numerous changes in gene expression [16].
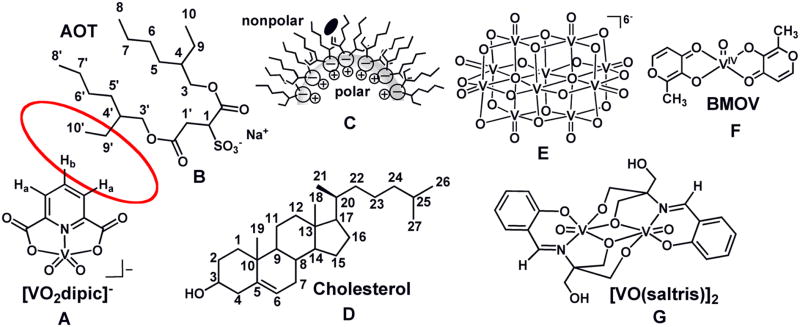
The possibility that vanadium compounds interact directly with membranes or proteins closely associated with membranes seems high, particularly in light of the recent finding that the insulin-enhancing compound [VO2dipic]− (Fig. 1A) [20] [21] penetrates the lipid interface and is located in the hydrophobic portion of the lipid layer of the microemulsion (Fig. 1C) [22] [23]. This result was unexpected considering the charge and polarity of this compound, but does support previous reports that some vanadium compounds, such as naglivan [24], are able to penetrate membrane systems [6] [25]. However, to date these studies have been carried out with different vanadium complexes, and a more exhaustive study on this topic will be forthcoming. Several classes of vanadium-compounds are insulin enhancing compounds and this suggests that the specific ligand is less important than the presence of vanadium within the complex. This observation is in agreement with existing literature showing that the effects of vanadium compounds vary with different oxidation state of the metal [26] [27], and that the various ligands exert a “fine-tuning” effect [8] [28].
Fig. 1.
The structure of [VO2dipic]− (A). The structure of AOT (B). The schematic drawing of the location of [VO2dipic]− in a isooctane microsuspension and the proposed -location in the more rigid cyclohexane system (C). The red circle between [VO2dipic] and AOT indicate the protons seeing each other in the NOESY spectrum (see Fig. 2 below). The structures of cholesterol (D), decavanadate (V10) (E), BMOV (F) and [VO(saltris)]2.
Here we explore the hypothesis that vanadium compounds facilitate insulin-enhancing effects through reorganization of plasma membrane lipids. These studies were motivated by the well-known insulin-enhancing properties of several lipophilic vanadium compounds [5] [6] and the fact that even a charged vanadium compound can penetrate the lipid interfacial layer in a model system [22] [23]. Although vanadium compounds are generally believed to act downstream of the insulin receptor [10] [16–19], some effects of these transition metal compounds may be mediated through their actions on the plasma membrane and the organization of proteins and lipids within the lipid bilayer. Thus, these insulin-enhancing vanadium compounds might evoke some effects through direct interactions with the plasma membrane of cells expressing insulin receptors. These interactions could perturb the membrane lipid organization and facilitate the translocation of insulin receptors or other signaling molecules into membrane microdomains that serve as signaling platforms and, in this fashion, enhance insulin-mediated cellular responses and reduce insulin resistance.
Vanadium-containing compounds affect the packing of lipids in microemulsions
The negatively charged vanadium compound, dipicolinato cis-dioxovanadium(V) ([VO2dipic]− Fig. 1A, was reported to penetrate a model lipid interface. The nature of this interaction was examined in further detail in studies presented here in an AOT (Fig. 1B)/cyclohexane system which also has a negatively charged head group as the AOT/isooctane/H2O microemulsion (Fig. 1C) system previously investigated [22]. The samples used in these studies and those reported previously were prepared by vortexing an aqueous solution containing compound, and an organic phase containing surfactant with or without cholesterol (Fig. 1D) to yield an optically clear solution prior to 1H NMR spectroscopic measurements. Formation of reverse micelles was confirmed by dynamic light scattering (DLS) experiments and the sizes obtained are similar to those reported in the literature [22] [29]. Studies were carried out to demonstrate changes in lipid packing upon addition of vanadium compound and to examine the effect of membrane rigidity on compound penetration.
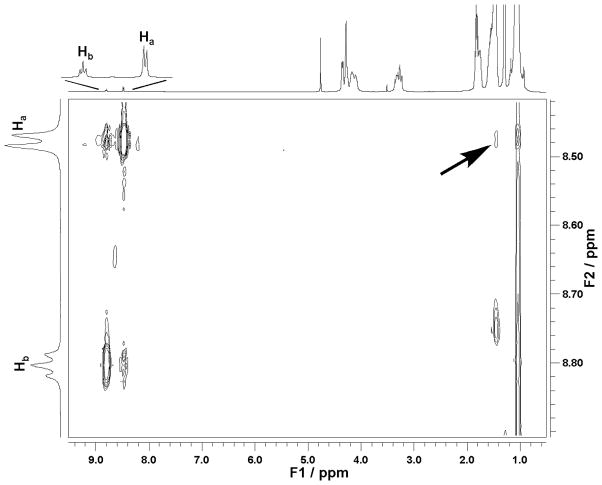
Our previous studies with the [VO2dipic]− complex in an AOT/isooctane/H2O system were done with a model systems with a small H2O to surfactant ratio (wo = [H2O]/[surfactant] ratio). The data shown in Fig. 2 of [VO2dipic]− are in a AOT/isooctane/H2O system with larger reverse micelles (wo = 20) at a size where the water pool is beginning to have bulk-like properties [30] [31]. The 2D NOESY experiment shown in Fig. 2 for this system also showed cross signals between the proton on complex and the CH2 and CH3 protons on AOT. This observation show that these protons are in vicinity of each other and that the [VO2dipic]− complex is likely to have penetrated the interface as was reported previously [22].
Fig. 2.
1H 2D NOESY was recorded of 100 mM [VO2dipic]− complex in a 1M AOT/Isooctane /D2O (pH 4.5) microemulsion of w0 = 20.
The model system AOT/isooctane/H2O is a well known system (Fig. 1C) in which the organic solvent isooctane is known to penetrate the AOT chains in the reverse micelle. A closely related system in which less flexible surface movement takes place is comprised by the organic solvent cyclohexane in place of isooctane. Since membrane flexibility is likely to alter the response to agents, information is desirable in a system with less surface mobility. As a result studies were undertaken in AOT/cyclohexane/H2O. As shown in Fig. 3A the 51V NMR spectra of solutions of [VO2dipic]− complex added to the AOT/cyclohexane/H2O system show some downfield shifting compared to the aqueous stock solution. This slight upfield shift of the complex signal is analogous to the shifting reported previously [22]. As shown in Fig. 3A the signal for this system has a much greater linewidth than stock solution reflecting the lower mobility of the complex in the microemulsion environment.
Fig. 3.
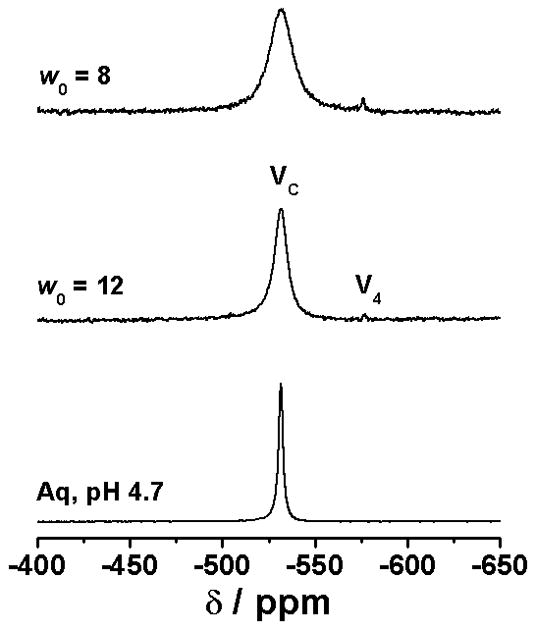
The 51V NMR spectra (panel A) and the 1 H NMR spectra (panel B) of [VO2dipic]− complex in a 1 M AOT/cyclohexane (C6H12) /D2O (pH 4.7).
The 1H NMR spectra of these systems were also recorded, and are shown in Fig. 3B. Interestingly the modest upfield chemical shift of the 51V NMR signal is contrasted to the significant downfield shift in the 1H NMR spectra. In the past an upfield shift in the 1H NMR spectra has been be associated with interface interaction [32] [33]. However, the 1D 1H NMR results in the AOT/cyclohexane/H2O system are similar to that observed previously with the AOT/isooctane/H2O system, which as shown in Fig. 2 show that the [VO2dipic]− complex is in the vicinity of tail CH2 and CH3 groups of the AOT chains. The results shown in Fig. 3 are consistent with the [VO2dipic]− complex able to penetrate the surface and reside at least partly at the inner parts of the lipid interface. These studies are very different than those carried out in reverse micelles with positively charged surface and where the complex is likely to be located near the interface [34].
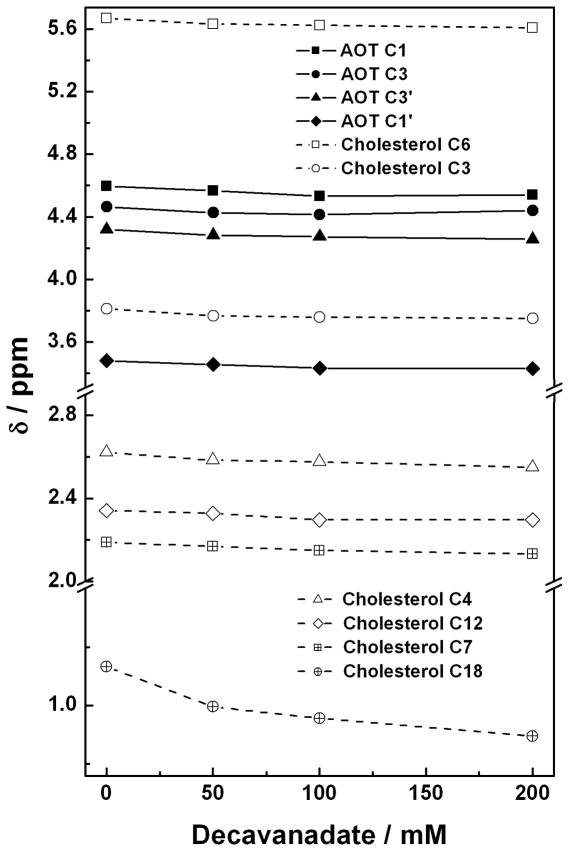
Rafts are known to contain high concentrations of cholesterol (Fig. 1D), and cholesterol is known to reduce membrane fluidity at physiological temperatures. Therefore, studies were carried out with microemulsions in the presence and absence of cholesterol [23]. Reverse micelles at a wo = 8 were made containing a ratio of 1: 4 (30 mM : 120 mM) cholesterol:AOT using isooctane as the organic solvent. Reverse micelles were formed by the addition of aqueous solutions of preformed decavanadate (V10, E in Fig. 1) (50 mM, 100 mM and 200 mM) for comparison with the reverse micelles in the absence of V10. The chemical shifts for some of the 1H in the cholesterol molecule changed as the V10 compound was added to the water pool and selected signals are shown in Fig. 4. The chemical shifts for the H-atoms on C3, C4, C6, C7 and C12 changed slightly, whereas, a large shift was observed for the H-atoms on C18. No or even less change was observed for the rest of the protons on the cholesterol molecule. The variation in chemical shifts reflect changes in environment, which is consistent with changes in lipid packing near these H-atoms upon addition of V10 probe to the reverse micelle. Based on the observations the protons on the C18 are experiencing the largest change suggesting that this CH3 group may be pertruding and causing some of the lipid packing reorganization.
Fig. 4.
The 1H NMR chemical shift of selected cholesterol protons prepared from cholesterol (30 mM) and AOT (120 mM) based w0 = 8 reverse micelle is shown as increasing concentrations of V10 (E in Fig. 1) is added to the water-pool of the reverse micelle. The chemical shifts for protons on carbons shown here are located as indicated in Fig. 1 on the structure.
In comparison we also examined the chemical shifts of the protons on the AOT. Since there are many molecules of AOT for each V10, a small change here would provide a strong indication that changes in the lipid packing are taking place. Some H-atoms have indistinguishable chemical shifts which is consistent with little change in their environment as would be anticipated from protons further away from a cholesterol that was penetrating the lipid interface. As shown in Fig. 4 the protons on C1’ and C3’ show the largest change, and a smaller change is observed for the protons on C1 and C3. These data are consistent with penetration of the cholesterol with a greater presence near the C1’ and C3’ end of the AOT molecule. Such association places the cholesterol further away from the charged SO3−-group. Since V10 is believed to be located in the water pool in these microemulsions, any change in lipid packing by this solute probably indicate a significant change in the interface region of this system. When we recorded the 51V NMR spectra we observed some changes in the chemical shifts consistent with this observation (data not shown). Combined these data support the possibility that cholesterol penetrate the lipid interface such that polar part of the molecule remain near the lipid interface associating more with the part of the AOT molecule that is further away from the charged SO3−-group. Overall these studies suggest that the lipid organization change in the presence of a vanadium compounds. Studies are now underway to probe the phenomena further. Fig. 4
Vanadium containing compounds modulate lipid fluidity as assessed by changes in polarization of a lipid probe
Changes in lipid packing in reverse micelles in the presence of vanadium-containing compounds suggest the possibility that membrane fluidity is influenced by these compounds. Although our previous studies have focused on membrane permeability of vanadium-containing compounds [35–37], we have also observed that selected vanadium-containing compounds can partition within plasma membrane lipids. We have evaluated lipid fluidity using erythrocyte membranes treated with various vanadium-containing compounds. Using the lipid probe diphenylhexatriene (DPH) and fluorescence polarization methods [35], we have demonstrated that, to varying degrees, three compounds NaVO3, VO(acac)2 and BMOV (bis(maltolato)oxovanadium(IV)) (Fig. 1F) decreased membrane fluidity and increased lipid order in erythrocyte membranes.
The results that three different vanadium complexes are able to traverse the membrane are summarized in Table 1. Since the NMR studies with [VO2dipic]− suggest that a complex can penetrate the lipid interface, and the studies with V10 that the vanadium complex can induce lipid reorganization. Recent studies with the oxidized forms of BMOV (Fig. 1F) in this simple model system suggest that these species also interact with the lipid interface [38]. These studies are thus also consistent with the studies listed in Table 1 with BMOV [35]. The possibility that BMOV affects lipid order in microsuspensions are currently under further investigation (manuscript in preparation). Combined these results support the possibility that vanadium-containing compounds with some hydrophobicity have the ability to intercalate within lipid layers and impact lipid organization.
Table 1.
Effects of vanadium compounds on the lipid fluidity of DPH-labeled human erythrocyte membranes [35].
| C (mM) | Microviscosity | ||
|---|---|---|---|
| NaVO3 | VO(acac)2 | BMOV | |
| 1.0 | 1.90 ± 0.02 | 2.13 ± 0.02 | 2.13 ± 0.02 |
| 0.1 | 1.88 ± 0.02 | 2.00 ± 0.02 | 2.04 ± 0.02 |
| 0.0 | 1.83 ± 0.02 | ||
Data represents the means ± S.D. (m=3); P ,0.05 vs. control
Changes in lipid packing may influence the distribution of receptors in membrane microdomains and receptor function
One consequence of a change in lipid organization is to shift the distribution of membrane proteins and the concentration and composition of membrane proteins in membrane microdomains. One of the most common methods to evaluate the preferential localization of membrane proteins into microdomains is simply to disrupt the integrity of these microdomains using methyl-β-cyclodextran to extract cholesterol from membranes [1]. This approach demonstrates that cholesterol is critical to microdomain formation and stability and to the localization of selected membrane proteins in membrane fractions with low buoyancy. We have shown that a vanadium-containing compound [VO(saltris)]2 (Fig. 1G) can influence the distribution of the insulin receptor within membrane microdomains [23].
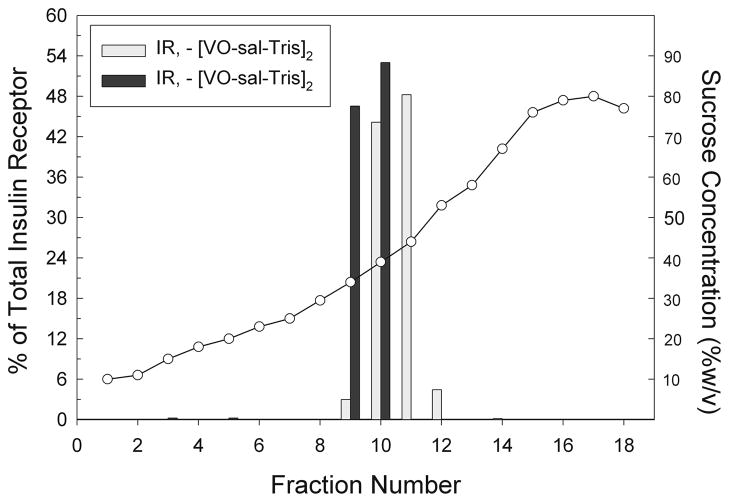
We evaluated the buoyancy of membrane fractions using discontinuous sucrose gradient ultracentrifugation methods and the results are shown in Fig. 5. Briefly, 5 x 10⁶ RBL-2H3 cells were obtained from cell culture and suspended in BSS. Cells were then treated with [VO(saltris)]2 for one hour prior to cell lysis. The cell lysate was mixed with an equal volume of 80% sucrose to obtain a sample consisting of cell membranes and their components in 40% sucrose. A discontinuous sucrose gradient from 10–80% sucrose was constructed with the cell fraction comprising the 40% sucrose fraction. Samples were then subjected to isopycnic ultracentrifugation using an overnight spin at approximately 180,000g. After centrifugation, 640 μL fractions were carefully colleted from the top down of the gradient downward. Aliquots from each fraction were probed for proteins of interest including the insulin receptor. The insulin receptor was identified using on Western blots using an anti-insulin receptor antibody (Sigma-Aldrich, St. Louis, MO). As shown in Fig. 5, treatment of intact RBL-2H3 cells with [VO(saltris)]2 resulted in movement of insulin receptor to membrane fractions with higher buoyancy.
Fig. 5.
Translocation of IR from higher density sucrose fractions to lower density sucrose fractions upon treatment with approximately 30 μM [VO(saltris]2. The relative amount of IR in each fraction was measured from western blots using a Biorad calibrated densitometer. Sucrose concentrations (") for each fraction were measured using a Bausch and Lomb refractometer.[Fig. is adapted with permission from Ref. [23].
The observed induced shift in membrane fractions containing insulin receptor was modest. However, both the Type I Fcε receptor [39–41] and the human luteinizing hormone receptors [40] have previously been shown to exhibit small shifts into higher buoyancy membrane fractions under similar experimental conditions. Significantly larger shifts in sucrose fractions were observed for ligand-treated rat LH receptors [42].
BMOV treatment can enhance receptor-mediated responses
The appearance of insulin receptors within membrane microdomains in the absence of a hormone signal raises a question as to whether receptor function is affected by the presence of vanadium-containing compounds. To examine this, we have used cells expressing a well-characterized receptor, the Type I Fcε receptor (FcεRI), to determine whether presence of a vanadium compound currently being evaluated in clinical trials phase II, BMOV [10] [43] [44] can enhance calcium flux in response to receptor crosslinking. FcεRI are expressed in RBL-2H3 cells, a cell line derived from rat basophilic leukemia (RBL) cells, and were used in the studies presented here for several reasons. We have had considerable experience in evaluating the localization of RBL-2H3 cell plasma membrane receptors in membrane rafts during cell signaling [45]. Furthermore, we have used biophysical methods for evaluating molecular dynamics of membrane lipids and proteins and interactions between membrane molecules in this cell system [46]. Importantly, RBL-2H3 cells have insulin receptors in addition to FcεRI and are capable of downstream signaling in response to binding of these receptors' respective ligands. Moreover, vanadate has been reported to activate signaling in RBL-2H3 cells including release of Ca2+ from intracellular stores and plasma membrane flux although the mechanism is unclear [47]. Mast cells, which like basophils are derived from a CD34+ precursor in the bone marrow and have basophil-like activity in tissues, may also be involved in the development of heart disease [48] although their role remains controversial. Thus, signaling mechanisms utilized by RBL-2H3 cells are, in and of themselves, of interest.
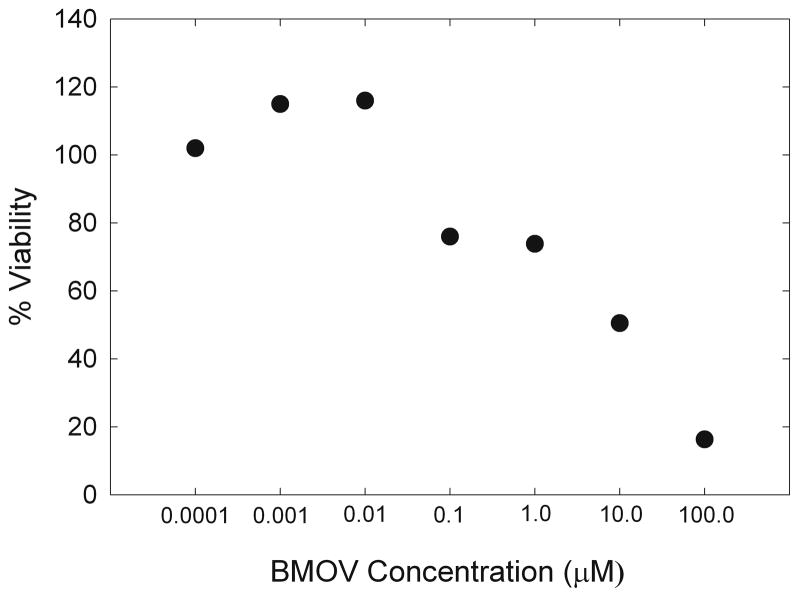
To establish conditions for cell treatment, RBL-2H3 cells were treated with BMOV at concentrations that did not affect cell viability on the timescale of our experiments. RBL-2H3 cells were maintained in cell culture medium including Earle’s Minimum Essential Medium (MEM), fetal bovine serum, and 5mM L-glutamine, penicillin, ampicillin and amphotericin B. Cells were harvested for experiments using 5 mM EDTA and washed in Hank’s balanced salt solution (BSS), were plated in flat-bottom 96-well plates (Corning) at approx. 50,000 cells/ well and grown overnight. Media was removed and replaced with media containing indicated BMOV concentrations and cells were incubated at 37 °C overnight. MTT assay solution (Sigma) was then added to the culture medium at a volume equal to 10% of the culture volume (20 μL MTT solution added to 200 μL culture medium). Cultures were then incubated for 4 hours at 37 °C. After 4 hrs, culture medium was removed and MTT solvent was added. Cultures were left in MTT solvent for 1hr. on an oscillating shaker to assist in crystal dissolution and were then read at 570 nM using a spectrophotometric plate reader. Media alone was also treated in the same manner to allow for background subtraction due to any colorimetric changes due to the phenol red-containing media. Treatment concentrations ranged from 0.1nM-100 μM BMOV. Data was analyzed by normalizing the data points (typically 3-5 time repeats at each concentration; symbol is covering error bars) to the media alone sample, taken as 100% viability. 10 Concentrations of 10 nM BMOV had no effect on cell viability.
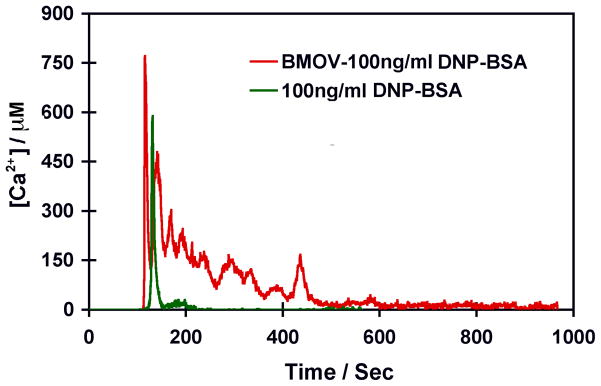
Pretreatment of RBL-2H3 cells with 10 nM BMOV affects calcium flux in response to crosslinking of FcεRI. Dinitrophenylated bovine serum albumin (DNP-BSA) crosslinks FcεRI primed with DNP-specific IgE and this crosslinking leads to both calcium flux and release of histamine-containing vesicles (data not shown). To evaluate calcium flux in response to FcεR1 receptor crosslinking, 2H3-RBL cells were labeled with Fura-2, a ratiometric dye sensitive to free calcium using a 50ng of Fura-2 stock solution in 50nL DMSO. Cells were washed twice prior to the addition of Fura-2 at a final concentration of 5nM or 10 nM. Prior to Fura-2 imaging, cells were incubated for 15–60 min at 37 °C or room temperature. In some experiments, cells were also preincubated with 10 nM BMOV overnight before crosslinking of FcεRI with DNP-BSA, a treatment strategy which increased the magnitude and duration of calcium flux in response to DNP-BSA. In Fig. 7 we compare the Ca2+ flux from untreated RBL-2H3 cells with Ca2+ flux from cells exposed to 10 nM BMOV following crosslinking of FcεRI with DNP-BSA. The larger Ca2+ flux from the BMOV treated cells indicate that Ca2+ homeostasis is affected by the presence of the vanadium compound.
Fig. 7.
Ca2+ flux from untreated RBL-2H3 cells and cells exposed to 10 nM BMOV following crosslinking of FcεRI with DNP-BSA.
We are currently using two additional approaches to more fully understand the role of membrane microdomains in insulin receptor function. In one series of ongoing studies, we are evaluating the effects BMOV on GLUT4 insertion in the plasma membrane. Interestingly, both insulin-mediated signaling and the appearance of GLUT4 in the plasma membrane involve microdomains. To evaluate effects of BMOV on GLUT4 into the membranes of 2H3-RBL cells, we have stably transfected RBL-2H3 cells with a GFP-GLUT4 plasmid that was the generous gift of Jeffrey Pessin (SUNY at Stonybrook) and imaged this molecule either without or after treatment with 100 nM insulin for 30-60min. Following exposure to insulin, GFP-GLUT4 appears in the plasma membrane as has been described by Pessin and coworkers [49]. We are now evaluating whether overnight pretreatment with BMOV at concentrations that enhance calcium flux is also sufficient to increase insulin responsiveness of these cells.
A second approach to studies of insulin receptor-containing membrane microdomains is to directly image individual insulin receptors within these small membrane compartments. We have begun single particle tracking studies of the insulin receptor using a new strategy introduced by Dr. Keith Lidke at the University of New Mexico [50]. Our previous SPT studies have depended on epitope tagging of a membrane protein, usually using the FLAG epitope and the complementary anti-FLAG antibody from Sigma. However, it is also possible to identify endogenous insulin receptors with an insulin receptor-specific antibody from Santa Cruz. In its biotinylated form, this antibody can be conjugated to 605nm quantum dots which are visualized on cell surfaces. The drawback to this approach is that quantum dots “blink”, they spontaneously turn on an off several times on the time scale of our experiments. Owing to their dark “off” periods it has been previous impossible to obtain useful trajectories. Dr. Lidke has developed particle tracking software that projects a particle track for a quantum dot that has turned off and reacquires its track when the quantum dot turns on. We are now acquiring insulin receptor tracks on viable cells using this strategy which appear to have domain sizes of approximately 150 nm, comparable to those seen for luteinizing hormone receptors within the bulk membrane [40]. These experiments should visually demonstrate whether the insulin receptor, after treatment with lipophilic insulin-enhancing compounds, becomes trapped in small compartments.
Conclusions
Together these results provide preliminary evidence that ligand-mediated signaling can be enhanced by BMOV and other vanadium compound treatment of RBL-2H3 cells. Such a result may occur as the result of receptor translocation into plasma membrane microdomains where local concentrations of receptors are high and downstream signaling molecules are readily available. Evidence for the possibility that a vanadium-containing probe would facilitate reorganization of the membrane organization, specifically involving cholesterol arrangement in a simple microemulsion model system is presented. Experiments show that membrane flexibility is an important factor but that vanadium compounds are able to penetrate lipid interfaces with variable flexibility. Effects of different vanadium-containing probes were examined in cells and a very simple model system, cholesterol-doped AOT microemulsions. The results with the anionic and neutral vanadium compounds are presented here, and show that the vanadium–containing probe impact the packing of the reverse-micelles containing cholesterol. These data are consistent with the model developed and the experiments reported in cells. Although the insulin-enhancing properties of vanadium compounds generally are believed to occur further downstream, the studies shown here demonstrate that vanadium compounds impact the signal transduction through the mechanisms such as Ca2+ flux.
Fig. 6.
Cell viability as measured by MTT assay following treatment with BMOV at increasing concentrations (each of concentration point was repeated 3–5 times but the error bars are covered by the symbols).
Fig. 8.
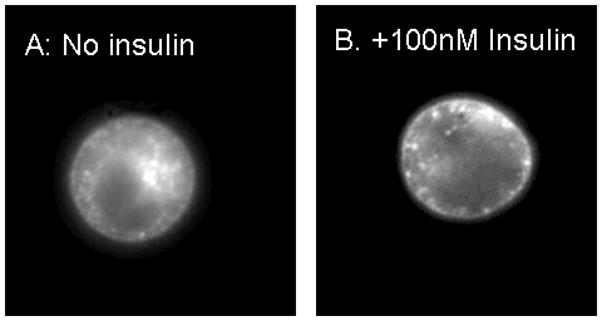
Figures showing insertion of GLUT4 (A: no insulin) in the plasma membrane. Membrane localization of GLUT4 in the plasma membrane following incubation of cells with 100 nM insulin (B).
Acknowledgments
Financial support for this work by the American Heart Association (0650081Z to DAR/DCC), NSF (CHE 0244181 to DAR/DCC/NEL) and NIH (RR023156 to BGB) is gratefully acknowledged. We thank Dr. Christopher D. Rithner for technical assistance.
References
- 1.Schwille P, Korlach J, Webb W. Cytometry. 1999;36:176–182. doi: 10.1002/(sici)1097-0320(19990701)36:3<176::aid-cyto5>3.0.co;2-f. [DOI] [PubMed] [Google Scholar]
- 2.Saltiel A, Pessin J. Traffic. 2003;4:711–716. doi: 10.1034/j.1600-0854.2003.00119.x. [DOI] [PubMed] [Google Scholar]
- 3.Inokuchi J. Yakugaku Zasshi. 2007;127:579–586. doi: 10.1248/yakushi.127.579. [DOI] [PubMed] [Google Scholar]
- 4.Vainio S, Bykov I, Hermansson M, Jokitalo E, Somerharju P, Ikonen E. Biochem J. 2005;391:465–472. doi: 10.1042/BJ20050460. [DOI] [PMC free article] [PubMed] [Google Scholar]
- 5.Shechter Y, Karlish SJD. Nature. 1980;284:556–558. doi: 10.1038/284556a0. [DOI] [PubMed] [Google Scholar]
- 6.Shechter Y, Meyerovitch J, Farfel Z, Sack J, Bruck R, Bar-Meir S, Amir S, Degani H, Karlish SJD. In: Insulin mimetic effects of vanadium. Chasteen ND, editor. Kluwer Academic Publishers; Boston: 1990. pp. 129–142. [Google Scholar]
- 7.Michibata H, Sakurai H. In: Vanadium in ascidians. Chasteen ND, editor. Kluwer Academic Publishers; Boston: 1990. pp. 153–172. [Google Scholar]
- 8.Sakurai H, Tamura A, Fugono J, Yasui H, Kiss T. Coord Chem Rev. 2003;245:31–37. [Google Scholar]
- 9.Crans DC, Smee JJ, Gaidamauskas E, Yang L. Chem Rev. 2004;104:849–902. doi: 10.1021/cr020607t. [DOI] [PubMed] [Google Scholar]
- 10.Thompson KH, Orvig C. Dalton Trans. 2006:761–764. doi: 10.1039/b513476e. [DOI] [PubMed] [Google Scholar]
- 11.Haffner SM. Diabetes Care. 2003;26:S83–S86. doi: 10.2337/diacare.26.2007.s83. [DOI] [PubMed] [Google Scholar]
- 12.Thom T, Haase N, Rosamond W, Howard VJ, Rumsfeld J, Manolio T, Zheng Z-J, Flegal K, O'Donnell C, Kittner S, Lloyd-Jones D, Goff DCJ, Hong Y, Adams R, Friday G, Furie K, Gorelick P, Kissela B, Marler J, Meigs J, Roger V, Sidney S, Sorlie P, Steinberger J, Wasserthiel-Smoller S, Wilson M, Wolf P. Circulation. 2006;113:e85–e151. doi: 10.1161/CIRCULATIONAHA.105.171600. [DOI] [PubMed] [Google Scholar]
- 13.Fantus G, Tsiani E. Mol Cell Biochem. 1998;182:109–119. [PubMed] [Google Scholar]
- 14.Drake PG, Posner BI. Mol Cell Biochem. 1998;182:79–89. [PubMed] [Google Scholar]
- 15.Srivastava AK, Mehdi MZ. Diabetic Med. 2005;22:2. doi: 10.1111/j.1464-5491.2004.01381.x. [DOI] [PubMed] [Google Scholar]
- 16.Willsky GR, Chi L-H, Liang Y, Gaile DP, Hu Z, Crans DC. Physiol Genomics. 2006;26:192–201. doi: 10.1152/physiolgenomics.00196.2005. [DOI] [PubMed] [Google Scholar]
- 17.Basuki W, Hiromura M, Adachi Y, Tayama K, Hattori M, Sakurai H. Biochem Bioph Res Co. 2006;349:1163–1170. doi: 10.1016/j.bbrc.2006.08.162. [DOI] [PubMed] [Google Scholar]
- 18.Shechter Y, Goldwaser I, Mironchik M, Fridkin M, Gefel D. Coord Chem Rev. 2003;237:3–11. [Google Scholar]
- 19.Liboiron BD, Thompson KH, Hanson GR, Lam E, Aebischer N, Orvig C. J Am Chem Soc. 2005;127:5104–5115. doi: 10.1021/ja043944n. [DOI] [PubMed] [Google Scholar]
- 20.Wieghardt K. Inorg Chem. 1978;17:57–64. [Google Scholar]
- 21.Crans DC, Yang L, Jakusch T, Kiss T. Inorg Chem. 2000;39:4409–4416. [Google Scholar]
- 22.Crans DC, Rithner CD, Baruah B, Gourley BL, Levinger NE. J Am Chem Soc. 2006;128:4437–4445. doi: 10.1021/ja0583721. [DOI] [PubMed] [Google Scholar]
- 23.Roess DA, Smith SML, Holder AA, Baruah B, Trujillo AM, Gilsdorf D, Stahla ML, Crans DC. ACS Symposium Series. 2007;974:121–134. [Google Scholar]
- 24.Cam MC, Cros GH, Serrano JJ, Lazaro R, McNeill JH. Diab Res Clin Pract. 1993;20:111–121. doi: 10.1016/0168-8227(93)90004-o. [DOI] [PubMed] [Google Scholar]
- 25.Goldwaser I, Li JP, Gershonov E, Armoni M, Karnieli E, Fridkin M, Shechter Y. J Biol Chem. 1999;274:26617–26624. doi: 10.1074/jbc.274.37.26617. [DOI] [PubMed] [Google Scholar]
- 26.Buglyo P, Crans DC, Nagy EM, Lindo RL, Yang L, Smee JJ, Jin W, Chi L-H, Godzala ME, Willsky GR. Inorg Chem. 2005;44:5416–5427. doi: 10.1021/ic048331q. [DOI] [PubMed] [Google Scholar]
- 27.Monga V, Thompson KH, Yuen VG, Sharma V, Patrick BO, McNeill JH, Orvig C. Inorg Chem. 2005;44:2678–2688. doi: 10.1021/ic0486926. [DOI] [PubMed] [Google Scholar]
- 28.Sakurai H, Kawabe K, Yasui H, Kojima Y, Yoshikawa Y. J Inorg Biochem. 2001;86:94–94. [Google Scholar]
- 29.Maitra A. J Phys Chem. 1984;88:5122–5125. [Google Scholar]
- 30.Maitra A, Dinesh Patanjali P, Varshney M. Colloids Surf. 1986;20:211–219. [Google Scholar]
- 31.Maitra A, Patanjali PK. Colloids Surf. 1987;27:271–276. [Google Scholar]
- 32.Vermathen M, Louie EA, Chodosh AB, Ried S, Simonis U. Langmuir. 2000;16:210–221. [Google Scholar]
- 33.Vermathen M, Stiles P, Bachofer SJ, Simonis U. Langmuir. 2002;18:1030–1042. [Google Scholar]
- 34.Stover J, Rithner CD, Inafuku RA, Crans DC, Levinger NE. Langmuir. 2005;21:6250–6258. doi: 10.1021/la0508137. [DOI] [PubMed] [Google Scholar]
- 35.Yang X, Wang K, Lu J, Crans DC. Coord Chem Rev. 2003;237:103–111. [Google Scholar]
- 36.Yang X-G, Yang X-D, Yuan L, Wang K, Crans DC. Pharm Res. 2004;21:1026–1033. doi: 10.1023/b:pham.0000029293.89113.d5. [DOI] [PubMed] [Google Scholar]
- 37.Zhang Y, Yang X, Wang K, Crans DC. J Inorg Biochem. 2006;100:80–87. doi: 10.1016/j.jinorgbio.2005.10.006. [DOI] [PubMed] [Google Scholar]
- 38.Aureliano M, Henao F, Tiago T, Duarte RO, Moura JJG, Baruah B, Crans DC. Inorg Chem. 2008 doi: 10.1021/ic702405d. Submitted. [DOI] [PubMed] [Google Scholar]
- 39.Lei Y, Hagen GM, Smith SML, Barisas BG, Roess DA. Biochem Bioph Res Co. 2005;337:430–434. doi: 10.1016/j.bbrc.2005.09.066. [DOI] [PubMed] [Google Scholar]
- 40.Lei Y, Hagen GM, Smith SM, Liu J, Barisas G, Roess DA. Mol Cell Endocrinol. 2007;260–262:65–72. doi: 10.1016/j.mce.2005.11.046. [DOI] [PMC free article] [PubMed] [Google Scholar]
- 41.Sheets ED, Holowka D, Baird B. Curr Opin Chem Biol. 1999;3:95–99. doi: 10.1016/s1367-5931(99)80017-9. [DOI] [PubMed] [Google Scholar]
- 42.Smith SML, Lei Y, Liu J, Cahill ME, Hagen GM, Barisas BG, Roess DA. Endocrinol. 2006;147:1789–1795. doi: 10.1210/en.2005-1046. [DOI] [PubMed] [Google Scholar]
- 43.McNeill JH, Yuen VG, Hoveyda HR, Orvig C. J Med Chem. 1992;35:1489–1491. doi: 10.1021/jm00086a020. [DOI] [PubMed] [Google Scholar]
- 44.Crans DC, Baruah B, Gaidamauskas E, Lemons BG, Lorenz BB, Johnson MD. J Inorg Biochem. 2008 doi: 10.1016/j.jinorgbio.2008.01.015. Submitted. [DOI] [PubMed] [Google Scholar]
- 45.Song J, Hagen GM, Roess DA, Pecht I, Barisas BG. Biochemistry. 2002;41:881–889. doi: 10.1021/bi011566i. [DOI] [PubMed] [Google Scholar]
- 46.Roess DA, Smith SML. Biol Reprod. 2003;69:1765–1770. doi: 10.1095/biolreprod.103.018846. [DOI] [PubMed] [Google Scholar]
- 47.Ehring G, Kerschbaum H, Fanger C, Eder C, Rauer H, Cahalan M. J Immunol. 2000;164:679–687. doi: 10.4049/jimmunol.164.2.679. [DOI] [PubMed] [Google Scholar]
- 48.Pallandini G, Tozzi R, Perlini SJ. Hypertens. 2003;21:1823–1825. doi: 10.1097/00004872-200310000-00007. [DOI] [PubMed] [Google Scholar]
- 49.Pessin JE, Thurmond DC, Elmendorf JS, Coker KJ, Okada S. J Biol Chem. 1999;274:2593–2596. doi: 10.1074/jbc.274.5.2593. [DOI] [PubMed] [Google Scholar]
- 50.Lidke KA, Andrews NL, Lidke DS, Pfeiffer JR, Wilson BS, Oliver JM, Burns AR. Biophys J. 2007:418A–418A. [Google Scholar]


