Abstract
Equivalent uniform dose (EUD) is the absorbed dose that, when homogeneously given to a tumor, yields the same mean surviving clonogen number as the given non-homogeneous irradiation. EUD is used as an evaluation tool under the assumption that two plans with the same value of EUD are equivalent, and their biological effect on the tumor (clonogen survival) would be the same as the one of a homogeneous irradiation of absorbed dose EUD. In this work, this assumption has been studied, and a figure of merit of its applicability has been obtained. Distributions of surviving clonogen number for homogeneous and non-homogeneous irradiations are found to be different even if their mean values are the same, the figure of merit being greater when there is a wider difference, and the equivalence assumption being less valid. Therefore, EUD can be closer to a uniform dose for some cases than for other ones (high α values, extreme heterogeneity), and the accuracy of the radiobiological indices obtained for evaluation, could be affected. Results show that the equivalence is very sensitive to the choice of radiobiological parameters, and this conclusion has been derived from mathematical properties of EUD.
Keywords: Equivalent uniform dose, mixed Poisson distribution, radiobiology
Introduction
Equivalent Uniform Dose (EUD) is defined as the absorbed dose that, if homogeneously delivered to a tumor, causes the same expected number of clonogens to survive as the actual non-homogeneous absorbed dose distribution does.[1–3] Clonogen survival is a stochastic magnitude governed by Poisson statistics, and EUD is obtained as an expectation value.
EUD is a simplified parameter designed to make comparisons among alternative treatment plans easy, when irradiations are non-homogeneous. The underlying assumption is that homogeneous irradiation of a tumor with absorbed dose D, and any non-homogeneous irradiations with EUD equal to D are equivalent in a biological sense. The biological effect is considered equal as long as the mean surviving fraction of clonogens is the same.[4]
One of the advantages pointed out in the article by Niemierko,[1] who first defined the EUD concept, was its robustness, i.e. its slow variation with radiobiological parameters. McGary et al.,[4] studied this issue further and reported non-negligible dependence of EUD with linear-quadratic model parameters when large-dose inhomogeneities are present.
The phenomenological EUD concept was introduced by Niemierko in 1999[5] in order to provide a simple formula applicable to both, tumors and normal tissue. Its basis is the power law behavior of tissue response with dose, and it has one parameter to be fitted depending on the tissue and the irradiation characteristics.
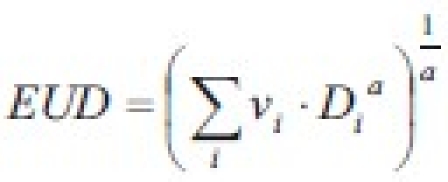
(where vi is the partial volume with absorbed dose Di). This formula has found widespread applications mainly due to its algebraic simplicity, despite the fact that it is not derived from cell survival models. It has sometimes been referred to as “generalized EUD (gEUD)”. A brief discussion on these features was brought about by Amols and Ling[6] on the article on biological optimization by Wu et al.[7]
As gEUD is a phenomenological concept and is not based on cell survival models, its claim of representing the absorbed dose that, if homogeneously given, would lead to the same clonogen survival (or the same response, in normal tissue) as the actual irradiation (equivalence assumption) is not as well supported as for the original mechanistic EUD concept.[6,7] The free parameter a is fitted according to published clinical data[8–14] being positive for normal tissue and negative for tumors. The benefits obtained from its simple algebraic formula and its flexibility cannot be overemphasized: its use in optimization algorithms, TCP and NTCP computation routines and the modeling of normal tissue response is now widespread.[7,15–18]
The purpose of this work is to study the equivalence assumption. A quality index describing the excess of standard deviation in surviving clonogen distribution with dose heterogeneity will be derived and its properties studied.
Materials and Methods
In the present work, the equivalence assumption on tumor EUD is studied from a mathematical point of view, and an index of merit for equivalence is proposed. The lower the value of the index, the greater the reliability of the equivalence assumption, as the dose inhomogeneity will not increase greatly the surviving clonogen number variance. The theory in this study is based on the different probability distribution of the number of surviving clonogens for homogeneous and non-homogeneous absorbed dose distributions, even if mean values are equal. Extensive use of mixed Poisson distributions is made to account for the effect of dose heterogeneity, instead of the voxel-oriented formula used in the original EUD formulation. This original approach will provide tools to obtain the variance of the distribution.
Theoretical background
A tumor is modeled as a set of N clonogens, with identical properties and independent evolution. If the tumor is irradiated with a uniform dose D, the probability distribution of surviving clonogens is a Poisson one, and its parameter, according to the linear-quadratic model, is:

with α and β parameters. For conventional fractionated external irradiations, the linear term in the exponent is greater than the other one[19] and:
![]()
This is an assumption already made by Niemierko when EUD was first defined[1] and it is applicable to a wide range of tumors. Modern techniques like biologically guided radiation therapy would require the full model[20] but the EUD concept would be of little use in that case. McGary et al.,[4] presented a formulation of EUD with both parameters present.
The fact is that absorbed doses are not uniform throughout the tumor even though they are intended to be homogeneous. A common approach to compute radiobiological indices is to divide the tumor volume into voxels small enough to have constant dose, and then assume that they behave as independent pieces of tumor put together.[1,21,22]
A different approach is possible without building up artificial structures inside the tumor, if a mixture model is substituted for the Poisson probability model used so far.
Mixture models are often introduced on empirical problems; a variable is described by a probability distribution, but one of its parameters is allowed to be a random variable itself.[23] The distribution of the parameter is said to be “mixing” the model.
When uniform absorbed dose is not possible, survival fractions will vary across the tumor volume, and their values can be described according to a probability distribution determined by the absorbed dose distribution.
A discrete mixture distribution is defined in terms of its probability function with the following equation:[23]

p(x/λ) is the conditional probability function, for a particular value of λ in Θ gλ(λ) is the mixing density function. p(x/λ) is a probability function with a free parameter, and gλ(λ) is the density function describing the distribution of this parameter as a random variable.
In the radiobiological case, the conditional probability function p(x/λ) is the Poisson survival model for a particular value of λ. gλ(λ) is the mixing density function: it is the density function of λ because of its dependence on the absorbed dose, which in turn is distributed according to the differential dose volume histogram (DVHd, relative volume). As a matter of fact, the density distribution of λ depends on the dose volume histogram, and its expression is simpler when written as a function of D:

The probability function for the number of clonogens is:

A simple property of mixture models can be used to find expectation values[23] (the symbol Ex/λ means conditional expectation value):
![]()
but p(x|λ) is a Poisson distribution, with parameter λ =N.e-αD; therefore its mean is:
![]()
Thus, the mean number of surviving clonogens is:
![]()
On the other hand, there is a similar formula for variance in mixture models:[23]
![]()
The conditional distribution is a Poisson one, thus (from Eq.7):
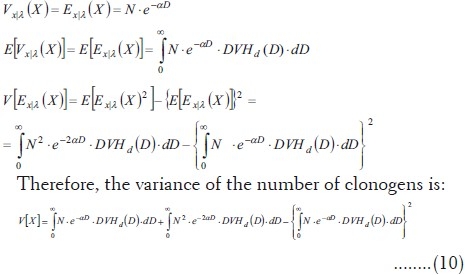
Equivalent uniform dose
If an irradiation is perfectly homogeneous, gD(D) would be a Dirac delta, and its integration would simply turn every D symbol into the homogeneous absorbed dose value Dh. Applying this mixing density to equation (8):

The problem of computing EUD consists in finding the homogeneous dose Dh corresponding to a given mean clonogen number (the mean number derived from a non-homogeneous irradiation).
![]()
Therefore, if X is the mean survival number of clonogens, then:
![]()
This is the same equation found by Niemierko,[1] although the derivation and change of notation will be shown in the Appendix.
If the same procedure is applied to equation (10):

Therefore, the Poisson property is obtained (mean and variance are equal). When the dose is homogeneous, the mixture model becomes a standard Poisson model.
Equations (8), (10) and (13) are computed in practice as summations:
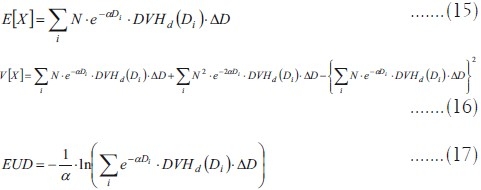
Generalized equivalent uniform dose
As the phenomenological formulation of EUD for tumors is to be fitted to clinical outcome data, equality of means is not a hypothesis to be derived from the linear quadratic model. EUD would equal the mean dose because of goodness of fit and from a practical point of view, this fit could provide evidence about α values. Therefore:

As long as the generalized EUD for a tumor is a uniform dose causing the same biological effect as a heterogeneous irradiation, it will fit a mechanistic EUD* model, and the variance problem can be treated with the same tools for both formulations of the index.
Quality index for EUD equivalence
If an additional random variable is defined, Y, as the number of surviving clonogens after a uniform irradiation with dose DY = EUD, its mean will be

and its variance will be:

If a non-homogeneous distribution is considered equivalent to a uniform distribution with absorbed dose DY = EUD, it is implicitly assumed that the resulting surviving probability distribution is that of a uniform distribution of dose DY = EUD, i.e., that the surviving clonogens’ distribution is Y, not X.
In fact, EUD is derived because absorbed dose is inhomogeneous, and its variance is the one computed before (equations 10 and 16). Its square root is the actual standard deviation:

This variance is different from the one that a truly uniform distribution would show. Therefore, dose heterogeneity has an effect on clonogen survival that is absent in uniform irradiations. This fact makes equivalence between a uniform irradiation and a heterogeneous one, approximate but never exact.
A useful quality index of EUD should measure how much standard deviation is increased due to the fact that it is not a uniform dose, but an actual heterogeneous distribution. It should measure how different the true standard deviations of X and Y are.

The greater this index is, the more inconsistent is the variance value with a uniform distribution and, therefore, the less informative EUD could be.
Practical application on clinical treatment plans
A set of dose-volume histograms was prepared. Their shape is Gaussian, their mean is 2 Gy and their standard deviations range from 0.02 Gy to 0.20 Gy [Figure 1]. EUD and qEUD were computed in every case using equations 12 and 20, implemented in a spreadsheet application. No special software was needed apart from mathematical and logical commands already implemented in the spreadsheet application. Two more DVHs were obtained by adding a cold spot to the DVHs with standard deviations 0.02 Gy and 0.10 Gy: the minimum dose inside the cold spot was reduced in 0.005 Gy. To explain the effect of dose inhomogeneity, examples of treatment plans of 1) head and neck (H and N) treatment, 2) bladder treatment and 3) prostate treatments by linear accelerator have been used as well. The central slice dose distribution for the head and neck treatment is shown in Figure 2 and a conventional and an IMRT prostate plan are shown in Figure 3. Their dose volume histograms are outlined in Figure 4 (head and neck), 5 (bladder) and 6 (prostate). Figure 4 shows that the head and neck treatment plan is more heterogeneous with minimum dose 88% and maximum dose 110%. Figures 5 and 6 show better dose homogeneity values (minimum 97% and maximum 102% for bladder, minimum 98% and maxima 104% and 107% for prostate).
Figure 1.
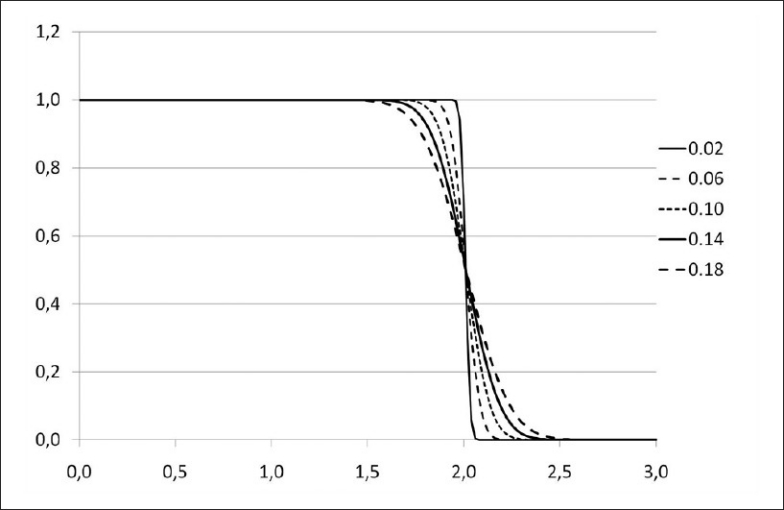
Dose volume histograms for Gaussian dose distributions with standard deviations 0.02, 0.06, 0.10, 0.14, 0.18
Figure 2.
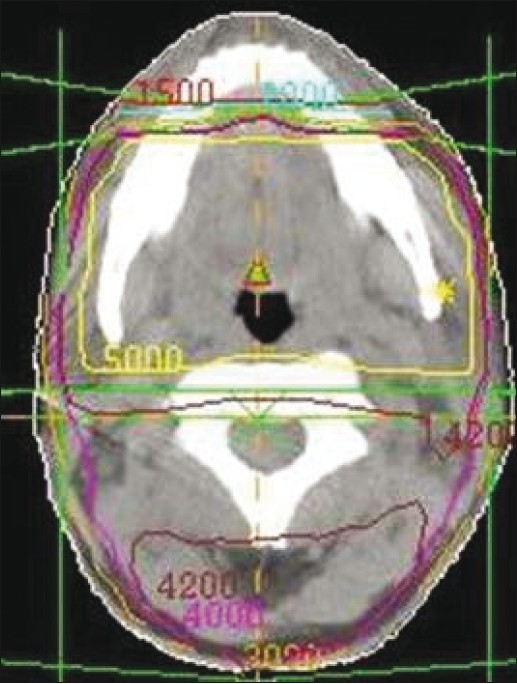
Central slice isodose map for a head and neck treatment used as practical application. Major causes of heterogeneity are the proximity of the skin and organs at risk
Figure 3.
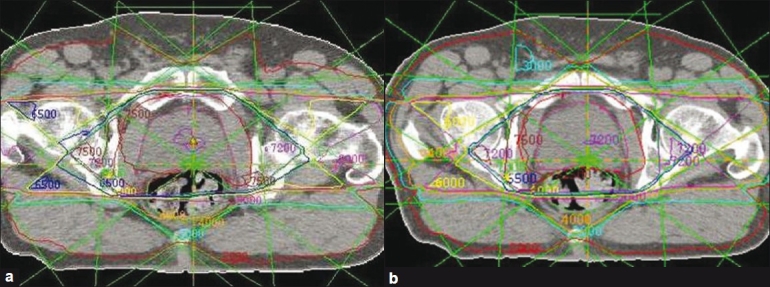
Central isodose map for a prostate treatment practical example: (a) conventional treatment; (b) intensity-modulated treatment
Figure 4.
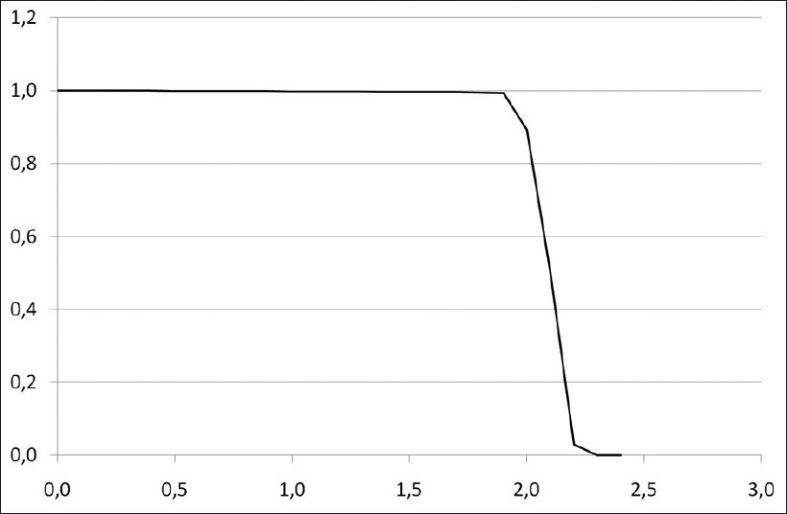
Dose volume histogram for a bladder treatment
Figure 5.
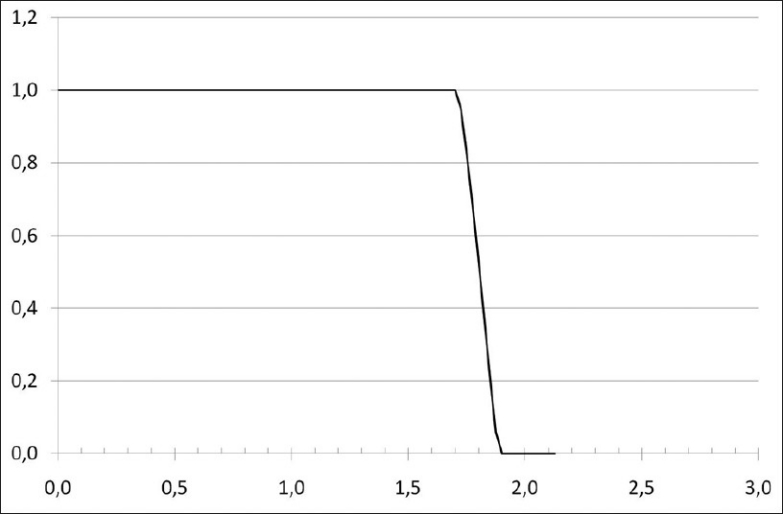
Dose volume histogram for a head and neck treatment
Figure 6.
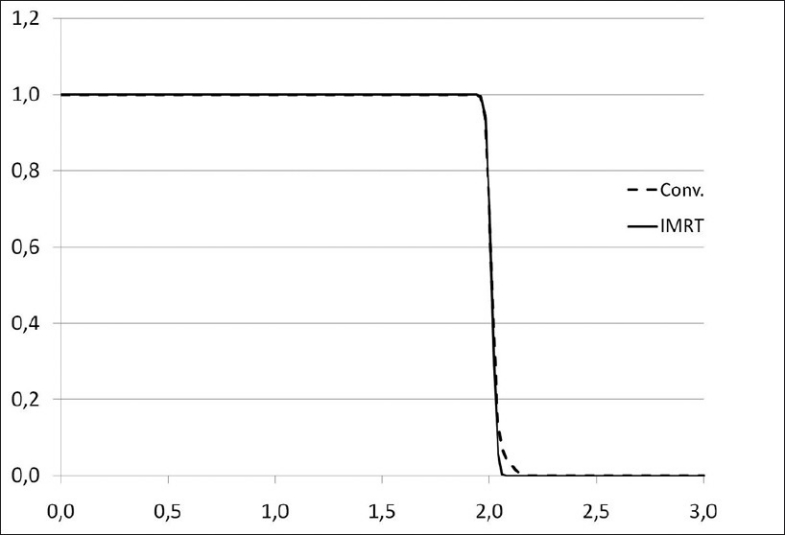
Dose volume histograms for prostate treatment plans
Results
Results for the quality index q are shown in Table 1. The effect of several values of the parameter α and a set of standard deviations for the dose distribution on q is seen. It is apparent that the wider the dose distribution, the greater the quality index value is: the more different from a homogeneous dose, the less representative a EUD value is. When a cold spot is present, values grow with regards to the previous ones for any value of α.
Table 1.
Quality index for EUD for several values of dose dispersion (Gaussian distribution with mean dose 2 Gy), and α
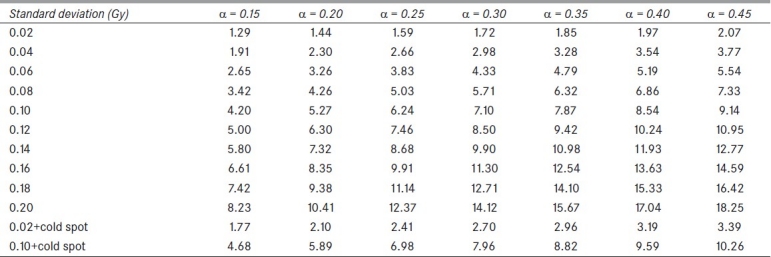
Finally, the bladder treatment resulted in values qEUD=0.98-1.00 for α=0.3 to α=0.4 due to the homogeneity of the dose. Both prostate plans resulted in values close to 1 (0.99-1.00) for the same range of α values; the head and neck treatment scored qEUD=3.26. These clinical results confirm the dependency on dose heterogeneity shown in Table 1.
The effect of the radiobiological parameter α is remarkable; taking into account that radiobiological parameters show large uncertainties, a critical outlook should be taken when large values of α are to be used. It is clearly seen that equivalence of radiobiological effects suffers when heterogeneity causes such increase in dispersion though EUD in each case is the same.
Discussion
The present work develops a method to estimate the survival distribution of a non-homogeneous distribution described by Niemierko's EUD concept. A mixture Poisson model was found to be applicable, and variance could be separated into a contribution from the variability of the random process of cell killing and a second component due to the variability of absorbed dose, and therefore survival probability, across the tumor.
Two dose distributions are radiobiologically equivalent if the clonogen survival they lead to are equal. Because of the variance introduced by the variation in absorbed dose, uniform distributions are not equivalent to non-uniform ones, and a quality index q(%) was introduced in order to measure the magnitude of this effect. It was found to be dependent on the radiobiological parameter α, causing the radiobiological equivalence for dose distributions with the same EUD to be critical for large α. The study by McGary et al.,[4] arrived at the conclusion that when large inhomogeneities were present, EUD was not independent of linear-quadratic model parameters, as initially assumed by Niemierko.[1] In this work, it becomes clear that there is a further reason, based on clonogen population, as to how and why the equivalence hypothesis can be deteriorated when tumor dose is less uniform, and this conclusion has been reached through theoretical considerations. When evaluating the results from this study, it can be concluded that tumor control probability (TCP) is more reliable as an evaluation parameter for the bladder and prostate treatments (conventional or intensity-modulated) than for the head and neck plan studied here. It is also remarkable that equivalence does not seem to be reliable for extremely non-uniform distributions and, in that case, the effects cannot be expected from the assumption of a hypothetical uniform dose that corresponds to EUD.
It is worth mentioning that TCP are often computed on the assumption that EUD does represent an equivalent dose for tumors:[24] when applying the equation,

the equivalence assumption is being made. The increase in variance can be thought of as the adding of uncertainty to EUD, what eventually can lead to unreliable results. Computation of a quality index for EUD can provide a warning for cases when values of EUD lack accuracy, or when a computer optimization tool chooses inadequate parameters.
Incidentally, the theory of mixed Poisson models has made possible a rigorous derivation of the original Niemierko's EUD formula for heterogeneous irradiations with no artificial setting-up of an array of voxels inside the tumor. This derivation is shown in the appendix, and has been the starting point of the theoretical derivations in this work.
Appendix
Derivation of Niemierko's EUD formula for non-homogeneous irradiations:
Equation 2 shows the mean value of the clonogen number for a non-homogeneous irradiation. On the other hand, it has been proved that for a homogeneous irradiation with Dose Dh the following equation is true,

EUD has to be obtained applying the condition that it results in the same mean clonogen number, if homogeneously applied, as the non-homogeneous irradiation,

Therefore, E[X] has to be substituted for X in the formula for Dh to obtain EUD:

This is the general equation to obtain EUD from an arbitrary dose distribution. In Niemierko's original article[1] a different notation is used, based on the survival fraction associated to a dose of 2 Gy according to the survival curve and the following notation:

For the reference dose Dr:

This means that the radiobiological parameter α is equivalent, in Niemierko's notation, to 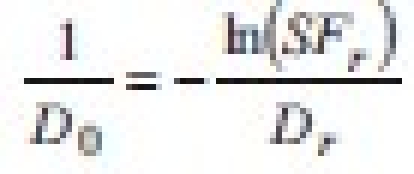 . Substituting in the equation for EUD:

This is the final formula for EUD; its relationship with the equation in Niemierko's paper[1] can only be shown if dose is supposed to be a discrete random variable  . Integrals become summations when the variable is a discrete one, and, calling the differential DVH “partial volume” vi, Niemierko's formula is obtained:

Acknowledgments
S. Russell, A. Pérez and C. Weatherill from Boston U.
Footnotes
Source of Support: Nil.
Conflict of Interest: None declared.
References
- 1.Niemierko A. Reporting and analyzing dose distributions: A concept of equivalent uniform dose. Med Phys. 1997;24:103–10. doi: 10.1118/1.598063. [DOI] [PubMed] [Google Scholar]
- 2.McGary JE, Grant W, 3rd, Woo SY, Butler EB. Comment on ‘Reporting and analyzing dose distributions: A concept of equivalent uniform dose’. Med Phys. 1997;24:1323–4. doi: 10.1118/1.598024. [DOI] [PubMed] [Google Scholar]
- 3.Niemierko A. Response on “Comment on ‘Reporting and analyzing dose distributions: A Concept of equivalent uniform dose’”. Med Phys. 1997;24:1325–7. doi: 10.1118/1.598063. [DOI] [PubMed] [Google Scholar]
- 4.McGary JE, Grant W, 3rd, Woo SY. Applying the equivalent uniform dose formulation based on the linear-quadratic model to inhomogeneous tumor dose distributions: Caution for analyzing and reporting. J Appl Clin Med Phys. 2000;1:126–37. doi: 10.1120/jacmp.v1i4.2634. [DOI] [PMC free article] [PubMed] [Google Scholar]
- 5.Niemierko A. A generalized concept of equivalent uniform dose (EUD) Med Phys. 1999;26:1100. [Google Scholar]
- 6.Amols HI, Ling CC. EUD but not QED. Int J Radiat Oncol Biol Phys. 2002;52:1–2. doi: 10.1016/s0360-3016(01)02586-x. [DOI] [PubMed] [Google Scholar]
- 7.Wu Q, Mohan R, Niemierko A, Schmidt-Ullrich R. Optimization of intensity-modulated radiotherapy plans based on the equivalent uniform dose. Int J Radiat Oncol Biol Phys. 2002;52:224–35. doi: 10.1016/s0360-3016(01)02585-8. [DOI] [PubMed] [Google Scholar]
- 8.Emami B, Lyman J, Brown A, Coia L, Goitein M, Munzenrider JE, et al. Tolerance of normal tissue to therapeutic irradiation. Int J Radiat Oncol Biol Phys. 1991;21:109–22. doi: 10.1016/0360-3016(91)90171-y. [DOI] [PubMed] [Google Scholar]
- 9.Bentzen SM, Constine LS, Deasy JO, Eisbruch A, Jackson A, Marks LB, et al. Quantitative analyses of normal tissue effects in the clinic (QUANTEC): An introduction to the scientific issues. Int J Radiat Oncol Biol Phys. 2010;76:S3–9. doi: 10.1016/j.ijrobp.2009.09.040. [DOI] [PMC free article] [PubMed] [Google Scholar]
- 10.Kwa SL, Lebesque JV, Theuws JC, Marks LB, Munley MT, Bentel G, et al. Radiation pneumonitis as a function of mean lung dose: An analysis of pooled data of 540 patients. Int J Radiat Oncol Biol Phys. 1998;42:1–9. doi: 10.1016/s0360-3016(98)00196-5. [DOI] [PubMed] [Google Scholar]
- 11.Eisbruch A, Ten Haken RK, Kim HM, Marsh LH, Ship JA. Dose, volume, and function relationships in parotid salivary glands following conformal and intensity-modulated irradiation of head and neck cancer. Int J Radiat Oncol Biol Phys. 1999;45:577–87. doi: 10.1016/s0360-3016(99)00247-3. [DOI] [PubMed] [Google Scholar]
- 12.Chao KS, Deasy JO, Markman J, Haynie J, Perez CA, Purdy JA, et al. A prospective study of salivary function sparing in patients with head-and-neck cancers receiving intensity-modulated or three-dimensional radiation therapy: Initial results. Int J Radiat Oncol Biol Phys. 2001;49:907–16. doi: 10.1016/s0360-3016(00)01441-3. [DOI] [PubMed] [Google Scholar]
- 13.Powers BE, Thames HD, Gillette SM, Smith C, Beck ER, Gillette EL. Volume effects in the irradiated canine spinal cord: Do they exist when the probability of injury is low? Radiother Oncol. 1998;46:297–306. doi: 10.1016/s0167-8140(97)00213-2. [DOI] [PubMed] [Google Scholar]
- 14.Brenner DJ. Dose, volume, and tumor-control predictions in radiotherapy. Int J Radiat Oncol Biol Phys. 1993;26:171–9. doi: 10.1016/0360-3016(93)90189-3. [DOI] [PubMed] [Google Scholar]
- 15.Warkentin B, Stavrev P, Stavreva N, Field C, Fallone BG. A TCP-NTCP estimation module using DVHs and known radiobiological models and parameter sets. J Appl Clin Med Phys. 2004;5:50–63. doi: 10.1120/jacmp.v5i1.1970. [DOI] [PMC free article] [PubMed] [Google Scholar]
- 16.Thieke C, Bortfeld T, Niemierko A, Nill S. From physical dose constraints to equivalent uniform dose constraints in inverse radiotherapy planning. Med Phys. 2003;30:2332–9. doi: 10.1118/1.1598852. [DOI] [PubMed] [Google Scholar]
- 17.Park CS, Kim Y, Lee N, Bucci KM, Quivey JM, Verhey LJ, et al. Method to account for dose fractionation in analysis of IMRT plans: Modified equivalent uniform dose. Int J Radiat Oncol Biol Phys. 2005;62:925–32. doi: 10.1016/j.ijrobp.2004.11.039. [DOI] [PubMed] [Google Scholar]
- 18.Kuperman VY. General properties of different models used to predict normal tissue complications due to radiation. Med Phys. 2008;35:4831–6. doi: 10.1118/1.2963988. [DOI] [PubMed] [Google Scholar]
- 19.Deacon J, Peckham MJ, Steel GG. The radioresponsiveness of human tumours and the initial slope of the cell survival curve. Radiother Oncol. 1984;2:317–23. doi: 10.1016/s0167-8140(84)80074-2. [DOI] [PubMed] [Google Scholar]
- 20.South CP, Evans PM, Partridge M. Dose prescription complexity versus tumor control probability in biologically conformal radiotherapy. Med Phys. 2009;36:4379–88. doi: 10.1118/1.3213519. [DOI] [PubMed] [Google Scholar]
- 21.Webb S, Nahum AE. A model for calculating tumour control probability in radiotherapy including the effects of inhomogeneous distributions of dose and clonogenic cell density. Phys Med Biol. 1993;38:653–66. doi: 10.1088/0031-9155/38/6/001. [DOI] [PubMed] [Google Scholar]
- 22.Källman P, Agren A, Brahme A. Tumour and normal tissue responses to fractionated non-uniform dose delivery. Int J Radiat Biol. 1992;62:249–62. doi: 10.1080/09553009214552071. [DOI] [PubMed] [Google Scholar]
- 23.Karlis D, Xekalaki E. Mixed poisson distributions. Int Stat Rev. 2005;73:35–58. [Google Scholar]
- 24.Niemierko A. A unified model of tissue response to radiation. In: Proceedings of the 41th AAPM annual meeting; 1999. Nashville, Tennessee: Med Phys; 1999. p. 1100. [Google Scholar]


