

Abstract
Most of the commercially available software for brain tumor segmentation have limited functionality and frequently lack the careful validation that is required for clinical studies. We have developed an image-analysis software package called ‘Prometheus,’ which performs neural system–based segmentation operations on MR images using pre-trained information. The software also has the capability to improve its segmentation performance by using the training module of the neural system. The aim of this article is to present the design and modules of this software. The segmentation module of Prometheus can be used primarily for image analysis in MR images. Prometheus was validated against manual segmentation by a radiologist and its mean sensitivity and specificity was found to be 85.71±4.89% and 93.2±2.87%, respectively. Similarly, the mean segmentation accuracy and mean correspondence ratio was found to be 92.35±3.37% and 0.78±0.046, respectively.
Keywords: Brain tumors, image processing, medical image segmentation, neural networks
Introduction
New techniques, having high sensitivity and specificity, are being developed in the medical image-processing field for better evaluation of lesions. Sophisticated image-analysis software is needed for quantitative measurement in medical imaging. Commercially provided image-processing packages often have limited functionality and frequently lack the validation that is essential before clinical usage.
With expansion in the size and quantity of medical images, computers have become indispensable for expediting processing and analysis. Computer algorithms for the depiction of anatomical structures and regions of interest (ROI) are vital for facilitating and automating specific radiological assignments. These algorithms, called segmentation and texture analysis algorithms,[1–6] play a vital role in medical imaging.
Texture analysis is an image-processing technique by which different regions of an image are located based on their unique texture properties. This process plays an important role in many biomedical applications. In the pioneering work by Schad,[7] brain tumors tissues were characterized by texture analysis based on the gray-level distribution, the gradient distribution, the gray-level co-occurrence matrix, and the gray-level run-length histogram. The classification and segmentation is carried out by a set of discrimination rules formed by the knowledge-based expert system. However, the system proposed by them was time consuming and could be used for only selected ROI. Kjaer et al.[8] also carried out texture analysis for quantitative brain tumor tissue characterization and segmentation. In their study, texture images were computed from calculated T1 and T2 parameter images by applying groups of common first-order and second-order gray-level statistics. However, they were unable to achieve any discrimination between benign and malignant tumor. Gibbs et al.[9] performed morphological operation using thresholding, edge detection, and region growing. However, the approach was framed only to replace the existing manual methods and has similar performance. Herlidou-Meme et al.[10] carried out multivariate statistical analyses in order to discriminate each brain tissue type represented by its own set of texture parameters. In their study, texture analysis was initially performed on test objects to evaluate the method's dependence on acquisition parameters. Each selected brain ROI was characterized with both its mean gray-level values and several texture parameters. On the other hand, Zou et al.[11] utilized three two-sample validation metrics against the estimated composite latent gold standard, which was derived from several experts’ manual segmentations by an EM algorithm. In this study, the distribution functions of the tumor and control pixel data were parametrically assumed to be a mixture of two beta distributions with different shape parameters. They estimated the corresponding receiver operating characteristic curve, dice similarity coefficient, and mutual information over all possible decision thresholds. Based on each validation metric they further computed an optimal threshold via maximization.
Szczypinski et al.[12] developed ‘MaZda,’ a software package for 2D and 3D image-texture analysis. It furnishes a flawless way for quantitative analysis of image textures, and comprises computation of texture features, methods for feature selection and extraction, algorithms for data classification, and various data visualization and image segmentation tools. Kamalov et al.[13] demonstrated a Java-based application for tissue-section image analysis. Holli et al.[14] developed techniques to examine texture criteria for discriminating healthy breast tissue from breast cancer in breast MRI. The study aimed at identification of possible dissimilarities in the texture characteristics of histological types (lobular and ductal) of invasive breast cancer. Harrison et al.[15] also implemented a similar texture-based analysis tool for effective classification of multiple sclerosis lesions. Various other distinct image-processing ideas have also been proposed.[16–18] However, all the studies have been on limited image sets; none are available for routine clinical use because of the difficulties in devising a prototype software that is sufficiently user-friendly to be used by clinicians in their daily practice.
The aim of this study was to develop a user-friendly DICOM-based image-processing software for automatic segmentation and grading of brain tumors in MR images; we called this software ‘Prometheus.’ Our software would also provide the option of implementing various image-processing tools on the MR images for further enhancement. This software has been developed in Visual C++. Net 2003 compiler. Microsoft® Foundation Class (MFC)-based visual C++ has been used for coding.
Prometheus: Overview
The front-end view of the Prometheus software is shown in the Figure 1 and consists of a menu bar at the top, with a three-panel window: the image-viewing panel, image archive panel, and image information panel. The image viewing panel of the software is in the top left region and displays the list of images that are opened. The viewing panel offers the provision to open many images simultaneously and enables the mouse scrolling operation in order to scroll through the stacks of the MR images. This is particularly useful when multiple images corresponding to a specific image series are to be compared. The current active image is always shown in front and the other images are hidden below the active image. To view other images or to make another image active, the mouse wheel is scrolled up or down. The upper-right corner is occupied with the image archive panel and also contains details about the workspace panel. In addition to all these panels, the software also provides basic information on the active image in the image information panel, which is shown at the left bottom of the user interface. The basic image information shown are row, column, field of view, pixel to body ratio, file name, and image number. The pixel values of the active image can also be seen easily by hovering the mouse over the ROI. The panel also shows the distance information if the distance tool has been implemented.
Figure 1.
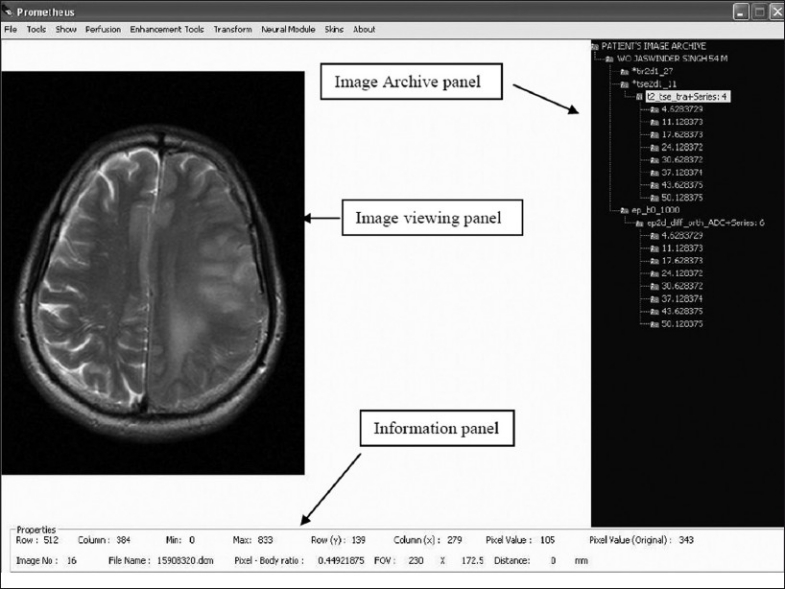
Front panel of Prometheus
The functional menu of Prometheus is shown in the Figure 2. Every operation related to file handling is available under the ‘File’ menu, including handling of the DICOM image independently. All the graphical tools illustrated in Figure 1 can be accessed from the ‘Tool’ menu. The ‘Show’ menu provides a way to simultaneously view the various processed images of the original DICOM image. The perfusion-related operations can be access from the ‘Perfusion’ menu. Similarly, all image-processing tools developed in the software is available under ‘Enhancement Tools and Transform.’ The neural network–related operations are provided under ‘Neural module.’ Since the primary objective of this software is brain tumor segmentation, these operations are distinctly provided under the ‘Segmentation’ menu. Finally, all foreground skins available for the software are given under the ‘Skin’ menu.
Figure 2.
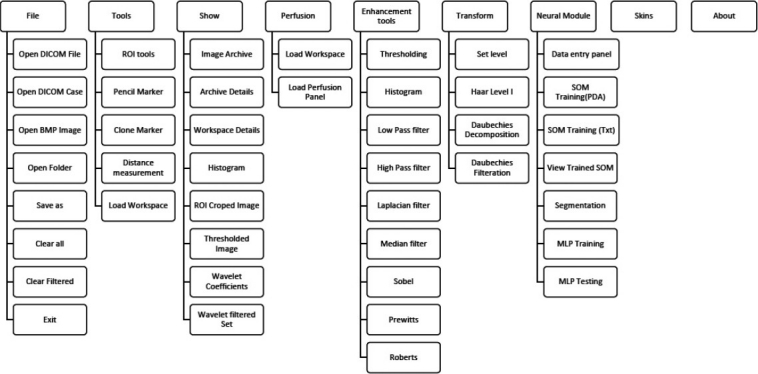
Functional overview of prometheus
The operation of Prometheus can be classified into seven modules. They are file management module, tools module, show/display module, image-processing module, wavelet module, perfusion module, and neural module. The following sections give a detailed overview of the different modules in Prometheus.
File-Management module
One of the strengths of Prometheus is its ability to handle hundreds of MR images in the DICOM format[19–22] that ships with every individual MR case. The file-management module incorporated under the ‘File’ menu has a provision for handling individual, many, or every MR image corresponding to a specific case. It also has the option to convert the DICOM images into the standard ‘bitmap’ (BMP) image. To accomplish this, a DICOM module developed in Prometheus allows handling of every individual image as per the DICOM standard.
Every DICOM image file basically consists of collections of DICOM attributes. The DICOM attributes are the primary building blocks of DICOM images. They provide information about the examination conducted, such as medical device, patient name, pulse sequence, procedure name, exam date, radiologist's name, etc. Every DICOM attribute is characterized by its tag, value representation (VR), value multiplicity (VM) and, finally, the value itself. A tag is divided into two parts, the group tag and the element tag, each of which is two bytes long. The value representation generally, refers to various data types of the DICOM attributes. The value multiplicity provides the information about the repeatability of the DICOM attribute value. Value provides information about the DICOM attribute. The DICOM module developed in Prometheus scans through every tag and then uses their values appropriately. The sequence of operations that are carried out by the DICOM module is illustrated in Figure 3. It is important to mention that Prometheus assumes that DICOM images are encoded in little endian, with no JPEG-encoded images.
Figure 3.
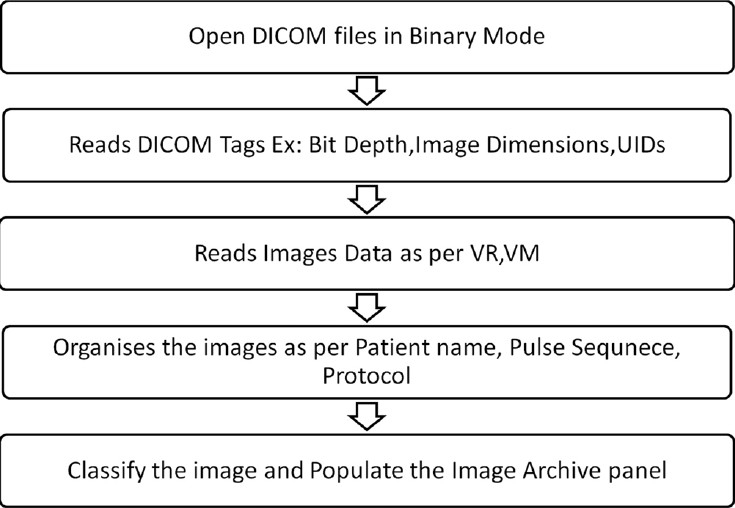
Basic operations of the Digital Imaging and Communications in Medicine module
While reading the entire MR case of many patients, every image data is stacked according to its pulse sequence and protocol detail [Figure 4]. After classifying the images of each MR case as per their imaging series and protocols, they are properly stacked in the image archive panel. The image archive panel contains quantitative details about all the images corresponding to a particular patient. The images corresponding to a series and protocols can be opened by a click operation on the relevant menu in the archive panel. In addition to the DICOM-based images, Prometheus provides support to handle and process external non-medical images like BMP images via the file-management system.
Figure 4.
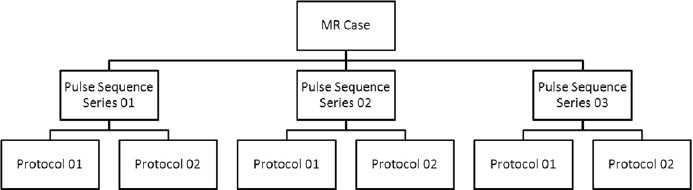
The classification methodology used in file-management system
Tools module
In order to effectively extract information from the images, various tools have been provided in Prometheus [Figure 1]; these are:
Drawing tools (ROI, Pencil, Clone marker)
Distance Measurement
Workspace Management
Drawing tools
The drawing tools incorporated are the Region-of-Interest (ROI) Marker, Pencil Tool, and Clone Marker. The ROI Marker and the Pencil Tool have been developed to properly select a particular ROI for image processing and for selecting the similar region in every image of the series. The Clone Marker tool simplifies the task by providing the facility to copy the ROI from one slice to the subsequent slice and helps in reducing the time required to redraw the ROI in these slices.
Distance measurement
The Distance Measurement tool utilizes the pixel–body ratio to determine the distance (in millimeters) between the different anatomies. The pixel–body ratio corresponding to a particular image is identified from its DICOM tags. The distance is calculated by taking the product of the pixel distance measured in numbers and pixel–body ratio.
Workspace management
One of the distinguishing features of Prometheus is the concept of workspace management. The workspace is the place where certain selected images from the main archive available are kept for further processing; this concept is very useful. Every MR image case possesses hundreds of images corresponding to many pulse sequences, and selecting images of interest becomes a laborious task. This can be solved by moving the required images and series to the workspace for further image analysis tasks. In order to select all the images under a particular image series and to move them to the workspace requires the user to select the particular series in the image archive panel. In case only a few images under a image series need to be transferred to the workspace, this can be achieved by using the ‘Archive Details’ tool provided under the ‘Show’ menu of the software. This is carried out by making the status under that image ‘Not Selected for Workspace’ in the image archive detail dialog [Figure 5]. In order to open this dialog, one must choose the appropriate protocol and double click ‘Patient Name’ to view all the images that are archived under that particular protocol in the archive detail dialog.
Figure 5.
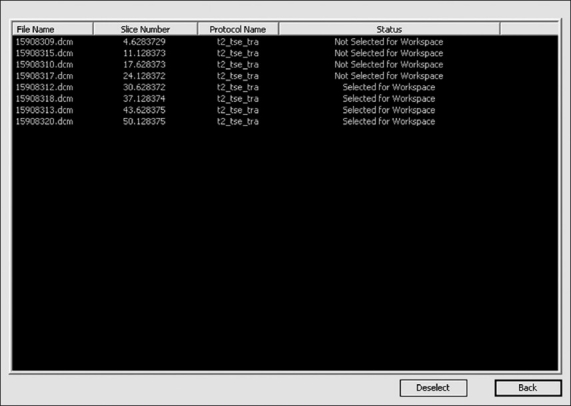
Archive details dialog for selecting images to the workspace
Display/Show module
The Show/Display Module provides the facility to choose the kind of processed image, e.g., wavelet reconstructed images, edge image, etc. This is a key requirement since Prometheus possesses the ability to implement all the image-processing tools simultaneously on the images that are opened. Thus, it is possible to get the threshold wavelet coefficients of the MR images to be generated and viewed simultaneously.
Image-Enhancement module
Image enhancement is the method whereby the quality of an image is improved by manipulating the image with various operators. The image-enhancement operators implemented in Prometheus are low-pass, high-pass, median, laplacian, and deblur filters; histogram plots; and various edge-detection methods. These image-enhancement tools can be effectively used for smoothing, sharpening, removing noise, and edge detection. Figure 6 shows a snapshot of the implementation of one of the image-enhancement tools.
Figure 6.
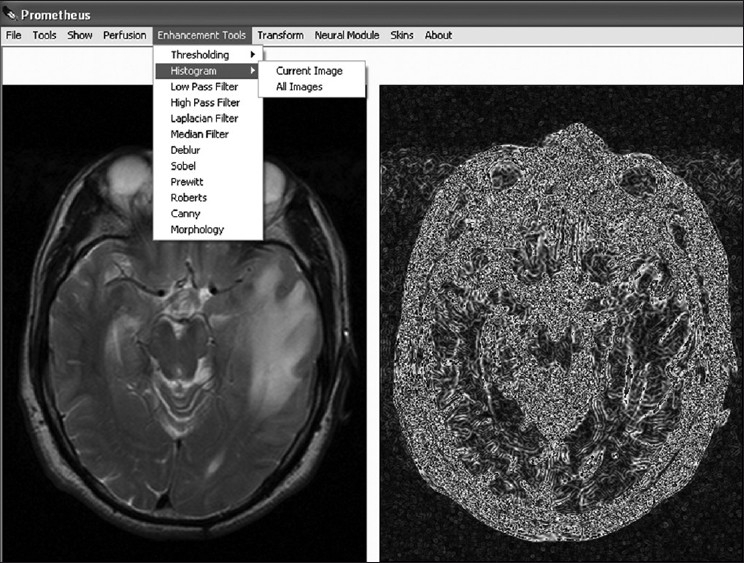
The image-enhancement module
Wavelet-Transform module
Wavelet transform is presently cutting-edge technology for reducing the redundancy that exists in the image and thus it provides essential information on the image nature. Two such wavelet transforms, namely Haar and Daubechies wavelets, are implemented with Prometheus. Figure 7 shows the image-transform module provided with the software. The module has the option to set the level of reconstruction to any value and to get those frequency details. In addition to reconstruction, it also provides the option to selectively filter specific frequencies for further image-processing tasks.
Figure 7.
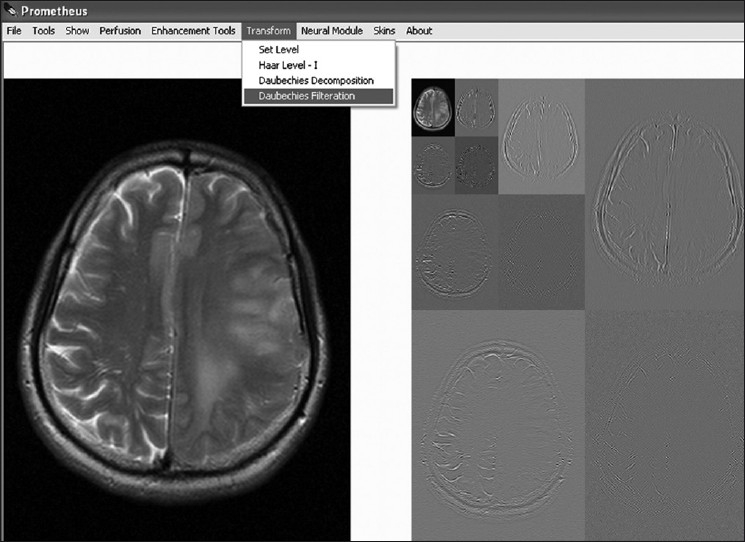
Wavelet transform module
Perfusion module
The Prometheus software also has the ability to perform MR perfusion reconstruction to obtain cerebral blood volume (CBV) parameters[23] from dynamic susceptibility-contrast MR images[24] as explained below. In perfusion MR studies, a bolus of a contrast agent (such as gadolinium-DTPA) is injected into a vein of the patient and the transient signal loss during its passage through the tissue of interest is then measured. During the passage of contrast agent, a series of images (generally T2* weighted) of selected slices are acquired. These types of images are called dynamic susceptibility-contrast MR images. Since the transit time of the bolus through the tissue is only a few seconds, a rapid MRI technique is required to properly characterize the signal-intensity time course. The more commonly used sequences are echo-planar imaging (EPI) and fast low-angle single-shot (FLASH).
Contrast agents induce the paramagnetic properties to bring about decrease in the T2* relaxation properties of tissue and tumors. The reduction in T2* is due to the signal dephasing associated with the susceptibility-induced gradients surrounding the contrast agent. This effect is more significant in areas where the contrast agent is compartmentalized, since this increases the induced gradients.
The method developed in this study basically quantifies the hemodynamic parameters, especially CBV, as illustrated in Figure 8. Quantification of CBV is based on the determination of the concentration of the contrast agent, which reaches every voxel of the brain. The concentration of the contrast agent which reaches the tissue region is determined as
Figure 8.
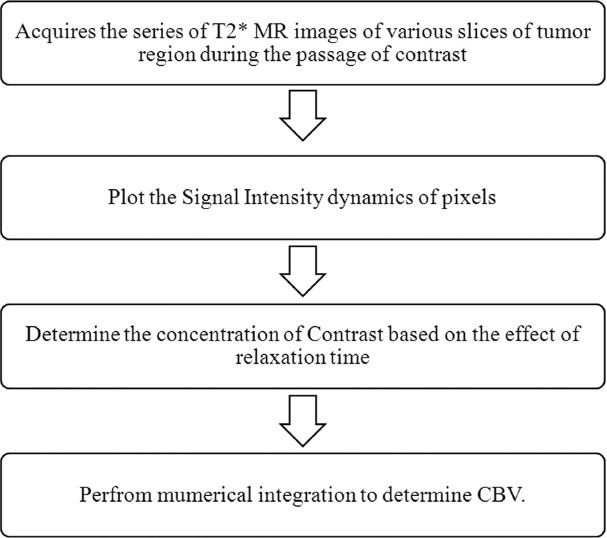
Techniques involved in determining CBV in perfusion MR
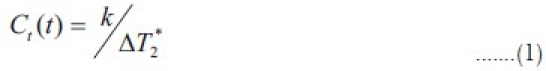
where k is a proportionality constant that depends on the tissue, the contrast agent, the field strength, and the pulse sequence parameters, and is set to one. The above equation assumes that T1 effects are negligibly small, which is a reasonable assumption for a T2* weighted sequence using an intravascular contrast agent. In the above equation, the ΔT2* can be obtained from the signal intensity changes over the time intervals; this is calculated as
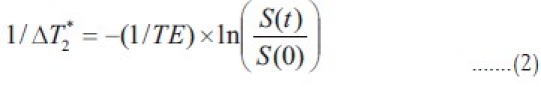
where S(t) is the signal intensity at time t, S(0) is the signal intensity at t=0 and TE is the echo-time of the MRI sequence. Using Equation (2), the concentration of the contrast agent in a voxel can be quantified as
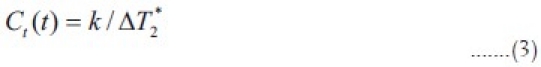
Using Equation (3), the concentration of contrast agent which passes through every voxel region can be calculated and plotted with respect to the acquisition times.
The CBV is finally determined as the normalized amount of contrast agent, which is
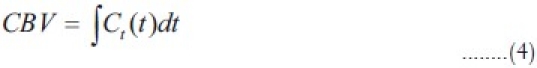
After determining the CBV values of every voxel, they are mapped with the help of histogram mapping, assigning the least CBV values the blue color and the highest CBV value the red color. The sequential operations that need to be followed in calculating the CBV from the dynamic susceptibility contrast MR images software are summarized in Figure 9. Prometheus requires the perfusion study to be preloaded in the workspace before the reconstruction panel is invoked. In the perfusion panel, at first, the software organizes the perfusion images as per protocols and further provides the option to select the slice of interest. Once the slice of interest is selected, it uploads all the dynamic images which correspond to the slice and allows the user to browse through each image by scrolling through the images. It also provides the option to select a specific set of images out of all the dynamic images that correspond to the selected slice. The software also provides the provision to plot signal and contrast information against the acquisition time of a ROI or any pixel on the image. Once the CBV calculation is invoked it quantifies the amount of contrast which goes through every voxel. This information results in formation of CBV image which maps different colors to different CBV values.
Figure 9.
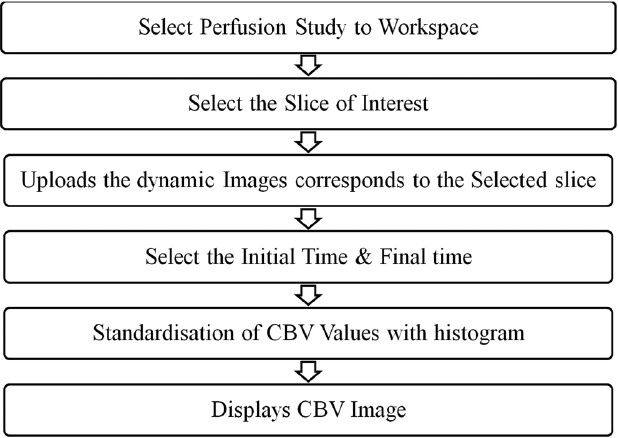
The steps involved in the determination of the CBV in Prometheus
Neural module
The neural network[25–27] module includes the tools for designing, implementing, visualizing, and simulating neural networks. The neural network module provides comprehensive support for multilayer perception and self-organizing map (SOM) neural network architectures. It is well-known fact that the performance of ANN can be increased by increasing the variability of data using a training data set. Some of the key features of the neural module are as follows:
Wizards for selecting the feature vectors and for storing them in customized file format
Wizards for training and clustering the neural networks
Tools to visualize the network performance and to monitor the training process
Ability to save and reload the trained neural network using customized file systems
Ability to provide color-coded results of ‘Best Matching Units’ in case of SOM neural system
Data-Entry panel
The neural tool provides the option to select the feature vector from various regions of the preprocessed MR images, using the data-entry panel, and to store them for training and testing. It also enables better organization and management of saved features and provides the further tools to train the neural system. In this study, the development of the software is primarily to segment and grade the brain tumors, edema, necrosis, CSF, and normal tissue. In order to perform that task, it is necessary that the training feature vector from preprocessed images of various patient images be used to train the network. As evident from Figure 10, the data-entry panel provides a user-friendly, interactive tool to create the training data set from the MR images. In order to generate the feature vector, it needs to initialize the name and number of class as shown in the Figure 10 (a). This dialog window also initializes the total number of training vectors that would be collected later. Subsequently, the data space provides various tools to perform the training vector selection from the MR images as shown in Figure 10 (b–c). In the data space, the training vectors corresponding to a particular class can be easily selected by merely clicking on the images. As the training vectors corresponding to a particular class are selected, the total number of training vector in the data space also gets updated simultaneously. Once the total number of training vectors that are selected equals the total number of training vectors defined in the previous dialog, the data space provides a warning message and forbids further training vector selection. In addition to the training vector selection tools, the data space also provides tools to create a new class and redefine the total number of training vectors. Finally, the acquired patterns can be exported in a specific format called ‘Prometheus DAtas (PDA)’ [Figure 10d]. This helps the user to keep the acquired pattern safely and use it at any time in the future.
Figure 10.
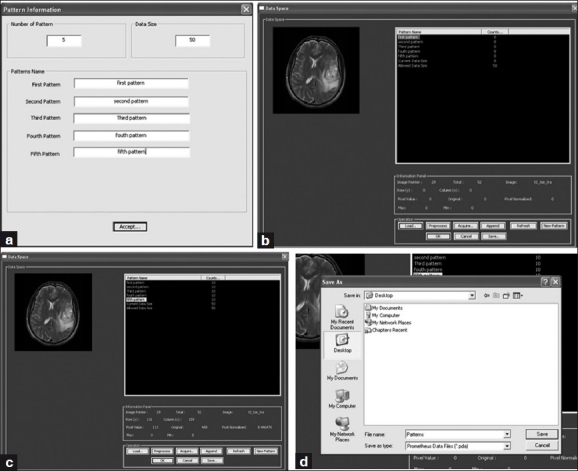
Sequence of operations performed under the data entry panel
One of the key features of this data-entry panel is its ability to support the feature vector collection from images of various patients. In order to do that, the partially acquired feature vector collection of one patient's images can be saved as a PDA file and appended later to images of another patient to generate a training vector from various regions as well as patients. Although the neural network module generally uses the data in PDA for training the neural system, it also supports the patterns embedded in the text file with a specific format, as defined in Figure 11. This allows the neural module to handle the training vectors provided by the other image-processing packages and to use them for image-segmentation tasks.
Figure 11.
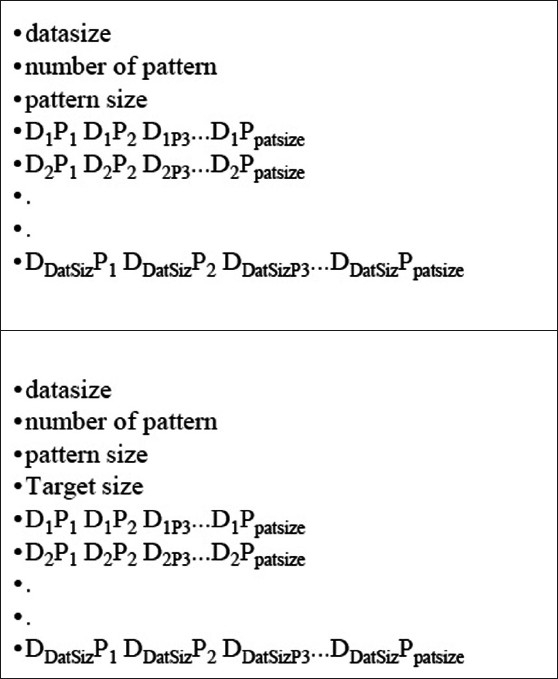
Input file format for pattern handling in Prometheus
Multilayer perceptron
The neural module provides user-friendly tools to train and test the pattern vectors using multilayer perceptron neural network.[28] Figure 12 shows the training and testing panel of the MLP neural network implemented in Prometheus. The training panel receives the details about the pattern vectors using the text file which follows the standard format illustarted in Figure 11 (b). The panel is very user friendly and allows us to set the neural network parameters such as the number hidden nodes, the momentum value, number of iteration, and processing element such as hyperbolic and logistic sigmoid functions. The panel also shows the status of training, including iteration number, running time, gradient at output layer and hidden layer, mean square error, and learning rate at that moment. These options enable the user to achieve better training results using the neural module. The testing panel of the MLP system as shown in Figure 12 (b) allows the user to upload the trained weights and test pattern vectors from the standard text file formats. The output of the MLP system after performing the run in recall mode are saved as a text file.
Figure 12.
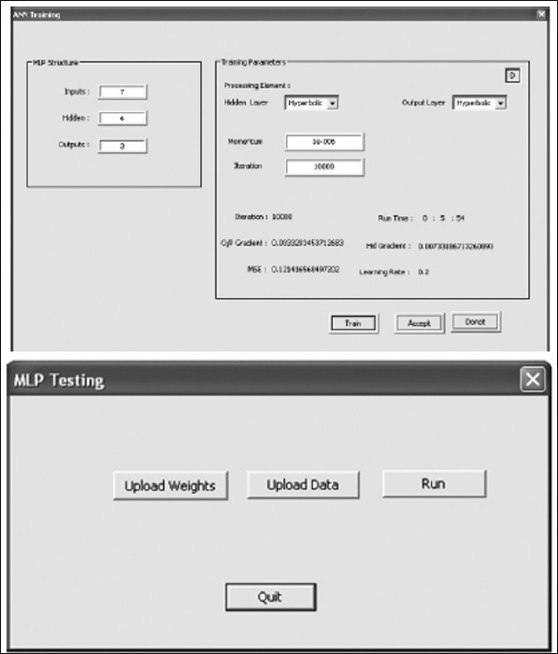
Training and testing panel of MLP
Self-Organizing map
In case of self-organizing map,[29] the neural module provides the tools to import the training data through file formats such as PDA, Txt. It also provides extensive tools to test the trained network and use them for segmentation tasks. The following section elaborates on SOM implementation in the neural module. After importing the data either from an external file or internal file system such as PDA, the SOM training module will appear as shown in Figure 13. The SOM parameters such as dimension and the number of iterations for both ordering as well as fine tuning need to be set, using the SOM parameters panel. The SOM training panel provides tools to train and save the trained weights into specific file formats for further tasks. This training panel consists of two regions: a training window and a training information window. The training window shows the U-matrix representation of the SOM during training and the training information window monitors the status of the training and provides the color map information, which is attached with every class.
Figure 13.
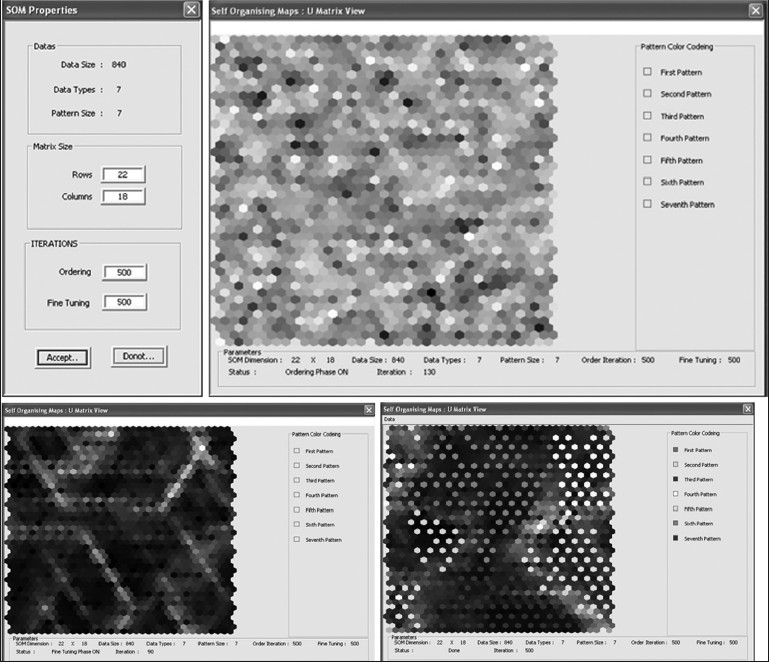
Steps involved in the training panel of SOM of neural package
During the training, the training window shows the intermediate training state of the SOM, such as the ordering stage and the fine-tuning stage. At the end of the training, the U-matrix view of the cluster will be shown in the training window. These U-matrix maps will be superimposed on the best matching units of every class as defined by the training results. The best matching units are units which have got a relatively greater number of hits during the training. The best matching units associated with every class will be shown with a specific color as defined in the training information window.
The optimized weight values of the trained SOM architecture will have great importance during the segmentation and simulation stages and thus requires to be saved. So, the neural module provides the tool to export the trained weight vectors into a file system called Prometheus kohonen data weight vectors (pkdw). These exported files will also contain a set of training vectors, which further strengthens its usability. Figure 14 shows the snapshot of the panel in which the optimized weight vectors of SOM is exported as a pkdw file.
Figure 14.
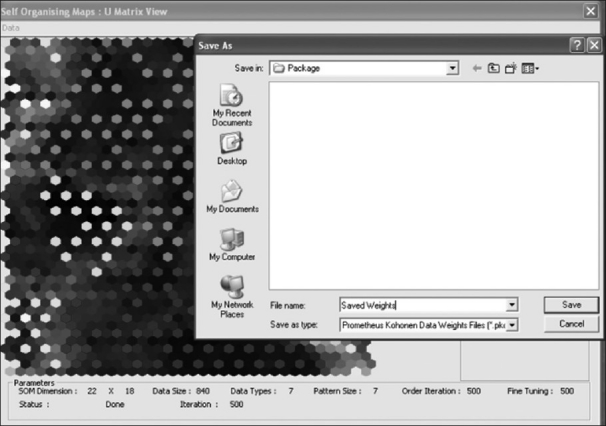
The weight-exporting panel of the neural module
The Prometheus software also provides substantial support for handling the weights that have already been optimized and stored in the pkdw file format. Figure 15 shows a snapshot of the panel in which the pkdw files are being imported in order to use them for a further task. This panel allows the user to view the trained network and also provides the capability train them further if required.
Figure 15.
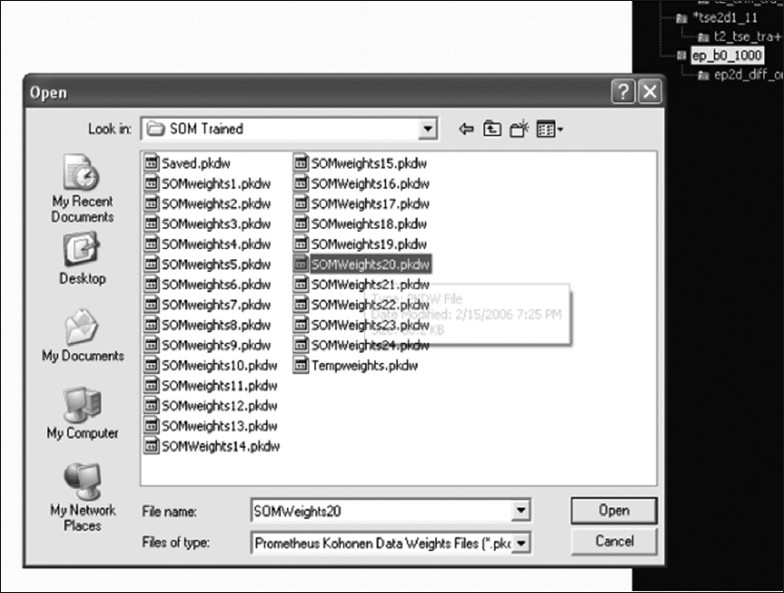
The panel which views pkdw files in the neural module
Brain tumor segmentation task
Modules in Prometheus software can be customized to perform any image-processing and segmentation task by using the neural and image-processing tools. The neural tool can be trained effectively to perform any task, and the trained neural weights can be saved as a ‘pkdw’ file and subsequently used for final segmentation.
One of the works which utilized Prometheus for brain tumor segmentation and grading described clearly in the following text. In this work, MR images of 60 patients who were diagnosed as having brain tumors were acquired. The acquired image set consisted of axial T2, FLAIR, and apparent diffusion coefficient (ADC) images. These images were then preprocessed with the image-processing tools of Prometheus and used for studying the performance of the segmentation algorithm. The detailed methodology of the segmentation algorithm has been described by Vijaykumar et al.[30] The segmentation operation in the neural module provides the support to utilize pre-trained weights vectors of SOM. Figure 16 illustrates the sequence of operations that needs to be carried out using the pkdw files for segmentation operations on the MR images. After opening the trained weight values of the pkdw file, the neural module utilizes the data space for performing the segmentation. The trained neural network is used in the recall mode for segmentation. The user is asked to load the MR images of the patient. These are further automatically preprocessed using registration, standardization, and cranium removal modules. Next, the software generates the feature vector corresponding to the individual pixel. This is fed as input to the trained neural network and the output value indicating class or region to which the pixel belongs is stored. The whole image is scanned pixel by pixel and the outputs generated are used to obtain the segmented image [Figure 16]. The module allows the user to perform the segmentation task on the entire image or within the selected ROI. Figure 17 shows the segmented images of the segmentation technique developed in Prometheus. The segmented image is shown in the left bottom side of the panel. The module also allows the user to export the segmented image as a bitmap (BMP) image. The panel also provides the tools for removing noise from the segmented images.
Figure 16.

The segmentation steps, using pkdw files of the neural package
Figure 17.
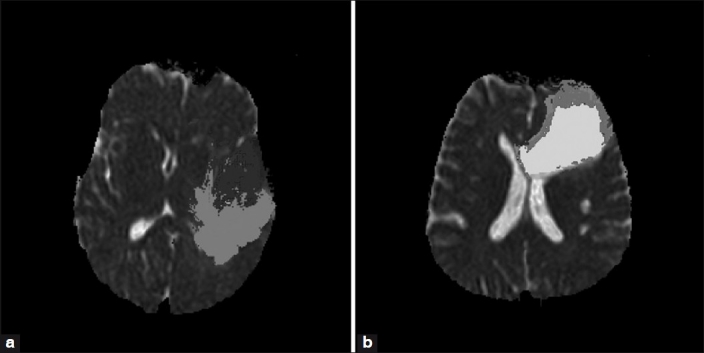
Results of the segmentation technique developed in Prometheus
Evaluation of segmentation
In order to compare the ground truth and segmentation results provided by the image-processing technique developed in Prometheus, evaluation parameters[31–34] such as sensitivity, specificity, segmentation accuracy, and correspondence ratio have been used. These parameters are determined from four different criterion parameters such as true-positive (TP), true-negative (TN), false-positive (FP), and false-negative (FN) values, as follows:
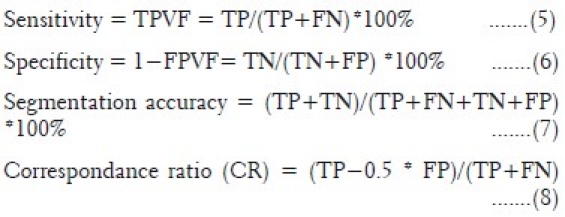
where TPVF and FPVF are true positive volume fraction and false positive volume fraction, respectively.
Prometheus has been used in 60 brain tumor studies and 60 normal studies. These 120 cases were acquired on different MR machines at various hospitals. This validates the ability of the software to handle the variations in images due to different acquisition environments. The image segmentation technique developed for segmenting the tumor, edema, necrosis, CSF, and normal regions provided mean sensitivity and specificity of 85.71±4.89% and 93.2±2.87%, respectively. Similarly, the mean segmentation accuracy and mean correspondence ratio was found to be 92.35±3.37% and 0.78±0.046, respectively.
Conclusion
The Prometheus software consists of a comprehensive set of standard MR image-processing algorithms and graphical tools for processing, analysis, visualization, and algorithm development. The software is equipped with DICOM image standard tools, which allow the user to directly handle the MRI cases and works with all the tools developed. The file-management system of the software is capable of handling different types of MR series simultaneously and does so in the image archive panel. The user-friendly tools, such as region-of-interest tool, pencil marker tool, and distance tool helps in analyzing the MR images and in planning further image processing. The option of loading and viewing all the images corresponding to a particular series by a mouse scrolling operation on the image window allows the clinician to compare the different slices of the tumor with ease.
One key tool of the software is the perfusion module which is capable of reconstructing CBV images from dynamic susceptibility contrast images. This tool is of great use to the clinician for assessing the vascularity of the tumor and associated pathologies such as edema and necrosis. Information on the vascularity of the tumor is required by the clinician for deciding on subsequent surgical management of the patient. The basic image-processing tools and image transform tools helps the user to analyze the images conventionally. The neural network module developed in this software is well equipped with the tools to select the training feature vectors and subsequently use them for training different types of neural network architectures. The module also provides many tools to save and use the trained network architecture for segmentation.
The software also provides a way to integrate the data which are exported in txt file with the specific encoding format by the different software. This allows the user to use the tools provided in the Prometheus software along with any other commercially available software (e.g., MATLAB). This offers a great opportunity for collaboration between various different commercially available packages.
Footnotes
Source of Support: Nil.
Conflict of Interest: None declared.
References
- 1.Udupa JK, Leblanc VR, Zhuge Y, Imielinska C, Schmidt H, Currie LM, et al. A framework for evaluating image segmentation algorithms. Comput Med Imaging Graph. 2006;30:75–87. doi: 10.1016/j.compmedimag.2005.12.001. [DOI] [PubMed] [Google Scholar]
- 2.Wang T, Cheng I, Basu A. Fluid vector flow and applications in brain tumor segmentation. IEEE Trans Biomed Eng. 2009;56:781–9. doi: 10.1109/TBME.2009.2012423. [DOI] [PubMed] [Google Scholar]
- 3.Beyer GP, Velthuizen RP, Murtagh FR, Pearlman JL. Technical aspects and evaluation methodology for the application of two automated brain MRI tumor segmentation methods in radiation therapy planning. Magn Reson Imaging. 2006;24:1167–78. doi: 10.1016/j.mri.2006.07.010. [DOI] [PubMed] [Google Scholar]
- 4.Uwano I, Kameda M, Inoue T, Nishimoto H, Fujiwara S, Hirooka R, et al. Computer-assisted identification of the central sulcus in patients with brain tumors using MRI. J Magn Reson Imaging. 2008;27:1242–9. doi: 10.1002/jmri.21373. [DOI] [PubMed] [Google Scholar]
- 5.Bullitt E, Ewend M, Vredenburgh J, Friedman A, Lin W, Wilber K, et al. Computerized assessment of vessel morphological changes during treatment of glioblastoma multiforme: Report of a case imaged serially by MRA over four years. Neuroimage. 2009;47(Suppl 2):T143–51. doi: 10.1016/j.neuroimage.2008.10.067. [DOI] [PMC free article] [PubMed] [Google Scholar]
- 6.Nie J, Xue Z, Liu T, Young GS, Setayesh K, Guo L, et al. Automated brain tumor segmentation using spatial accuracy-weighted hidden Markov Random Field. Comput Med Imaging Graph. 2009;33:431–41. doi: 10.1016/j.compmedimag.2009.04.006. [DOI] [PMC free article] [PubMed] [Google Scholar]
- 7.Schad LR, Blüml S, Zuna I. MR tissue characterization of intracranial tumors by means of texture analysis. Magn Reson Imaging. 1993;11:889–96. doi: 10.1016/0730-725x(93)90206-s. [DOI] [PubMed] [Google Scholar]
- 8.Kjaer L, Ring P, Thomsen C, Henriksen O. Texture analysis in quantitative MR imaging. Tissue characterisation of normal brain and intracranial tumours at 1.5 T. Acta Radiol. 1995;36:127–35. [PubMed] [Google Scholar]
- 9.Gibbs P, Buckley DL, Blackband SJ, Horsman A. Tumour volume determination from MR images by morphological segmentation. Phys Med Biol. 1996;41:2437–46. doi: 10.1088/0031-9155/41/11/014. [DOI] [PubMed] [Google Scholar]
- 10.Herlidou-Même S, Constans JM, Carsin B, Olivie D, Eliat PA, Nadal-Desbarats L, et al. MRI texture analysis on texture test objects, normal brain and intracranial tumors. Magn Reson Imaging. 2003;21:989–93. doi: 10.1016/s0730-725x(03)00212-1. [DOI] [PubMed] [Google Scholar]
- 11.Zou KH, Wells WM, 3rd, Kikinis R, Warfield SK. Three validation metrics for automated probabilistic image segmentation of brain tumors. Stat Med. 2004;23:1259–82. doi: 10.1002/sim.1723. [DOI] [PMC free article] [PubMed] [Google Scholar]
- 12.Szczypiński PM, Strzelecki M, Materka A, Klepaczko A. MaZda—A software package for image texture analysis. Comput Methods Programs Biomed. 2009;94:66–76. doi: 10.1016/j.cmpb.2008.08.005. [DOI] [PubMed] [Google Scholar]
- 13.Kamalov R, Guillaud M, Haskins D, Harrison A, Kemp R, Chiu D, et al. A Java application for tissue section image analysis. Comput Methods Programs Biomed. 2005;77:99–113. doi: 10.1016/j.cmpb.2004.04.003. [DOI] [PubMed] [Google Scholar]
- 14.Holli K, Lääperi AL, Harrison L, Luukkaala T, Toivonen T, Ryymin P, et al. Characterization of Breast Cancer Types by Texture Analysis of Magnetic Resonance Images. Acad Radiol. 2010;17:135–41. doi: 10.1016/j.acra.2009.08.012. [DOI] [PubMed] [Google Scholar]
- 15.Harrison LC, Raunio M, Holli KK, Luukkaala T, Savio S, Elovaara I, et al. MRI Texture Analysis in Multiple Sclerosis: Toward a Clinical Analysis Protocol. Acad Radiol. 2010;17:696–707. doi: 10.1016/j.acra.2010.01.005. [DOI] [PubMed] [Google Scholar]
- 16.Theodoridis S, Koutroumbas K. Pattern Recognition. 3rd Ed. San Diego: Academic Press; 2006. Clustering Algorithms IV; pp. 653–731. [Google Scholar]
- 17.Earl Cox. Fuzzy Clustering. Fuzzy Modeling and Genetic Algorithms for Data Mining and Exploration. 2005:207–263. [Google Scholar]
- 18.Yardimci A. Soft computing in medicine. Appl Soft Comput. 2009;9:1029–43. [Google Scholar]
- 19.Siegel EL, Reiner BI. Image workflow. In: Dreyer KJ, Mehta A, Thrall JH, editors. PACS: A guide to the digital revolution. New York, NY: Springer; 2002. pp. 161–90. [Google Scholar]
- 20.Clunie DA, Carrino JA. DICOM. In: Dreyer KJ, Mehta A, Thrall JH, editors. PACS: A guide to the digital revolution. New York, NY: Springer; 2002. pp. 73–119. [Google Scholar]
- 21.Clunie DA. DICOM Structured Reporting. Radiology. 2001;220:386. [Google Scholar]
- 22.ACR-NEMA Digital imaging and communications standard. Washington, DC: National Electrical Manufacturers Association; 1985. American College of Radiology, National Electrical Manufacturers Association; p. 300. [Google Scholar]
- 23.Barbier E, Lamalle L, Decorps M. Methodology of brain perfusion imaging. J Magn Reson Imaging. 2001;13:496–520. doi: 10.1002/jmri.1073. [DOI] [PubMed] [Google Scholar]
- 24.Hunsche S, Sauner D, Schreiber W, Oelkers P, Stoeter P. Fair and dynamic susceptibility contrast-enhanced perfusion imaging in healthy subjects and stroke patients. J Magn Reson Imaging. 2002;16:137–46. doi: 10.1002/jmri.10150. [DOI] [PubMed] [Google Scholar]
- 25.Marchevsky AM. Outcome Prediction in Cancer. Amsterdam: Elsevier; 2007. The Use of Artificial Neural Networks for the Diagnosis and Estimation of Prognosis in Cancer Patients; pp. 243–59. [Google Scholar]
- 26.Egmont Petersen M, de Ridder D, Handels H. Image processing with neural networks—a review. Pattern Recognit. 2002;35:2279–301. [Google Scholar]
- 27.Ghosh J. Handbook of Image and Video Processing. 2nd Ed. London: Academic Press; 2005. Adaptive and Neural Methods for Image Segmentation; pp. 519–33. [Google Scholar]
- 28.Wismueller A. Handbook of Medical Image Processing and Analysis. 2nd Ed. London: Academic Press; 2009. Segmentation with Neural Networks; pp. 113–43. [Google Scholar]
- 29.Kohonen T. Springer Series in Information Sciences. 3rd ed. Vol. 30. Heidelberg: Springer Verlag; 2001. Self-Organizing Maps. [Google Scholar]
- 30.Vijayakumar C, Damayanti G, Pant R, Sreedhar CM. Segmentation and grading of brain tumors on apparent diffusion coefficient images using self- organizing maps. Comput Med Imaging Graph. 2007;31:473–84. doi: 10.1016/j.compmedimag.2007.04.004. [DOI] [PubMed] [Google Scholar]
- 31.Nicoll D, Detmer W. Basic Principles of Diagnostic Test Use and Interpretation. New York: McGraw-Hill; 2001. pp. 1–16. Ch. 1. [Google Scholar]
- 32.Chalana V, Kim Y. A methodology for evaluation of boundary detection algorithms on medical images. IEEE Trans Med Imaging. 1997;16:642–52. doi: 10.1109/42.640755. [DOI] [PubMed] [Google Scholar]
- 33.Udupa JK, Leblanc VR, Zhuge Y, Imielinska C, Schmidt H, Currie LM, et al. A framework for evaluating image segmentation algorithms. Comput Med Imaging Graph. 2006;30:75–87. doi: 10.1016/j.compmedimag.2005.12.001. [DOI] [PubMed] [Google Scholar]
- 34.Bowyer K. Validation of medical image analysis techniques. In: Beutel J, Kundel H, Metter Rvan, editors. The Handbook of Medical Imaging. Washington USA: SPIE; 2000. [Google Scholar]