

Abstract
The authors use recent methodology in causal inference to disentangle the direct and indirect effects that operate through a mediator in an exposure-response association paradigm. They demonstrate how total effects can be partitioned into direct and indirect effects even when the exposure and mediator interact. The impact of bias due to unmeasured confounding on the exposure-response association is assessed through a series of sensitivity analyses. These methods are applied to a problem in perinatal epidemiology to examine the extent to which the effect of abruption on perinatal mortality is mediated through preterm delivery. Data on over 26 million US singleton births (1995–2002) were utilized. Risks of mortality among abruption and nonabruption births were 102.7 and 6.2 per 1,000 births, respectively. Risk ratios of the natural direct and indirect (preterm delivery-mediated) effects of abruption on mortality were 10.18 (95% confidence interval: 9.80, 10.58) and 1.35 (95% confidence interval: 1.33, 1.38), respectively. The proportion of increased mortality risk mediated through preterm delivery was 28.1%, with even higher proportions associated with deliveries at earlier gestational ages. Sensitivity analyses underscore that the qualitative conclusions of some mediated effects and substantial direct effects are reasonably robust to unmeasured confounding of a fairly considerable magnitude.
Keywords: abruptio placentae, bias (epidemiology), causal model, gestational age, perinatal mortality
Recent developments in the causal inference literature (1–5) have proposed new methodological approaches to partition the total effect of an exposure on the risk of an outcome into 2 components: one that acts through a mediator (the mediated or indirect effect) and another that acts directly on the outcome through other pathways. This work builds on more conventional approaches to such “mediation analysis” but provides a more general framework. Specifically, approaches from causal inference permit the effects of the exposure and the mediator to interact when conducting mediation analysis. The causal inference literature has also clarified the no-unmeasured-confounding assumptions that are necessary to identify direct and indirect effects. Analyses that attempt to estimate the direct and indirect effects will be biased if there are unmeasured variables that confound the mediator-outcome relation (1, 2, 4, 6, 7). In such settings, sensitivity analysis techniques for direct and indirect effects to evaluate the impact of such mediator-outcome confounding have been developed (4). In this paper, we show an application of these methods to observational studies in the context of perinatal epidemiology.
CASE STUDY IN PERINATAL EPIDEMIOLOGY
In normal pregnancies, placental separation occurs immediately following the birth of the baby, while in pregnancies complicated by abruption, the placental detachment occurs prematurely (8). Placental abruption—often a catastrophic condition—complicates roughly 0.5%–1.5% of pregnancies (9–12) and is associated with increased risks of maternal and perinatal morbidity and mortality (13–16). Women diagnosed with abruption are at 4–6-fold increased risk of delivering at preterm gestations (13). It is believed that release of thrombin because of decidual-placental hemorrhage (17–19) and hemosiderin deposition (8, 20)—both commonly found in the setting of abruption—triggers labor leading to preterm delivery. Abruption is also associated with disproportionately high risk of perinatal death (14, 21, 22). In the United States, for instance, the perinatal mortality rate is 8 per 1,000 singleton births among nonabruption births, whereas in pregnancies complicated by abruption, the rate is at least 15-fold higher (i.e., 120 per 1,000 births) (14).
We focus our exploration of mediating effects relating abruption (exposure) and perinatal mortality (outcome) and of the role preterm delivery (mediator) plays in this relation. We seek to address 2 important issues: 1) Is the increased risk of mortality in relation to abruption entirely dependent (i.e., mediated) on preterm delivery? and 2) If not, what proportion of the increased mortality risk is directly the consequence of abruption through pathways other than preterm delivery? We also illustrate, through a set of sensitivity analyses (4), the bias due to unmeasured confounding for these aforementioned relations. There is little doubt, if any, that preterm delivery is in the causal pathway between abruption and mortality. However, we demonstrate methodologically how one can assess the magnitude of the effect mediated and assess its sensitivity to unmeasured confounding.
COUNTERFACTUAL EFFECT DEFINITIONS
We let X, Y, M, and C denote the exposure, outcome, mediator, and a set of covariates, respectively. Within the counterfactual framework (23, 24), let Yx denote the counterfactual outcome Y if, possibly contrary to fact, X had been set to x (i.e., X = x). The total effect of X on Y for an individual is given by (Y1 − Y0). We define Yxm as the potential outcome Y if, possibly contrary to fact, X = x and M = m. Similarly, we define Mx as the potential outcome M if, possibly contrary to fact, X = x.
Direct and indirect effects in mediation analysis
Robins and Greenland (1) and Pearl (2) provided definitions for direct and indirect effects within the framework of counterfactuals. A controlled direct effect (CDE) on the risk ratio (RR) scale (4, 5) conditional on C = c, comparing X = 1 and X = 0 for some fixed level of M = m, can be defined as
Note that, for a binary mediator, there will be 2 controlled direct effects, one corresponding to when the mediator is set to 1 and the other to when the mediator is set to 0. Although controlled direct effects can be useful for examining whether there are any pathways for the exposure independent of the mediator, they are not useful for effect decomposition, except under very specific conditions when there is no interaction at the individual level between the effects of the exposure and mediator (25). In general, there is nothing that can be defined as a controlled indirect effect (25, 26); instead, for purposes of effect decomposition within the counterfactual framework, natural direct and indirect effects are of more use. The risk ratio for the natural direct effect (RRNDE) is defined by
that is, the effect of the exposure if the mediator were set to what it would have been without the exposure. The risk ratio for the natural indirect effect (RRNIE) can be defined as
that is, the effect on the outcome when the exposure is present after setting the mediator value to what it would have been with versus without the exposure.
In our application, the natural direct effect risk ratio, RRNDE, compares the mortality risk between those with versus without abruption if, in both cases, delivery were delayed to the preterm delivery status that would have occurred without abruption. The natural indirect effect risk ratio, RRNIE, provides an assessment, among abruption births, of the mortality risk if we were able versus unable to delay delivery to what it would have been without abruption.
MEDIATION ANALYSIS
The mediation analysis requires several no-unmeasured-confounding assumptions. Specifically, we assume that the set of covariates for which adjustment is made suffices to control for confounding of the 1) exposure-outcome; 2) mediator-outcome; and 3) exposure-mediator relations. We further assume that there is no effect of exposure that confounds the mediator-outcome relation. We pursue a sensitivity analysis to assess the robustness of our conclusions to violations of these assumptions.
We use methods for mediation analysis for a dichotomous outcome (5). These methods were developed for use within the framework of logistic regression and a rare outcome, but they are also applicable to common outcomes when using log-linear models (log-binomial regression models to directly estimate risk ratios (27)). The formulas given for a dichotomous outcome were for the setting of a continuous mediator (5) but can be adapted to include a dichotomous mediator; we report these formulas here. Derivations for the expressions for a dichotomous mediator are provided elsewhere (28).
In our application, the natural direct and indirect effects of the abruption-mortality relation were estimated from fitting a model for mortality (Y), conditional on abruption (X), preterm delivery (M), an abruption-preterm delivery interaction (X × M), and a set of confounders (C):
and a model for preterm delivery (M), conditional on abruption (X) and a set of confounders (C):
From these combined models, we can estimate risk ratios of controlled direct effect, RRCDE, natural direct effects, RRNDE, and natural indirect effects, RRNIE, for a dichotomous exposure using the following expressions:
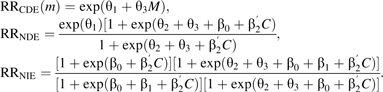 |
Valeri and VanderWeele (28) provide more general expressions. Because RRNIE compares a change of delivery (timing of delivery with abruption vs. timing of delivery without abruption) among those with abruption, the baseline mortality risk will be quite high and, thus, small rate ratios may indicate large changes in absolute risk.
Standard errors for these expressions can be obtained by either bootstrapping or using the delta method. Expressions for standard errors using the delta method are provided in the Web Appendix, which is posted on the Journal’s Web site (http://aje.oxfordjournals.org/), and derivations for these expressions are provided elsewhere (28).
The proportion of the increased abruption-mortality association that is mediated through preterm delivery was computed, on the risk difference scale, as (5)
This measure provides a relative assessment of the extent to which the increased mortality risk following abruption is mediated through preterm delivery relative to the overall effect of placental abruption.
SENSITIVITY ANALYSIS FOR MEDIATION EFFECTS
In order to test the impact of potential unmeasured confounders on the direct and indirect effects of the abruption-mortality relation, we performed a series of sensitivity analyses (4). It is especially likely that the assumption of “no unmeasured confounding” for the mediator-outcome relation is violated; that is, there are common causes of preterm delivery and mortality for which we have not adjusted. Our sensitivity analysis is thus focused on this form of unmeasured confounding.
We note that it is also possible that there are unmeasured confounders that affect both the exposure and the mediator. Despite control for a number of confounders, there is the possibility that a different set of factors (e.g., chorioamnionitis) may be associated with an increased risk of abruption (29, 30) and might also cause preterm delivery. In this case study, we focus our attention on the mediator-outcome unmeasured confounding scenario only.
We consider a binary unmeasured confounding variable U indicating a common cause of preterm delivery (e.g., preeclampsia or intrauterine infection (31, 32)) and mortality. The group of pregnancies with preterm delivery but without abruption is likely to have a higher prevalence of U because some factor other than abruption will be responsible for such preterm deliveries.
The sensitivity analysis was performed with the following general assumptions: that the prevalence of U among term pregnancies was 5% with and without abruption and that the prevalence of U was 10% among preterm deliveries with abruption but 50% among preterm deliveries without abruption. On the basis of these assumptions, we estimated the impact of unmeasured confounding under 2 distinct scenarios: 1) moderate confounding, where we consider how the results would change if U increased the likelihood of mortality by a factor of 1.5 (i.e., RRU = 1.5); and 2) substantial confounding, where we consider how the results would change if U increased the likelihood of mortality by a factor of 6 (i.e., RRU = 6.0).
MATERIALS AND METHODS
We utilized data on fetal deaths and linked livebirths-infant death data files between 1995 and 2002 in the United States (33). We used the clinical estimate of gestational age for all analyses (34), which is deemed more reliable and superior to the menstrual estimate (35, 36).
Placental abruption and perinatal mortality
A recording of placental abruption for both livebirths and stillbirths was made by using a check-box format by the physician/attendant at delivery (33). We defined preterm delivery as gestational age between 22 and 36 completed weeks. We examined risks of stillbirth and early (0–6 days) and late (7–27 days) neonatal mortality in relation to abruption. Further, because abruption is largely a condition that occurs (or is diagnosed) during labor, timely obstetric interventions may prevent the fetus from dying in utero, but such babies may die soon after birth. Thus, we also examined perinatal mortality defined as stillbirths plus early neonatal deaths.
Confounders
The confounders considered for adjustment in the analyses included maternal age (<20, 20–24, 25–29, 30–34, 35–39, and ≥40 years), liveborn parity (parity = 1, parity = 2, and parity ≥ 3), maternal race (white, black, and other races, irrespective of Hispanic ethnicity), marital status (married or single), smoking during pregnancy (smoker or nonsmoker), and chronic hypertension.
Additional gestational age categorizations
To further explore the relation among abruption, preterm delivery, and mortality, we conducted a set of analyses to assess the importance of severity of preterm delivery, categorized as <28, 28–31, 32–33, and 34–36 weeks. We estimated the effect on mortality of randomizing an individual with abruption to a particular gestational age category or to ≥37 weeks with probability equal to that in the population conditional on covariates and abruption status (comparing abruption vs. no abruption). This is the effect through gestational age. We also estimated the direct effect comparing abruption versus no abruption with gestational age in both cases randomized to a particular preterm gestational age category or to ≥37 weeks with probability equal to that in the population conditional on covariates and no abruption. Details of this methodology are provided in the Web Appendix.
Cohort composition
During the 8-year period from 1995 to 2002, there were 31,426,986 singleton births in the United States. Of these, we excluded, sequentially, births at <22 weeks (n = 331,143) and at ≥43 weeks (n = 23,995) of gestation or missing gestational age (n = 4,427,666, which included births from the state of California, since California does not report data on the clinical estimate of gestational age). In addition, we further excluded missing data on placental abruption (n = 279,720). After all exclusions, 26,364,462 singleton births delivered at ≥22 weeks remained for analysis.
RESULTS
Placental abruption was recorded in 170,068 (0.65%) singleton births. The distribution of sociodemographic factors and the rates of abruption in relation to these risk factors are shown in Table 1. Perinatal mortality rates among abruption and nonabruption births were 102.7 and 6.2 per 1,000 births, respectively. The unadjusted and gestational age-adjusted risk ratios for perinatal mortality in relation to abruption were 18.89 (95% confidence interval: 18.55, 19.22) and 4.79 (95% confidence interval: 4.70, 4.89). Gestational age-specific perinatal mortality rates were similar between abruption and nonabruption births at <28 weeks but began to diverge thereafter (Figure 1). In proceeding with the estimation of the natural direct and indirect effects of abruption on mortality through preterm delivery or other pathways, we conceptualized the hypothesized pathways and the role of observed and unobserved confounding as indicated in the directed acyclic graph in Figure 2.
Table 1.
Distribution of Maternal Risk Factors for Placental Abruption, US Singleton Births, 1995–2002
| Maternal Risk Factors | Total Singleton Births |
Placental Abruption |
||
| No. | % | No. | % | |
| All births | 26,364,462 | 100.0 | 170,068 | 0.65 |
| Maternal age, years | ||||
| <20 | 3,304,690 | 12.5 | 21,728 | 0.66 |
| 20–24 | 6,656,637 | 25.3 | 41,629 | 0.63 |
| 25–29 | 7,155,671 | 27.1 | 42,607 | 0.60 |
| 30–34 | 5,984,102 | 22.7 | 37,951 | 0.63 |
| 35–39 | 2,728,612 | 10.4 | 20,959 | 0.77 |
| ≥40 | 534,750 | 2.0 | 5,194 | 0.97 |
| Liveborn parity | ||||
| Parity 1 | 8,750,861 | 33.4 | 48,315 | 0.55 |
| Parity 2 | 7,688,703 | 29.3 | 43,642 | 0.57 |
| Parity ≥3 | 9,771,574 | 37.3 | 76,869 | 0.79 |
| Maternal race | ||||
| Whites | 20,752,745 | 78.7 | 127,076 | 0.61 |
| Blacks | 4,397,560 | 16.7 | 35,627 | 0.81 |
| Others | 1,214,157 | 4.6 | 7,365 | 0.61 |
| Marital status | ||||
| Single | 8,762,949 | 33.3 | 66,218 | 0.76 |
| Married | 17,580,302 | 66.7 | 101,747 | 0.58 |
| Maternal smoking | ||||
| Smoker | 3,238,682 | 12.8 | 36,984 | 1.14 |
| Nonsmoker | 22,075,056 | 87.2 | 124,423 | 0.56 |
| Chronic hypertension | ||||
| Present | 211,738 | 0.8 | 3,473 | 1.64 |
| Absent | 26,016,353 | 99.2 | 164,790 | 0.63 |
| Gestational age, weeks | ||||
| ≥37 | 24,133,881 | 91.8 | 81,393 | 0.34 |
| <37 | 2,155,517 | 8.2 | 82,791 | 3.84 |
| 34–36 | 1,542,757 | 5.9 | 35,613 | 2.31 |
| 32–33 | 246,423 | 0.9 | 14,713 | 5.97 |
| 28–31 | 219,336 | 0.8 | 18,121 | 8.26 |
| <28 | 222,065 | 0.8 | 20,228 | 9.11 |
Figure 1.

Gestational age-specific risk of perinatal mortality (per 1,000 births) among abruption and nonabruption births and risk ratio of mortality between placental abruption and nonabruption births, US singleton births, 1995–2002.
Figure 2.

Directed acyclic graph showing the relation between placental abruption (X) and perinatal mortality (Y) with preterm delivery as the intermediary (mediating) covariate (M), US singleton births, 1995–2002. “C” is a set of confounders observed at baseline (common causes for placental abruption, preterm delivery, and perinatal mortality), and “U” is a set of unobserved confounders. We represent the relation between X and U as a dashed line because we do not consider this confounding scenario; consequently, our sensitivity analysis assumes that this pathway does not exist, and that we believe this confounding is weak in comparison.
Mediation analysis
We partitioned the total effect of the abruption-mortality association into natural direct and indirect effects mediated through preterm delivery (Table 2). The abruption-mortality risk ratios were stronger for natural direct effects than indirect effects, with roughly one fourth (24.1%) of the excess number of stillbirths due to abruption mediated through preterm delivery. The proportion of excess early and late neonatal deaths and the perinatal deaths following abruption that were mediated through preterm delivery were estimated to be 42.5%, 53.1%, and 28.1%, respectively.
Table 2.
Estimates of Direct and Indirect Effects (Mediated Through Preterm Delivery at <37 Weeks) of the Association Between Placental Abruption and Mortality Risk and the Proportion of Mortality Due to Abruption That is Mediated Through Preterm Delivery, US Singleton Births, 1995–2002ab
| Perinatal Mortality | Adjusted Risk Ratio |
Mortality Proportion Mediated Through Preterm Delivery, % | |||||
| Natural Direct Effect |
Natural Indirect Effect |
Total Effect |
|||||
| RRNDE | 95% CI | RRNIE | 95% CI | RR | 95% CI | ||
| Stillbirth | 13.07 | 12.49, 13.68 | 1.29 | 1.27, 1.32 | 16.91 | 16.45, 17.36 | 24.1 |
| Early neonatal mortality | 5.59 | 5.19, 6.02 | 1.61 | 1.55, 1.67 | 8.98 | 8.58, 9.37 | 42.5 |
| Late neonatal mortality | 3.28 | 2.90, 3.71 | 1.79 | 1.67, 1.91 | 5.86 | 5.44, 6.28 | 53.1 |
| Perinatal mortality | 10.18 | 9.80, 10.58 | 1.35 | 1.33, 1.38 | 13.76 | 13.45, 14.08 | 28.1 |
Abbreviations: CI, confidence interval; RR, risk ratio.
Risk ratios were adjusted for maternal age, liveborn parity, marital status, maternal race, smoking during pregnancy, and chronic hypertension through log-binomial regression models.
Mortality proportions mediated through preterm delivery were estimated as follows: (RRNDE × (RRNIE −1)/(RRNDE × RRNIE −1)), where RRNDE and RRNIE refer to the corresponding risk ratios for natural direct effect and natural indirect effect, respectively.
The results of analyses with finer categorizations of preterm gestational age are reported in Table 3. In general, the proportion of abruption-mortality association that was through preterm delivery increased as gestational age at birth diminished, with this proportion reaching 76.5% for deliveries at <28 weeks for early neonatal mortality and 79.7% for late neonatal mortality.
Table 3.
Estimates of Direct Effect and Effect Mediated Through Severity of Preterm Delivery of the Association Between Placental Abruption and Mortality Risk and the Proportion of Mortality Due to Abruption That Is Mediated Through Preterm Delivery, US Singleton Births, 1995–2002ab
| Mediator: Gestational Age, weeks | Direct Effect |
Effect Through Preterm Delivery |
Total Effect |
Mortality Proportion Mediated Through Preterm Delivery, % | |||
| RRNDE | 95% CI | RRNIE | 95% CI | RR | 95% CI | ||
| Stillbirth | |||||||
| 34–36 | 22.30 | 21.19, 23.48 | 1.16 | 1.14, 1.18 | 25.88 | 24.99, 26.78 | 14.4 |
| 32–33 | 24.24 | 22.87, 25.69 | 1.19 | 1.16, 1.21 | 28.80 | 27.70, 29.90 | 16.4 |
| 28–31 | 20.30 | 19.21, 21.46 | 1.22 | 1.20, 1.24 | 24.84 | 23.93, 25.75 | 19.0 |
| <28 | 14.53 | 13.57, 15.32 | 1.44 | 1.40, 1.47 | 20.89 | 20.21, 21.57 | 32.0 |
| Early neonatal mortality (0–6 days) | |||||||
| 34–36 | 8.47 | 7.68, 9.35 | 1.06 | 1.03, 1.09 | 9.07 | 8.36, 9.79 | 7.5 |
| 32–33 | 9.31 | 8.37, 10.36 | 1.15 | 1.11, 1.19 | 10.71 | 9.83, 11.59 | 14.4 |
| 28–31 | 8.08 | 7.29, 8.95 | 1.35 | 1.29, 1.41 | 10.94 | 10.16, 11.73 | 28.8 |
| <28 | 4.27 | 3.90, 4.66 | 3.49 | 3.26, 3.74 | 14.89 | 14.35, 15.43 | 76.5 |
| Late neonatal mortality (7–27 days) | |||||||
| 34–36 | 3.50 | 2.93, 4.18 | 1.09 | 1.03, 1.15 | 3.81 | 3.25, 4.36 | 10.9 |
| 32–33 | 3.68 | 3.02, 4.47 | 1.16 | 1.09, 1.24 | 4.27 | 3.62, 4.93 | 18.2 |
| 28–31 | 3.44 | 2.86, 4.13 | 1.50 | 1.37, 1.64 | 5.16 | 4.52, 5.80 | 41.4 |
| <28 | 2.78 | 2.37, 3.27 | 3.52 | 3.10, 3.99 | 9.78 | 9.07, 10.48 | 79.7 |
| Perinatal mortality (stillbirth plus early neonatal mortality) | |||||||
| 34–36 | 17.20 | 16.46, 17.98 | 1.14 | 1.12, 1.15 | 19.72 | 19.11, 20.34 | 13.5 |
| 32–33 | 16.67 | 17.76, 19.62 | 1.18 | 1.16, 1.20 | 22.06 | 21.31, 22.82 | 16.1 |
| 28–31 | 15.86 | 15.12, 16.64 | 1.24 | 1.22, 1.26 | 19.73 | 19.09, 20.37 | 20.6 |
| <28 | 10.18 | 9.73, 10.65 | 1.79 | 1.74, 1.84 | 18.22 | 17.77, 18.67 | 46.7 |
Abbreviations: CI, confidence interval; RR, risk ratio.
Risk ratios were adjusted for maternal age, liveborn parity, marital status, maternal race, smoking during pregnancy, and chronic hypertension through log-binomial regression models.
Mortality proportions mediated through preterm gestational ages were estimated as follows: (RRNDE × (RRNIE −1)/(RRNDE × RRNIE −1)), where RRNDE and RRNIE refer to the corresponding risk ratios for natural direct effect and natural indirect effect, respectively.
Sensitivity analysis for unobserved confounding
The results of the sensitivity analysis for unmeasured common causes of preterm delivery and mortality are shown in Table 4. The first set of columns in Table 4 presents the estimates of the natural direct and indirect effects and proportion mediated (from Table 2) assuming no unmeasured confounding (RRU = 1.0). The second and third sets of columns present how these estimates would be changed under the moderate (RRU = 1.5) and substantial (RRU = 6.0) unmeasured confounding scenarios, respectively.
Table 4.
Sensitivity Analysis of the Impact of Unmeasured Moderate and Substantial Confounding, With Estimates of Natural Direct and Indirect Effects Mediated Through Preterm Delivery of the Association Between Abruption and Mortality Risk and the Proportion of Mortality Due to Placental Abruption That Is Mediated Through Preterm Delivery, US Singleton Births, 1995–2002abc
| Perinatal Mortality | Observed Analysis (No Unmeasured Confounding) |
Moderate Unmeasured Confounding (RRU = 1.5) |
Severe Unmeasured Confounding (RRU = 6.0) |
||||||
| RRNDE | RRNIE | RRNDE | RRNIE | RRNDE | RRNIE | ||||
| Stillbirth | 13.07 | 1.29 | 24.1 | 14.70 | 1.28 | 23.4 | 21.44 | 1.23 | 19.2 |
| Early neonatal mortality | 5.59 | 1.61 | 42.5 | 6.28 | 1.59 | 41.4 | 9.07 | 1.51 | 36.4 |
| Late neonatal mortality | 3.28 | 1.79 | 53.1 | 3.56 | 1.77 | 51.8 | 4.45 | 1.68 | 46.7 |
| Perinatal mortality | 10.18 | 1.35 | 28.1 | 11.45 | 1.34 | 27.2 | 16.68 | 1.28 | 22.8 |
Abbreviations: CI, confidence interval; RR, risk ratio.
Risk ratios were adjusted for maternal age, liveborn parity, marital status, maternal race, smoking during pregnancy, and chronic hypertension through log-binomial regression models.
RRU denotes the effect if unmeasured confounding increased the likelihood of the mortality outcome by a factor of 1.5 or 6.0.
Mortality proportions mediated through preterm delivery () were estimated as follows: (RRNDE × (RRNIE −1)/(RRNDE × RRNIE −1)), where RRNDE and RRNIE refer to the corresponding risk ratios for natural direct effect and effect mediated through preterm delivery, respectively.
For each mortality scenario, the natural direct effect was higher, and both the natural indirect effect and the proportion mediated were somewhat lower. This is because, without controlling for common causes of preterm delivery and mortality, the measure of gestational age not only captures the effects of gestational age, per se, but also serves as a proxy for common causes of preterm delivery and mortality. Nevertheless, even under the substantial unmeasured confounding scenario, it appears that a considerable portion of the effect of abruption on mortality is not mediated by preterm delivery. Sensitivity analysis for the abruption-mortality association based on finer categorizations of preterm deliveries yielded results similar to those shown for all preterm deliveries (refer to Web Appendix Table 1).
The results for controlled direct effects when the mediator (preterm delivery) is absent (RRCDE(0)) and present (RRCDE(1)) are shown in Table 5. We consider 3 scenarios: no unmeasured confounding (RRU = 1.0), moderate confounding (RRU = 1.5), and substantial confounding (RRU = 6.0). Note that the controlled direct effect risk ratio when preterm delivery is set to 0 is not entirely comparable to that when preterm delivery is set to 1, because the baseline risk of mortality is much higher at preterm than at term gestations. Under the simplifying assumptions that the prevalence of U among term deliveries was 5% both with and without abruption, the controlled direct effect at term (i.e., mediator absent) is unaffected. However, this would change if the prevalence of U among term pregnancies were assumed to be different with and without abruption. Unmeasured confounding biases the direct effect estimates downward (corrected estimates are higher than the original estimates) and, thus, there is strong evidence for controlled direct effects.
Table 5.
Sensitivity Analysis for Controlled Direct Effects Under Unmeasured Moderate and Substantial Confounding, US Singleton Births, 1995–2002a
| Perinatal Mortality | Observed Analysis (No Unmeasured Confounding) |
Moderate Unmeasured Confounding (RRU = 1.5) |
Severe Unmeasured Confounding (RRU = 6.0) |
|||||||||
| Preterm = No |
Preterm = Yes |
Preterm = Nob |
Preterm = Yes |
Preterm = Nob |
Preterm = Yes |
|||||||
| RRCDE | 95% CI | RRCDE | 95% CI | RRCDE | 95% CI | RRCDE | 95% CI | RRCDE | 95% CI | RRCDE | 95% CI | |
| Stillbirth | 29.31 | 27.98, 30.70 | 3.81 | 3.51, 4.14 | 29.31 | 27.98, 30.70 | 4.54 | 4.18, 4.92 | 29.31 | 27.98, 30.70 | 9.23 | 8.51, 10.02 |
| Early neonatal | 10.94 | 9.93, 12.06 | 2.65 | 2.40, 2.92 | 10.94 | 9.93, 12.06 | 3.15 | 2.86, 3.48 | 10.94 | 9.93, 12.06 | 6.41 | 5.81, 7.08 |
| Late neonatal | 3.95 | 3.29, 4.75 | 2.56 | 2.13, 3.08 | 3.95 | 3.29, 4.75 | 3.05 | 2.53, 3.67 | 3.95 | 3.29, 4.75 | 6.20 | 5.15, 7.45 |
| Perinatal mortality | 22.31 | 21.41, 23.26 | 3.32 | 3.18, 3.46 | 22.31 | 21.41, 23.26 | 3.95 | 3.18, 3.46 | 22.31 | 21.41, 23.26 | 8.04 | 7.70, 8.39 |
Abbreviations: CI, confidence interval; RRCDE, the adjusted risk ratio for controlled direct effects; RU, the effect if unmeasured confounding increased the likelihood of the mortality outcome by a factor of 1.5 or 6.
Risk ratios were adjusted for maternal age, liveborn parity, marital status, maternal race, smoking during pregnancy, and chronic hypertension through log-binomial regression models.
Under the simplifying assumptions that the prevalence of U among term deliveries was 5% both with and without abruption, the controlled direct effect at term (i.e., mediator absent) is unaffected. Note, however, that this would change if the prevalence of U among term pregnancies were assumed to be different with and without abruption.
DISCUSSION
In this paper, we have applied novel methodology to disentangle direct and indirect effects within a causal framework. The analyses demonstrate how total effects can be partitioned into direct and indirect effects even when the exposure and mediator interact in their effects on the outcome (as they did in our application.) We also note how unmeasured confounding can bias estimates and showed how sensitivity analysis could be used to assess the robustness of such direct and indirect effect estimates to such bias. The 2 issues of exposure-mediator interaction and unmeasured confounding have been a major limitation of traditional approaches to estimating direct and indirect effects, but they can be addressed to a certain extent by using recent methodological developments in the causal inference literature (1–5).
The mediation analysis reveals several important insights regarding the role gestational age and early delivery play on the association between abruption and perinatal mortality. The findings suggest that early delivery is not the primary mediator through which abruption is associated with increased mortality risk; roughly, only one fourth (24.1%) of stillbirths attributable to abruption are mediated through preterm delivery. These data also show that the mortality proportion that is mediated through preterm gestations shows a gradual increase with deliveries occurring at earlier gestational ages, reaching 76.5% for early and 79.7% for neonatal deaths at <28 weeks of gestation. Unobserved confounding may have altered the magnitude of these effects (biasing mediated effects upward and direct effects downward), but the qualitative conclusions of the presence of some mediated effect and a fairly substantial direct effect are reasonably robust to unmeasured confounding of a fairly considerable magnitude.
Methodology on mediation effects: controlled versus natural direct effects
The analysis here allows us to contrast the use and interpretation of controlled direct effects versus natural direct and indirect effects. Estimates of controlled direct effects permit an assessment of the effect of abruption on mortality other than through preterm delivery. However, controlled direct effects cannot be used for effect decomposition when there are interactions between the exposure and the mediator in their effects on the outcome as in this study. In order to decompose the total effect into a direct and indirect effect so as to examine the “proportion mediated,” natural direct and indirect effects can be used. These were used in this study to assess the proportion mediated. Using this approach, we were able to see not only that there were pathways for the effects of abruption not through preterm delivery but also that these other pathways generally accounted for a majority of the effect.
Placental abruption and perinatal mortality: a role for preterm delivery?
Preterm delivery lies in the causal pathway between abruption and perinatal mortality, and this finding is unequivocal. However, our application of methods for mediation analysis uncovers 2 new insights: 1) the analyses’ provision of a quantitative assessment of the extent of mediation effects by partitioning the total effect to the corresponding natural direct and indirect effects; and 2) the role that unmeasured confounding plays in these associations.
The analyses raise an interesting substantive question. The direct effect of abruption on increased mortality accounts in most cases for a majority of the total effect. It is likely that one major pathway involves fetal hypoxia when oxygen transport is either diminished in cases of marginal abruption or completely ceased in the setting of total abruption. Because abruption is largely a chronic process with origins extending to the stages of placental implantation (14), an interesting counterfactual would be to estimate what the mortality would have been if the abnormal placenta had not prematurely abrupted. Unfortunately, limitations of the data preclude an exploration of this pathway, but these analyses suggest that it is not early delivery alone that is driving the increased perinatal mortality risk.
Placental abruption is a complex obstetric complication resulting from 2 distinct processes: abnormal placentation and premature placental detachment (37). Abruption bears a strong chronic underpinning, and roughly only one fifth of all abruption cases are of acute onset (e.g., abdominal trauma) (37, 38). Although both abnormal placentation and premature placental separation increase the risk of preterm delivery, our findings indicate that these processes contribute to the risk for perinatal mortality through different mechanisms. In fact, the extent to which gestational age-mediated effects of the abruption-mortality relation would depend on preterm deliveries that occur spontaneously versus those that are subjected to obstetric interventions may be a target worthy of investigation.
Limitations of the data
Some degree of misclassification of both abruption and gestational age is likely. There are no established benchmarks for diagnosis of abruption, and obstetricians often rely on clinical observations such as retroplacental hematoma, painful bleeding, tetanic uterine contractions, and fetal distress as being indicative of abruption. Although these findings portend very high specificity for ruling out a diagnosis, the sensitivity of these markers remains imperfect (39). The misclassification is also likely differential; for example, recording a diagnosis is higher in the setting of stillbirths than in livebirths or at late preterm gestations than at term. This may have exaggerated the effect sizes in this and other studies to some extent; both the natural direct and indirect effect estimates might be biased upward. We have used the clinical estimate of gestational age that is more reliable and superior to the menstrual estimate (35, 36). Nevertheless, some misclassification in this variable likely remains; a misclassified mediator is likely to result in an upward bias for the natural direct effect and a downward bias for the natural indirect effect.
Another limitation pertains to the temporal sequence of events relating placental abruption and mortality, especially whether a stillbirth followed abruption or if stillbirth preceded an abruption. The latter scenario is highly unlikely because stillbirths are often due to lack of gas exchange, reduced blood flow, and uteroplacental underperfusion, all of which are the consequence of abruption. This is strongly supported by clinical observations of abruption cases in the presence of a live fetus, where there is evidence of fetal heart rate abnormalities leading to fetal distress first and then to disseminated intravascular coagulation in later stages. In such cases, obstetric intervention by cesarean delivery has shown that the separation of the placenta with subplacental blood collection precedes fetal death (20).
Ideally, we would have preferred to examine gestational age as a continuous variable and its role as a mediator. Unfortunately, many of the log-binomial regression models failed to converge owing to issues of boundary restrictions in predicted probabilities (27), so we resorted to dichotomization and to examining severity of preterm delivery. Our overall estimates of the proportion mediated are thus likely somewhat biased downward. This bias is, however, probably in the opposite direction to that due to unobserved confounding of the gestational age-mortality relation, as indicated in our sensitivity analysis.
Conclusions
In this paper, we provide an illustration of how recent methodology can be applied in mediation analysis for disentangling direct and indirect effects. The use of such techniques is important when a variable of interest potentially lies on the pathway between the exposure and the outcome. As has been noted before (40–42), such a factor should not, in general, be adjusted in the analysis of total effects. However, when handled appropriately, such intermediates permit inferences regarding direct and indirect effects. Here, we have shown that, although preterm delivery plays an important role in mediating the effect of placental abruption on perinatal mortality, there are yet other undiscovered pathways implicated in these associations that may have effects stronger than gestational age, per se.
Supplementary Material
Acknowledgments
Author affiliations: Division of Epidemiology and Biostatistics, Department of Obstetrics, Gynecology, and Reproductive Sciences, University of Medicine and Dentistry of New Jersey-Robert Wood Johnson Medical School, New Brunswick, New Jersey (Cande V. Ananth); and Departments of Epidemiology and of Biostatistics, Harvard School of Public Health, Boston, Massachusetts (Tyler J. VanderWeele).
T. J. V. was supported through a grant (HD060696) from the National Institutes of Health.
The authors are grateful to Dr. Joaquin Santolaya-Forgas, Dr. Anthony M. Vintzileos, and Dr. Michelle A. Williams for their insightful comments and discussions that helped to improve the manuscript.
Conflict of interest: none declared.
Glossary
Abbreviation
- RR
risk ratio
References
- 1.Robins JM, Greenland S. Identifiability and exchangeability for direct and indirect effects. Epidemiology. 1992;3(2):143–155. doi: 10.1097/00001648-199203000-00013. [DOI] [PubMed] [Google Scholar]
- 2.Pearl J. Direct and indirect effects. In: Breese JS, Koller D, editors. Proceedings of the 17th Conference in Uncertainty in Artificial Intelligence. San Francisco, CA: Morgan Kaufmann Publishers, Inc; 2001. pp. 411–420. [Google Scholar]
- 3.VanderWeele TJ, Vansteelandt S. Conceptual issues concerning mediation, interventions and composition. Stat Interface—Spec Issue Mental Health Soc Behav Sci. 2009;2:457–468. [Google Scholar]
- 4.VanderWeele TJ. Bias formulas for sensitivity analysis for direct and indirect effects. Epidemiology. 2010;21(4):540–551. doi: 10.1097/EDE.0b013e3181df191c. [DOI] [PMC free article] [PubMed] [Google Scholar]
- 5.Vanderweele TJ, Vansteelandt S. Odds ratios for mediation analysis for a dichotomous outcome. Am J Epidemiol. 2010;172(12):1339–1348. doi: 10.1093/aje/kwq332. [DOI] [PMC free article] [PubMed] [Google Scholar]
- 6.Judd CM, Kenny DA. Process analysis: estimating mediation in treatment evaluations. Eval Rev. 1981;5(6):602–619. [Google Scholar]
- 7.Cole SR, Hernán MA. Fallibility in estimating direct effects. Int J Epidemiol. 2002;31(1):163–165. doi: 10.1093/ije/31.1.163. [DOI] [PubMed] [Google Scholar]
- 8.Oyelese Y, Ananth CV. Placental abruption. Obstet Gynecol. 2006;108(4):1005–1016. doi: 10.1097/01.AOG.0000239439.04364.9a. [DOI] [PubMed] [Google Scholar]
- 9.Ananth CV, Savitz DA, Williams MA. Placental abruption and its association with hypertension and prolonged rupture of membranes: a methodologic review and meta-analysis. Obstet Gynecol. 1996;88(2):309–318. doi: 10.1016/0029-7844(96)00088-9. [DOI] [PubMed] [Google Scholar]
- 10.Rasmussen S, Irgens LM, Bergsjo P, et al. The occurrence of placental abruption in Norway 1967–1991. Acta Obstet Gynecol Scand. 1996;75(3):222–228. doi: 10.3109/00016349609047091. [DOI] [PubMed] [Google Scholar]
- 11.Ananth CV, Smulian JC, Demissie K, et al. Placental abruption among singleton and twin births in the United States: risk factor profiles. Am J Epidemiol. 2001;153(8):771–778. doi: 10.1093/aje/153.8.771. [DOI] [PubMed] [Google Scholar]
- 12.Ananth CV, Oyelese Y, Yeo L, et al. Placental abruption in the United States, 1979 through 2001: temporal trends and potential determinants. Am J Obstet Gynecol. 2005;192(1):191–198. doi: 10.1016/j.ajog.2004.05.087. [DOI] [PubMed] [Google Scholar]
- 13.Ananth CV, Berkowitz GS, Savitz DA, et al. Placental abruption and adverse perinatal outcomes. JAMA. 1999;282(17):1646–1651. doi: 10.1001/jama.282.17.1646. [DOI] [PubMed] [Google Scholar]
- 14.Ananth CV, Wilcox AJ. Placental abruption and perinatal mortality in the United States. Am J Epidemiol. 2001;153(4):332–337. doi: 10.1093/aje/153.4.332. [DOI] [PubMed] [Google Scholar]
- 15.Rasmussen S, Irgens LM, Bergsjo P, et al. Perinatal mortality and case fatality after placental abruption in Norway 1967–1991. Acta Obstet Gynecol Scand. 1996;75(3):229–234. doi: 10.3109/00016349609047092. [DOI] [PubMed] [Google Scholar]
- 16.Raymond EG, Mills JL. Placental abruption. Maternal risk factors and associated fetal conditions. Acta Obstet Gynecol Scand. 1993;72(8):633–639. doi: 10.3109/00016349309021156. [DOI] [PubMed] [Google Scholar]
- 17.Rosen T, Schatz F, Kuczynski E, et al. Thrombin-enhanced matrix metalloproteinase-1 expression: a mechanism linking placental abruption with premature rupture of the membranes. J Matern Fetal Neonatal Med. 2002;11(1):11–17. doi: 10.1080/jmf.11.1.11.17. [DOI] [PubMed] [Google Scholar]
- 18.Gargano JW, Holzman CB, Senagore PK, et al. Evidence of placental haemorrhage and preterm delivery. BJOG. 2010;117(4):445–455. doi: 10.1111/j.1471-0528.2009.02472.x. [DOI] [PMC free article] [PubMed] [Google Scholar]
- 19.Salafia CM, López-Zeno JA, Sherer DM, et al. Histologic evidence of old intrauterine bleeding is more frequent in prematurity. Am J Obstet Gynecol. 1995;173(4):1065–1070. doi: 10.1016/0002-9378(95)91327-0. [DOI] [PubMed] [Google Scholar]
- 20.Clark SL. Placenta previa and abruptio placentae. In: Creasy RK, Resnik R, editors. Maternal Fetal Medicine. Philadelphia, PA: WB Saunders Company; 2004. pp. 715–717. [Google Scholar]
- 21.Naeye RL. Causes of perinatal mortality in the US Collaborative Perinatal Project. JAMA. 1977;238(3):228–229. [PubMed] [Google Scholar]
- 22.Naeye RL, Tafari N, Marboe CC. Perinatal death due to abruptio placentae in an African city. Acta Obstet Gynecol Scand. 1979;58(1):37–40. doi: 10.3109/00016347909154910. [DOI] [PubMed] [Google Scholar]
- 23.Hernán MA. A definition of causal effect for epidemiological research. J Epidemiol Community Health. 2004;58(4):265–271. doi: 10.1136/jech.2002.006361. [DOI] [PMC free article] [PubMed] [Google Scholar]
- 24.Rubin DB. Formal modes of statistical inference for causal effects. J Stat Plan Infer. 1990;25(3):279–292. [Google Scholar]
- 25.VanderWeele TJ. Controlled direct and mediated effects: definition, identification and bounds. Scand J Stat. doi: 10.1111/j.1467-9469.2010.00722.x. Advance Access: December 22, 2010. (DOI: 10.1111/j.1467–9469.2010.00722.x) [DOI] [PMC free article] [PubMed] [Google Scholar]
- 26.Kaufman JS, MacLehose RF, Kaufman S. A further critique of the analytic strategy of adjusting for covariates to identify biologic mediation [electronic article] Epidemiol Perspect Innov. 2004;1(1):4. doi: 10.1186/1742-5573-1-4. [DOI] [PMC free article] [PubMed] [Google Scholar]
- 27.Spiegelman D, Hertzmark E. Easy SAS calculations for risk or prevalence ratios and differences. Am J Epidemiol. 2005;162(3):199–200. doi: 10.1093/aje/kwi188. [DOI] [PubMed] [Google Scholar]
- 28.Valeri L, VanderWeele TJ. Technical Report: Extending the Baron and Kenny Mediation Analysis to Allow for Exposure-Mediator Interactions: SAS and SPSS Macros. Boston, MA: Harvard School of Public Health; 2010. [Google Scholar]
- 29.Ananth CV, Oyelese Y, Srinivas N, et al. Preterm premature rupture of membranes, intrauterine infection, and oligohydramnios: risk factors for placental abruption. Obstet Gynecol. 2004;104(1):71–77. doi: 10.1097/01.AOG.0000128172.71408.a0. [DOI] [PubMed] [Google Scholar]
- 30.McElrath TF, Hecht JL, Dammann O, et al. Pregnancy disorders that lead to delivery before the 28th week of gestation: an epidemiologic approach to classification. ELGAN Study Investigators. Am J Epidemiol. 2008;168(9):980–989. doi: 10.1093/aje/kwn202. [DOI] [PMC free article] [PubMed] [Google Scholar]
- 31.Goldenberg RL, Hauth JC, Andrews WW. Intrauterine infection and preterm delivery. N Engl J Med. 2000;342(20):1500–1507. doi: 10.1056/NEJM200005183422007. [DOI] [PubMed] [Google Scholar]
- 32.Goldenberg RL, Culhane JF, Iams JD, et al. Epidemiology and causes of preterm birth. Lancet. 2008;371(9606):75–84. doi: 10.1016/S0140-6736(08)60074-4. [DOI] [PMC free article] [PubMed] [Google Scholar]
- 33.Taffel SM, Ventura SJ, Gay GA. Revised US. certificate of birth—new opportunities for research on birth outcome. Birth. 1989;16(4):188–193. doi: 10.1111/j.1523-536x.1989.tb00896.x. [DOI] [PubMed] [Google Scholar]
- 34.Taffel S, Johnson D, Heuser R. A method of imputing length of gestation on birth certificates. Vital Health Stat 2. 1982;93:1–11. [PubMed] [Google Scholar]
- 35.Ananth CV. Menstrual versus clinical estimate of gestational age dating in the United States: temporal trends and variability in indices of perinatal outcomes. Paediatr Perinat Epidemiol. 2007;21(suppl 2):22–30. doi: 10.1111/j.1365-3016.2007.00858.x. [DOI] [PubMed] [Google Scholar]
- 36.Joseph KS, Huang L, Liu S, et al. Reconciling the high rates of preterm and postterm birth in the United States. Fetal and Infant Health Study Group of the Canadian Perinatal Surveillance System. Obstet Gynecol. 2007;109(4):813–822. doi: 10.1097/01.AOG.0000255661.13792.c1. [DOI] [PubMed] [Google Scholar]
- 37.Ananth CV, Getahun D, Peltier MR, et al. Placental abruption in term and preterm gestations: evidence for heterogeneity in clinical pathways. Obstet Gynecol. 2006;107(4):785–792. doi: 10.1097/01.AOG.0000207560.41604.19. [DOI] [PubMed] [Google Scholar]
- 38.Ananth CV, Oyelese Y, Prasad V, et al. Evidence of placental abruption as a chronic process: associations with vaginal bleeding early in pregnancy and placental lesions. Eur J Obstet Gynecol Reprod Biol. 2006;128(1-2):15–21. doi: 10.1016/j.ejogrb.2006.01.016. [DOI] [PubMed] [Google Scholar]
- 39.Elsasser DA, Ananth CV, Prasad V, et al. Diagnosis of placental abruption: relationship between clinical and histopathological findings. New Jersey-Placental Abruption Study Investigators. Eur J Obstet Gynecol Reprod Biol. 2010;148(2):125–130. doi: 10.1016/j.ejogrb.2009.10.005. [DOI] [PMC free article] [PubMed] [Google Scholar]
- 40.Joseph KS. Theory of obstetrics: the fetuses-at-risk approach as a causal paradigm. J Obstet Gynaecol Can. 2004;26(11):953–960. doi: 10.1016/s1701-2163(16)30414-5. [DOI] [PubMed] [Google Scholar]
- 41.Basso O, Wilcox AJ, Weinberg CR. Birth weight and mortality: causality or confounding? Am J Epidemiol. 2006;164(4):303–311. doi: 10.1093/aje/kwj237. [DOI] [PubMed] [Google Scholar]
- 42.Hernández-Díaz S, Schisterman EF, Hernán MA. The birth weight “paradox” uncovered? Am J Epidemiol. 2006;164(11):1115–1120. doi: 10.1093/aje/kwj275. [DOI] [PubMed] [Google Scholar]
Associated Data
This section collects any data citations, data availability statements, or supplementary materials included in this article.