Abstract
The oxidation of DNA resulting from reactive oxygen species generated during aerobic respiration is a major cause of genetic damage that, if not repaired, can lead to mutations and potentially an increase in the incidence of cancer and aging. A major oxidation product generated in cells is 8-oxoguanine (oxoG), which is removed from the nucleotide pool by the enzymatic hydrolysis of 8-oxo-2′-deoxyguanosine triphosphate and from genomic DNA by 8-oxoguanine-DNA glycosylase. Finding and repairing oxoG in the midst of a large excess of unmodified DNA requires a combination of rapid scanning of the DNA for the lesion followed by specific excision of the damaged base. The repair of oxoG involves flipping the lesion out of the DNA stack and into the active site of the 8-oxoguanine-DNA glycosylase. This would suggest that thermodynamic stability, in terms of the rate for local denaturation, could play a role in lesion recognition. While prior X-ray crystal and NMR structures show that DNA with oxoG lesions appears virtually identical to the corresponding unmodified duplex, thermodynamic studies indicate that oxoG has a destabilizing influence. Our studies show that oxoG destabilizes DNA (ΔΔG of 2–8 kcal mol−1 over a 16–116 mM NaCl range) due to a significant reduction in the enthalpy term. The presence of oxoG has a profound effect on the level and nature of DNA hydration indicating that the environment around an oxoG•C is fundamentally different than that found at G•C. The temperature-dependent imino proton NMR spectrum of oxoG modified DNA confirms the destabilization of the oxoG•C pairing and those base pairs that are 5′ of the lesion. The instability of the oxoG modification is attributed to changes in the hydrophilicity of the base and its impact on major groove cation binding.
INTRODUCTION
The oxidation of guanine to 8-oxoguanine (oxoG) in DNA is a frequent transformation that occurs in cells as a result of the metabolic generation of reactive oxygen species or exposure to agents that induce oxidative stress (1–5). It has been demonstrated that this modification is both cytotoxic and mutagenic (6–9), the latter presumably due to misincorporation errors by either replicative polymerases (10) or by translesion synthesis (TLS) polymerases that can bypass lesions, albeit with reduced fidelity (11–15). As is frequently the case for the more common types of DNA lesions, there are specific proteins involved in the repair of oxoG, as well as those that restrict its incorporation into DNA via the dNTP pool. The latter process is performed by MutT that hydrolyzes 2′-deoxy-oxoGTP to 2′-deoxy-oxoGMP and prevents its use as a substrate by DNA polymerases (16–18). The major repair pathway for removal of oxoG from DNA is base excision repair (BER) and the initial step is performed by 8-oxoguanine-DNA glycosylase (MutM in bacteria or OGG in mammals), which catalyzes the hydrolysis of the lesion from the DNA backbone to afford the free oxoG base and leaving an abasic site in the DNA (19–21). To accomplish this reaction, the oxoG nucleotide must flip out of the DNA stack into the active site of the protein (22). After excision of the oxoG, the remaining abasic site is then serially processed by a number of other BER proteins to eventually restore a normal G•C base pair (23,24).
The mechanism by which the OGG glycosylase finds its substrate in the midst of a huge excess of undamaged DNA is an area of interest that has potential clinical implications since oxidative damage is associated with both aging (25,26) and cancer (27–29). Structural analyses of DNA with an oxoG•C base pair have been reported using a number of experimental methods. The crystal structure shows that the base pairing is very similar to a canonical Watson–Crick G•C base pair (30). Low temperature (5°C) NMR studies of a 5′-d(CCACTA–oxoG–TCACC) sequence also indicate a normal Watson–Crick B-form arrangement (31). However, the NMR studies provided evidence for a 3–5°C decrease in thermal stability (TM) as measured by the temperature-dependence of the chemical shifts for the non-exchangeable protons, as well as for line-widths of the exchangeable imino protons. The origin of this destabilization was attributed to a local change around the oxoG•C base pair without a large-scale change in the overall structure. UV melting and DSC studies of 5′-d(GCGTAC–oxoG–CATGCG)-3′•3′-d(CGCATGCGTACGC)-5′ duplex yielded the same general observation of a reduced (2–3°C) thermal stability in 1 M salt concentration. Note that the NMR studies were done at 200 mM salt concentration and at higher strand concentration (32). The base pairing of 8-oxo-dG with dC, dT, dG and dA has also been measured by NMR, and it was concluded, consistent with both the high-resolution crystal and NMR structures, that the 8-oxo-dG•dC has a normal high-affinity Watson–Crick base pairing arrangement (33).
Based upon structural studies that indicate normal Watson–Crick oxoG•C base pairing, it was proposed that OGG (and MutM) can detect its cognate lesion through ‘recognition’ of the oxoG lesion while it is stacked within the double helix (22,34–37). In this regard, the discrimination between oxoG•C and G•C could involve the unique H-bond donor available at N7-H on oxoG with an H-bond acceptor on the glycosylase (e.g. the amide carbonyl of Gly42). In summary, a series of discrimination events induce the specific helical extrusion and entry of oxoG into the enzyme's activie site (34). The proposed direct recognition of the intrahelical oxoG by OGG and MutM contrasts with the suggested mechanism by which uracil DNA-glycosylase (UNG) finds and repairs deoxyuridine (dU) in DNA (38–41). In the case of dU, the experimental data are consistent with UNG passively finding and trapping extrahelical dU residues rather than facilitating the selective extrusion of the cognate dU from the DNA stack base. Once inside the active site of their respective glycosylases, both oxoG and dU are efficiently hydrolyzed from the DNA leaving an abasic site. It is of course quite possible, that the two glycosylases use different mechanisms to find their cognate lesions.
The normal appearance of an oxoG•C base pair by crystallography and NMR is remarkable since there are major differences in the atoms that line the floor of the major groove at the oxidized lesion. Specifically, the electronegative 7 -Nδ− atom and unpolarized C8–H on G are replaced on oxoG by a electropositive N–Hδ+ and an electronegative sp2-Oδ−, respectively. Accordingly, we anticipated that the arrangement of cations and waters of hydration in the major groove near an oxoG•C base pair would be quantitatively and qualitatively different than at a canonical G•C, and that this would alter local DNA stability and its conformational dynamics. Previously, we observed that 7-deazaguanine caused an enthalpy-derived destabilization of DNA, which we attributed to the elimination of a major groove cation binding site (42,43).
Because high-resolution structural studies generally do not account for water and cations, we initiated an investigation of the thermodynamic properties of an oxoG•C base pair with specific interest in the effect on cation binding and hydration. To complement the thermodynamic studies, the temperature-dependent changes in the imino proton NMR spectrum were determined. The results show that there are significant thermodynamic differences between the unmodified and oxidized base, and that there is a reduction in base pair stacking and enhanced exchange of the imino protons at the oxoG•C base pair. The origins of this destabilization are discussed.
MATERIALS AND METHODS
Materials
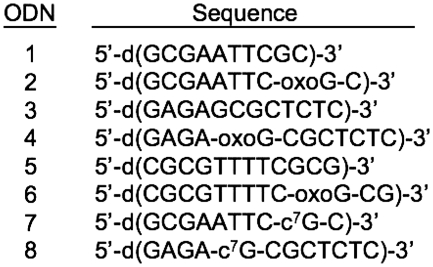
The unmodified and modified oligodeoxynucleotides were synthesized by the Midland Certified Reagent Co. (Midland, TX, USA) and purified by anion-exchange HPLC. Purity of the oligodeoxynucleotides (Figure 1) were verified by HPLC using a semi-preparative reverse-phase column (Phenomenex, phenyl-hexyl, 5 µm, 250 ×10.0 mm) equilibrated with 10 mM triethylammonium acetate (pH 7.0). All the oligomers were desalted on a G-25 Sephadex column, lyophilized to dryness and characterized by MALDI-TOF-MS (calculated mass for [M-H]− m/z 3662.4; found m/z 3663.88). The dry oligomers were annealed by dissolving the single-stranded oligodeoxynucleotides in appropriate buffer, heating the solution up to 85°C for 15 min and allowing it to slowly cool down to room temperature. The oligomer concentrations for the NMR studies were determined by UV using an extinction coefficient of 1.11 × 10⁻⁵ M−1 cm−1 at 260 nm and 25°C. The strand concentrations of the oligonucleotides (ODNs) for the thermodynamic studies were determined at 260 nm using the following molar extinction coefficients assuming similar extinction coefficients for oxoG and G (in mM−1 cm−1): 95 (GCGAATTCGC), 105 (CGCGTTTTCGCG) and 112 (GAGAGCGCTCTC). These values were calculated by extrapolation of the tabulated values of the dimers and monomer bases (44) at 25 and 80°C using procedures reported earlier (45).
Figure 1.
Sequence of the ODNs; oxoG, 8-oxoguanine; c7G, 7-deazaguanine.
Temperature-dependent melts by UV spectroscopy
The UV melting experiments were performed on a Cary UV 300 Bio UV–visible spectrophotometer (Varian Inc., Palo Alto, CA, USA) equipped with a Cary Temperature Controller. The melting of the ODNs were monitored at 260 and/or 275 nm in the temperature range of 0–90°C at a heating rate of 1.0°C/min with a data interval of 0.4°C. The transition temperature (TM) was determined by the analysis of the first derivative and shape (46) of the melting curves. The nature of complex formation of the ODNs was studied by performing the UV melts as a function of their total strand concentration (3–330 µM). Differential binding of the counterions (ΔnNa+) and water (Δnw) molecules were determined by performing the UV melts of the ODNs in the presence of salt (10–200 mM NaCl), and ethylene glycol (0.5–3.0 m at 10 mM NaCl), respectively, to understand the molecular changes accompanying the helix to coil transitions. These parameters are calculated using the procedure described earlier (47–49).
Thermal denaturation by differential scanning calorimetry
Calorimetric enthalpies for the helix to coil transitions of the ODNs were acquired on a VP-DSC differential scanning calorimeter (MicroCal, LLC, Northampton, MA, USA). In a typical DSC experiment, ∼200 μM of total strand concentration of the ODN solution in the sample cell (0.506 ml cell volume) was scanned from 0–90°C at a rate of 45°C/h with buffer in the reference cell. A buffer versus buffer scan was also done under similar conditions and subtracted from the subsequent experimental runs. A 16 s filter period was used for all the data acquisitions. The resulting thermograms were plotted as heat capacity (ΔCp) versus temperature profiles using Origin 7.0 software provided with the instrument. Analysis of the integrated plots of the anomalous ΔCp versus temperature curves (∫ΔCpdT) and normalization for the number of moles, yields the molar calorimetric enthalpy (ΔHcal). The molar calorimetric entropy (ΔScal) was calculated from integration of the ΔCp/T versus T curves [∫(ΔCp/T)dT]. We use the Gibbs equation (Equation 1), or Equation (2), to calculate the Gibbs free energy at 20°C:
| (1) |
| (2) |
Pressure perturbation calorimetry
A VP-DSC differential scanning calorimeter equipped with a pressure perturbation accessory was used to measure the heat (ΔQ) resulting from the application of an additional pressure change (ΔP) above the solutions of the calorimetric cells. A complete description of this pressure perturbation calorimetry (PPC) technique can be found elsewhere (50–52). Prior to the PPC scans, standard DSC curves were obtained for the oligonucleotides using a 10 mM sodium phosphate buffer at pH 7, with and without the oxoG lesion, to determine the temperature range and temperature step to be used in the PPC experiment. A sample solution with 0.7 mM (control) or 1.1 mM (modified) concentration in strands is allowed to equilibrate against the same buffer solution (reference cell) at constant temperature and external pressure. The external pressure is then increased by ∼50 psi, causing heat to be absorbed differentially by the sample and reference cells. These heats, ΔQ, are obtained from integration of the compression and decompression peaks resulting from switching the external pressure on and off at particular temperatures determined from the DSC curves. In addition, buffer–buffer, buffer–water and water–water scan are performed for the proper setting of the pre- and post-transitional baselines, and baseline subtraction. The ΔQ values are used to measure the apparent coefficient of thermal expansion, α(T), from integration of the relationship:
yielding: ΔQ = −TVα(T)ΔP; where V is the apparent molar volume of the solute.
For a two component system:
where αo is the thermal coefficient of the solvent. Integration of α(T) over the temperature range of the unfolding reaction, ∫α(T)dT, yields the relative volume changes of the solute, ΔV/V, where ΔV is the unfolding volume of the macromolecule. The value of V is obtained from the following Equation (53):
where M is the molecular mass of DNA, ρo and ρ are the densities of the solvent and solution, respectively. The density of these solutions are measured with an Anton Paar (Graz, Austria) DMA densitometer in the differential mode, using two 602-M micro cells, each with a volume of ∼150 μl. The reference cell is filled with water while the measuring cell is filled with solution or buffer. The density, ρ, is calculated from the oscillation period T of the cell using the following relationship:
where A and B are constants determined from calibrating densities (and periods) of water and air (53,54).
NMR
Samples for the observation of exchangeable protons were dissolved to a duplex concentration of 0.25 mM in 180 µl of 10 mM NaH2PO4, 200 mM NaCl, 50 µM Na2EDTA buffer (pH 7.0) containing 9:1 H2O/D2O (v/v). One- and two-dimensional (1D and 2D) NMR experiments were performed on a Bruker Avance spectrometer operating at 600 MHz. Chemical shifts were referenced to water resonance. NMR data were processed using TOPSPIN software (2.0.b.6, Bruker Inc., Karlsruhe, Germany). One-dimensional NMR spectra for the exchangeable protons were recorded at 5, 15, 25, 35, 45, 55 and 65°C. The 1H–1H NOESY spectra of unmodified and modified samples in H2O were collected at 5°C, with 70 and 250 ms mixing time and relaxation delay of 2.0 s (55,56). These experiments were recorded using a field gradient Watergate pulse sequence for water suppression (57).
RESULTS
Effect of oxoG on the transition temperature of the oligonucleotides monitored by UV spectroscopy
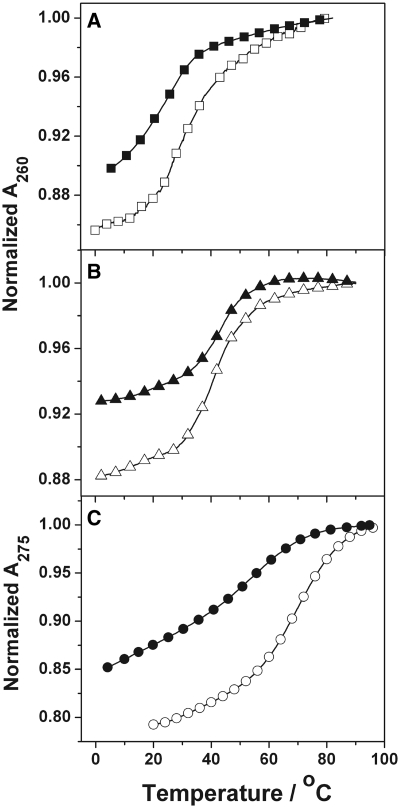
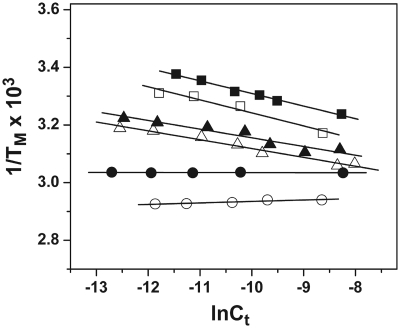
Table 1 summarizes the thermodynamic parameters obtained from the UV melting analysis of the unmodified ODNs and the corresponding ODNs with an oxoG modification. ODN-1 melts as a single transition from duplex to random coil with a TM of 29.5 and 53.0°C at 10 (Figure 2A) and 100 mM salt (Supplementary Data) concentrations, respectively. Replacing the G-9 with an oxoG caused a destabilizing effect and the ΔTM relative to control ODN-2 was 6.3 and 13.8°C at 10 (Figure 2A) and 100 mM (data not shown) salt concentrations, respectively. In concordance with a duplex structure, the TM values of ODN-1 and ODN-2 showed strand dependence in the range of ∼8–256 µM total strand concentration in the presence of 10 (Figure 3) and 100 mM (Supplementary Data) NaCl concentration.
Table 1.
Standard thermodynamic profiles for the formation of DNA duplexes at 20°Ca
| ODN | NaCl | TM | ΔHcal | ΔG°20 | TΔScal | ΔnNa+ | Δnw |
|---|---|---|---|---|---|---|---|
| (mM) | (°C) | (kcal/mol) | (kcal/mol) | (kcal/mol) | (mol−1 DNA) | (/mol DNA) | |
| 1 | 10 | 29.5 | −80.1 | −5.6 | −74.5 | −2.2 ± 0.2 | −30 ± 4 |
| 100 | 53.0 | −72.3 | −8.2 | −64.1 | −1.7 ± 0.1 | −22 ± 3 | |
| 2 | 10 | 23.2 | −44.4 | −2.3 | −42.1 | −1.7 ± 0.1 | −15 ± 1 |
| 100 | 39.2 | −33.2 | −3.0 | −30.1 | −1.2 ± 0.1 | −10 ± 1 | |
| 3 | 10 | 41.0 | −78.2 | −6.9 | −71.3 | −3.4 ± 0.2 | −41 ± 3 |
| 100 | 59.5 | −92.0 | −12.5 | −79.5 | −3.6 ± 0.2 | −43 ± 4 | |
| 4 | 10 | 39.4 | −39.3 | −3.2 | −36.1 | −1.0 ± 0.1 | −14 ± 2 |
| 100 | 51.2 | −39.5 | −4.6 | −35.0 | −0.9 ± 0.1 | −13 ± 2 | |
| 5 | 10 | 68.4 | −31.0 | −4.4 | −26.6 | −0.3 ± 0.1 | −18 ± 2 |
| 100 | 69.9 | −27.7 | −4.1 | −23.6 | −0.2 ± 0.1 | −16 ± 1 | |
| 6 | 10 | 56.5 | −16.6 | −1.8 | −14.8 | −0.3 ± 0.1 | −7 ± 1 |
| 100 | 61.0 | −7.8 | −1.0 | −6.9 | −0.1 ± 0.1 | −3 ± 1 |
aAll parameters are measured from UV (TM) and DSC melting curves in 10 mM sodium phosphate buffer (pH 7.0) using ∼10 µM DNA. The observed standard deviations are: TM (±0.7), ΔHcal (±3), ΔG°20 (±0.15), TΔScal (±2).
Figure 2.
Absorbance versus temperature curves in 10 mM sodium phosphate buffer (pH 7) for ∼10 µM total strand concentration of the ODNs: (A) ODN-1 (open square) and ODN-2 (filled square); (B) ODN-3 (open triangle) and ODN-4 (filled triangle) at 260 nm; and (C) ODN-5 (open circle) and ODN-6 (filled circle) at 275 nm.
Figure 3.
TM dependence on the strand concentration of ODNs in 10 mM sodium phosphate buffer (pH 7): ODN-1 (open square) ∼8–178 µM, ODN-2 (filled square) ∼10–256 µM, ODN-3 (open triangle) ∼4–330 µM, ODN-4 (filled triangle) ∼4–127 µM at 260 nm, ODN-5 (open circle) ∼7–175 µM and ODN-6 (filled circle) ∼3–264 µM total strand concentration at 275 nm.
The duplex sequence ODN-3 (5′-GAGAGCGCTCTC) showed a TM value of 41.0 and 59.5°C in 10 (Figure 2B) and 100 mM NaCl, respectively. Modification of the G-5 residue (ODN-4) resulted in a TM reduction of 1.6 and 8.3°C in 10 (Figure 2B) and 100 mM salt, respectively. Strand-dependent experiments done at 10 mM salt concentrations showed an increasing TM with an increase in the total strand concentration in the range of ∼4–330 µM (Figure 3). A similar trend is observed at 100 mM salt concentration (Supplementary Data). This strand dependent single transition is evidence of a duplex to random coil denaturation.
The 5′-CGCGTTTTCGCG sequence (ODN-5) forms a hairpin with a T4 loop and shows a monophasic transition for random coil formation. The TM is 68.4 and 69.9°C in the presence of 10 (Figure 2C) and 100 mM (Supplementary Data) salt, respectively. The oxoG modified ODN-6 at the G-10 melted at 56.5 and 61.0°C in 10 (Figure 2C) and 100 mM (data not shown) salt, respectively. The strand dependence of the sequences (∼3–264 µM total strand concentration) done at 10 (Figure 3) and 100 mM salt (data not shown) concentrations did not show any change in the TM as expected for the unfolding of an intramolecular hairpin.
Comprehensively, it can be noted that, oxoG causes a TM reduction in all the studied ODNs, irrespective of the flanking sequences and the salt concentration. In addition to the change in TM, the hyperchromicity, which is an indicator of reduced base stacking, for the melts of the oxoG substituted ODNs is significantly reduced relative to the natural sequences. The drop in hyperchromicity for both ODN-2 and ODN-4 relative to ODN-1 and ODN-3, respectively, is ∼40%, while the change is ∼30% for the hairpin structure.
Calorimetric analysis of the oxoG modified oligonucleotides
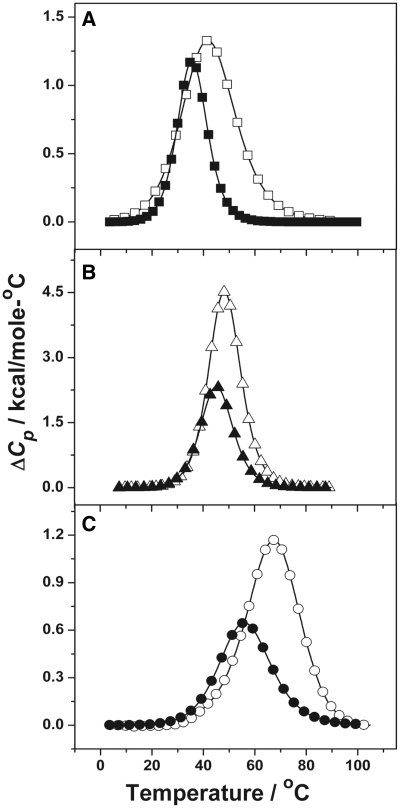
Representative DSC thermograms of the unmodified and oxoG modified ODNs in the presence of 10 mM NaCl concentration are shown in Figure 4 and the corresponding thermodynamic parameters at 10 and 100 mM NaCl are given in Table 1. The reported thermodynamic values represent an average of the analysis of five or six consecutive scans.
Figure 4.
Calorimetric transition curves for ODNs in 10 mM sodium phosphate buffer (pH 7): (A) ODN-1 (open square) at 200 µM and ODN-2 (filled square) at 256 µM. (B) ODN-3 (open circle) at 110 µM and ODN-4 (filled triangle) at 130 µM. (C) ODN-5 (open circle) at 200 µM and ODN-6 (filled circle) at 264 µM total strand concentration.
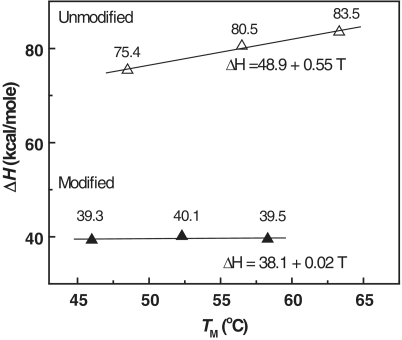
Sequences ODN-1, ODN-2, ODN-3 and ODN-4 unfold as a single monophasic transitions as expected for a duplex to random coil formation. Both modified oligomers, ODN-2 and ODN-4, show a decrease in the TM compared to the corresponding unmodified ODNs at 10 (Figure 4A and B) and 100 mM salt concentrations (Table 1) (Supplementary Data). The calorimetric enthalpy of ODN-2 yielded an endothermic difference of 35.7 and 39.1 kcal/mol compared to ODN-1 at 10 and 100 mM NaCl, respectively. Similarly the ΔΔHcal values for ODN-4 was calculated to be 38.9 and 52.5 kcal/mol at 10 and 100 mM salt concentration, respectively, compared to the unmodified ODN-3 at low and high salt.
The oxoG modified hairpin sequence, ODN-6 also melts as a single transition at 10 (Figure 4C) and 100 mM (Supplementary Data) NaCl concentrations with the TM values as 56.5 and 61.0°C, respectively. The values are approximately the same as obtained from the UV curves confirming the structure of the ODN as a hairpin. The ΔΔHcal values obtained for the oxoG modified hairpin sequence at 10 and 100 mM NaCl are 14.4 and 19.9 kcal/mol, respectively. The lower ΔΔHcal values correspond to a single modification in this hairpin molecule while the duplexes have two modifications per complex.
A decrease in the thermodynamic parameters for all the oxoG modified ODNs is reflected in the thermodynamic stability of the transitions represented by the Gibbs free energy changes (ΔΔG° at 20°C) of ∼3.2 ± 0.6 kcal/mol in 10 mM NaCl (Table 1). This reduction in all the thermodynamic parameters for the oxoG modified ODNs compared to the corresponding unmodified ODNs confirms the UV melting results and the previous NMR and thermodynamic reports (31,32) that the introduction of oxoG in these sequences destabilizes DNA. The differences in the magnitudes of the ODNs correspond to sequences differences, i.e. the oxoG•C base pair is placed in different base-pair environments, 5′-C–oxoG–C and 5′-A–oxoG–C.
Effect of counterions and water in the stability of oxoG modified oligonucleotides
In most cases, the melting of DNA is a phenomenon accompanied with simultaneous release of water molecules and cationic counterions, and the latter can be hydrated. These counterions and water molecules are known to add to the stability of native DNA. Therefore, studying the hydration and cations associated with the different duplex structures provides information about the factors that contribute to the enthalpy and entropy terms responsible to the overall stability of the duplex versus random coil structures and for modified versus unmodified DNA. The melting of the oxoG modified ODNs (ODN-2, ODN-4 and ODN-6) was studied in the presence of 10–200 mM NaCl to understand the effect of oxoG on the release/uptake of the Na+ in these ODNs.
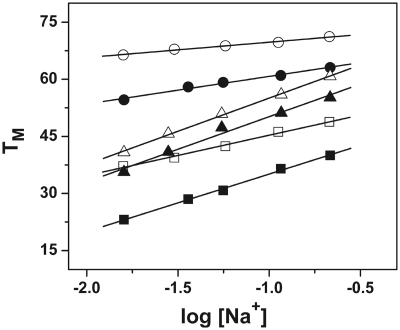
ODN-2, ODN-4 and ODN-6 show a 17.0, 19.6 and 9.0°C increase in thermal stability, respectively, upon raising the salt concentration from 10 to 200 mM. The linear dependence of TM on Na+ concentration is graphically represented in Figure 5. Each plot gives a linear regression coefficient of ∼0.99. The slope of these lines along with the ΔHcal and TM determined by calorimetry at 10 and 100 mM NaCl was used to calculate the change in the number of moles of Na+ ion bound (ΔnNa+) upon the melting of the three ODNs (Table 1). At a salt concentration of 10 mM, the values of ΔnNa+ for the formation of ODN-2, ODN-4 and ODN-6 are found to be −1.7, −1.0 and −0.3, respectively (Table 1). Compared to ODN-1 and ODN-3, the values are lower with a difference of 0.5 and 2.4 in the case of ODN-2 and ODN-4, respectively, in 10 mM salt, indicating lower counterion binding in the presence of oxoG in the DNA. The oxoG modified hairpin, ODN-6, did not show any change in the number of cations released within the experimental error (Figure 5 and Table 1). Increasing the bulk salt concentration to 100 mM led to a decrease in the ΔnNa+ values, which could be attributed to the higher screening of the phosphates at a higher salt concentration (Table 1).
Figure 5.
TM dependence on the salt concentration of ODNs (∼7 µM total strand concentration) in 10 mM sodium phosphate buffer (pH 7) at 260 nm for ODN-1 (open square), ODN-2 (filled square), ODN-3 (open triangle), and ODN-4 (filled triangle), and at 275 nm for ODN-5 (open circle) and ODN-6 (filled circle).
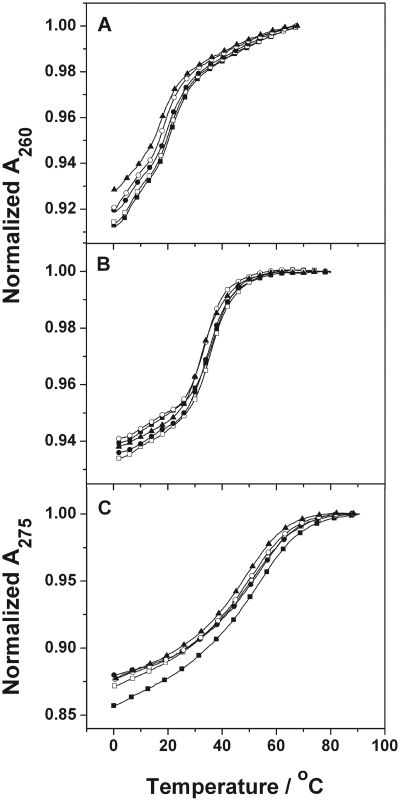
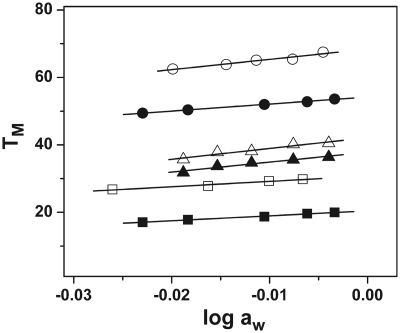
The changes in the hydrophobic/structural water associated with the melting process were estimated by the osmotic stress method using ethylene glycol in the range of 0.5–3.0 m at 10 mM salt concentration. Spink and Chaires (58) showed that low-molecular weight co-solutes, such as ethylene glycol, influence DNA melting only through changes in water activity. Hence, the slope of a plot of TM versus logarithm of the activity of water (log aw) allows the calculation of Δnw, the change in the number of moles of water per base pair upon melting of the duplex. The thermal behavior of the ODNs in the presence of osmolyte in 10 mM NaCl is presented in Figure 6. It is observed that with an increase in osmolyte concentration from 0.5 to 3.0 m, the TM shows a decreasing trend. A plot of TM versus log aw (Figure 7) gives negative slopes, each with a linear regression coefficient of ∼0.99. The number of water molecules associated with the transition of these ODNs was calculated using the values of ΔHcal and TM obtained from the DSC curves at 10 mM NaCl for each of the negative slope values obtained in the presence of ethylene glycol at this salt concentration. The values calculated are given in Table 1. The ΔΔnw values obtained for the UV melt of ODN-2, ODN-4 and ODN-6 in the presence of ethylene glycol in 10 mM NaCl are −15, −27 and −11, respectively. At the higher salt 100 mM concentration, the Δnw values are lower (Table 1) due to higher screening of the water dipoles.
Figure 6.
UV melting curves for ODN-2 (A), ODN-4 (B) and ODN-6 (C) in the presence of 0.5 (filled square), 0.85 (open square), 1.4 (filled circle), 2.4 (open circle) and 3.0 (filled triangle) molal ethylene glycol in 10 mM sodium phosphate buffer, pH 7.0.
Figure 7.
TM dependence on the ethylene glycol concentration of ODNs (∼7 µM total strand concentration) in 10 mM sodium phosphate buffer (pH 7) at 260 nm for ODN-1 (open square), ODN-2 (filled square), ODN-3 (open triangle) and ODN-4 (filled triangle), and at 275 nm for ODN-5 (open circle) and ODN-6 (filled circle).
In summary, the unfolding of each ODN is accompanied by a net release of counterions and water molecules. However, the extent of release is much lower with the oxoG modified ODNs.
Effect of OxoG in the unfolding volume of the ODN
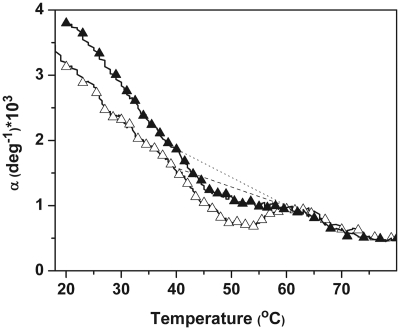
PPC was used to determine the unfolding volume of ODN-4 and its unmodified control ODN-3 in order to obtain additional insight on the hydration effects accompanying the substitution of an oxoG•C base pair for G•C. The PPC curves of ODN-3 and ODN-4 are shown in Figure 8. In this experiment, the temperature dependence of the coefficient of thermal expansion (α) is followed as a function of temperature. The magnitudes of α and of the slopes of the pre- and post-transition baselines (Table 2) indicate the type of chemical groups that are exposed to the solvent throughout the transition. At low temperatures, the positive values of α and the negative slopes of the pre-transition baselines, indicate the exposure of hydrophilic groups (i.e. sugar–phosphate backbone) to the solvent in their folded states. However, ODN-3 has a lower α-value coupled with a less negative slope relative to ODN-4. This suggests that the duplex state of ODN-4 is slightly more hydrophilic than ODN-3, despite the fact that both duplexes have similar molar volumes (ΦV) (Table 2). At higher temperatures, due to the additional exposure of aromatic groups to the solvent, the post-transition baselines have lower α-values and slopes closer to zero; their magnitudes are more or less similar. This indicates, as expected, similar random coil states for both ODN-3 and ODN-4.
Figure 8.
PPC curves in 10 mM sodium phosphate buffer at pH 7.0: ODN-3 (open triangle, at 660 µM) and ODN-4 (filled triangle, at 500 µM); dotted line and dashed lines are slopes for post-transition baseline for ODN-3 and ODN-4, respectively.
Table 2.
PPC results for the unfolding of ODN-3 and ODN-4a
| Pre-transition |
Post-transition |
|||||||
|---|---|---|---|---|---|---|---|---|
| ODN | α (×103) | ∂a/∂T (×105) | α (×103) | ∂a/∂T (×105) | ΔV•ΦV (×103) | ΦV (×10−3) | ΔVU (cm3/mol) | ΔCp (cal/K•mol) |
| ODN-3 | 1.6 | −8.1 | 1.0 | −2.8 | −8.0 | 3.5 | −28 | 550 |
| ODN-4 | 1.8 | −10.6 | 1.0 | −2.7 | −3.7 | 3.5 | −13 | 20 |
aThese parameters are measured in 10 mM sodium phosphate buffer (pH 7.0) using a 580 µM solution of the ODN. The experimental errors are: ΔV (±3 cm3/mol) and ΔCp (±10 cal).
The helix–coil transitions for each ODN are shown as negative peaks with TMs (Figure 8) similar to the TMs of the DSC unfolding curves. Integration and analysis (52) of these peaks yielded unfolding volumes (ΔVU) of −28 cm3/mol (ODN-3) and −13 cm3/mol (ODN-4), revealing volume contractions of the system as the temperature is increased. If the existence of voids is considered negligible, these volume contractions reflect changes in the hydration state of the ODNs (50,51), i.e. ODN unfolding is accompanied by a decrease in its volume of hydration.
Furthermore, we have performed DSC melts at several salt concentrations to measure indirectly the heat capacity (ΔCp) in the unfolding of each duplex. In the plots of ΔHcal versus TM for each ODN shown in Figure 9, the slopes of the resulting lines correspond to ΔCp of 550 cal/K•mol (ODN-3) and 20 cal/K•mol (ODN-4). Positive heat capacity values imply exposure of hydrophobic groups to the solvent upon duplex unfolding, which is expected due to base unstacking. The heat capacity effect is 28 times smaller for ODN-4 and is consistent with its hydrophilicity relative to ODN-3, as indicated earlier. The correlation of the volume contractions with the ΔCP measurements, and assuming similar random coil states, suggests that ODN-4 is less hydrated with fewer condensed ions, i.e. its folded state has a higher heat capacity value excluding more water molecules. However, as both duplexes have similar ΦVs (Table 2), an alternative explanation is that ODN-4 has a higher percentage of electrostricted water molecules, i.e. its folded state interacts better with the solvent, changing its number of hydrating water molecules.
Figure 9.
The plots of the enthalpy versus TM for ODN-3 (unmodified, open triangle) and ODN-4 (modified, filled triangle) showing positive heat capacity effect for ODN-3.
NMR studies
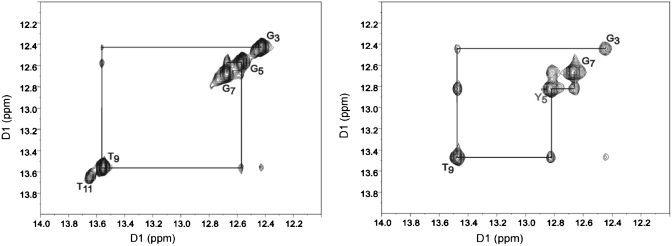
The NMR spectra of the unmodified (ODN-3) and modified (ODN-4) oligonucleotides of Figure 10 show the NOE connectivity of the purine N1 and pyrimidine N3 imino protons. The base imino protons were assigned based on their sequential connectivities in NOESY spectra, and these assignments were supported by their NOE cross-peaks to Watson–Crick base-paired amino protons (57). The sequential connectivities were obtained from base pairs G3·C10 → A4·T9 → G5/oxoG5·C8 → C6·G7. For both duplexes, the imino-proton resonances of the terminal base pairs G1·C12 are lost by fast exchange with water. Because the T11 imino resonance in modified duplex was missing, no NOEs arising from the T11 imino proton were observed. The imino resonance from oxoG5 was shifted upfield (by 0.2 ppm), which reflected the effect of base pairing opposite C.
Figure 10.
1H NOESY spectrum showing resonances for the thymine and guanine imino protons and sequential NOE connectivity for the imino protons of the base pairs G3·C10 → C6·G7 for unmodified duplex ODN-3 (left) and modified duplex ODN-4 (right).
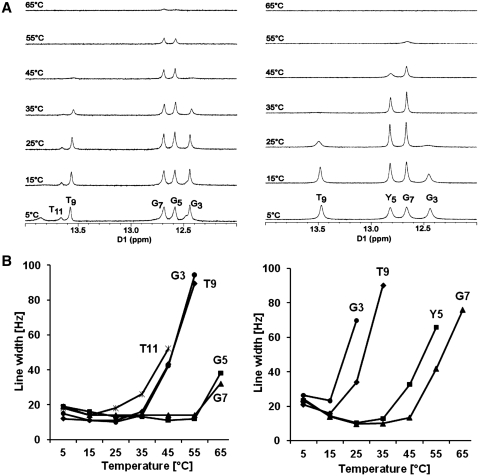
Series of 1D spectra for the exchangeable protons were recorded at 5, 15, 25, 35, 45, 55 and 65°C and are shown in Figure 11A. The temperature dependences of the line widths for base pairs of unmodified and modified duplexes are compared in Figure 11B. The data show that around 45°C the N2-imino proton of the oxoG5·C8 base pair in modified ODN-4 duplex begins to broaden, compared to the G5·C8 base pair in unmodified duplex (ODN-3). At ∼55°C, the oxoG5 peak was broadened to the point of not being observable. Moreover, the T9·A4 imino proton of the flanking base pair was significantly broader by 25°C in the modified duplex, and baseline at 35°C. Similarly, the G3·C10 imino proton broadened at an even lower temperature and near 30°C disappeared into the baseline. Imino proton of the T11·A2 base pair was undetectable compared to unmodified duplex. These observations suggest that the oxoG5 and T9 imino protons were in enhanced exchange with the solvent and indicated a localized destabilization of the oxoG5·C8 and T9·A4 base pairs. This is consistent with reduced base pair stacking indicated by the reduced hyperchromicity in the UV melts and the lower enthalpic stabilization.
Figure 11.
(A) 1H-NMR of imino proton resonances as a function of temperature for unmodified duplex (left) and modified duplex (right). (B) Temperature dependence of line widths of the imino proton resonances of unmodified duplex (left) and modified duplex (right).
DISCUSSION
Based upon X-ray crystal and NMR structural studies, it has been suggested that DNA with an oxoG•C base pair is virtually identical to DNA with a Watson–Crick G•C base pair (30,31). Because of the perceived structural similarity, it was proposed that 8-oxoguanine-DNA glycosylase would need to find its substrate by probing the double helix for a characteristic electronic signature of the non-canonical oxoG deoxynucleoside (34–37). Theoretical calculations indicate that the cost for extrusion of oxoG from the helix would be ∼7 kcal/mol lower than for an unmodified G in the presence of the glycosylase (34). Our results demonstrate changes in free energy with a ΔΔG ranging from 2 to 8 kcal/mol for unmodified versus oxoG modified DNA in the absence of protein. Thus, the local destabilization of DNA by the oxoG adduct may afford a thermodynamic signature that is exploited by repair glycosylases in the initial screening of the genome, a suggestion originally proposed by Plum and Breslauer (59). This mode of initial recognition suffers from being non-selective in that any base modification that reduces local stability could be ‘recognized’ by a DNA glycosylase. However, discrimination is achieved by steric and electronic constraints that allows the modified base to fit into and be stabilized in the active site with a conformation that facilitates its enzymatic cleavage from the DNA backbone. This hypothesis is consistent with the proposed mode of action of UNG, which removes uracil from DNA (38–41).
The change in the free energy of DNA with an oxoG•C base pair is accompanied by a major reduction in enthalpic stabilization. To obtain further insight into the reasons for the large change in the enthalpy term, studies were initiated to understand how the oxoG lesion affected hydration and cation association. The profound reduction in the level of hydration associated with the oxoG•C base pair correlates with the reduction in enthalpic stabilization, and raises the question of what types of water are affected by oxoG. There are waters associated with the ionized phosphate backbone, often referred to as electrostricted water. These waters exchange rapidly and are seldom seen in high-resolution structures of DNA (60,61). There is no reason to suspect that oxidation of guanine will translate to any change in the hydration of the phosphate backbone since the unmodified and oxoG modified DNAs all show a B-DNA conformation in the CD. Therefore, water associated with the sugar–phosphate backbone is probably not involved in the change in hydration and enthalpic destabilization induced by oxoG. Another type of water correlated with duplex formation is termed structural water that interacts with the polar groups in the DNA grooves. This type of water, which exchanges slower than electrostricted water and is observable in many crystal structures (62–64) forms a primary layer that is H-bonded with atoms that line the floor of the major and minor grooves. A third type of water associates with the hydrophobic surfaces of DNA that are exposed to solvent (65). Because the structure around each type of water varies, they have different partial molal volumes.
Each base pair in unmodified B-DNA has ∼20 waters that are part of a hydration network that stabilizes the duplex (66–68). This is considered structural water. Upon denaturation, a net release of four waters/base pair occurs despite the opening of the helix that exposes numerous polar H-binding sites for water molecules, which were tied up in base pairing in the folded state. Clearly, the bridging array of waters that line the floor of the grooves provides enthalpic stabilization of the duplex. When a modified base that affects normal pairing is present, the equilibrium between stacked and unstacked bases will be shifted to the latter, and stabilizing structural water will be replaced with hydrophobic water on the surface of the exposed planar nucleobase. Thus, the exposure of hydrophobic bases has an enthalpic penalty due to reduction in H-bonding that occurs in the first-shell of water molecules that line a planar aromatic surface. Accordingly, the number of hydrophobic water molecules associated with DNA will be minimized. This will result in an overall reduced hydration and would partially account for the unfavorable enthalpy for the oxoG•C base pair and the concomitant increase in entropy due to the net release of groove associated water molecules.
We observed that the volume contractions (negative ΔVU), measured in the PPC experiments, contrast with the water release measured using the osmotic stress technique (positive ΔnW). The reason for this discrepancy results from the complex hydration effects accompanying the unfolding of a nucleic acid duplex summarized above. In the duplex-coil transition, the net effect is the interplay of electrostricted, structural and hydrophobic water that depends on the sequence and temperature. Furthermore, the PPC and osmotic stress methods measure different types of water; the osmotic stress technique measures the thermodynamic number of immobilized/released structural waters while PPC measures the effects of hydrophobic, structural and electrostricted water.
To determine the change in the type of water associated with DNA that occurs due to the G (ODN-3) → oxoG (ODN-4) substitution, we created a Hess cycle with the two duplex-unfolding reactions and assumed that the random coil states at high temperatures are similar. This model yields the following reaction: unmodified duplex → modified duplex, and the associated differential thermodynamic profiles in 10 mM salt are shown in Table 3. The positive signs of the ΔΔG (+3.7 kcal/mol) term and of the ΔΔH − Δ(TΔS) compensation (+35.2 kcal/mol), are opposite to the sign of the differential unfolding volume term (ΔΔVU = −15 cm3/mol). This indicates the participation of structural water molecules, most likely a conversion of structural to electrostricted water, as determined previously for other processes (69–71). Furthermore, we also measured removal of structural water molecules (ΔΔnW = 27) and counterions (ΔΔnNa+ = 2.4) resulting from the G → oxoG substitution. The negative sign of the ΔΔVU term indicates an increase immobilization of water molecules. Since both ODN-3 and ODN-4 duplexes have similar molar volumes (ΦV = 3.5 × 103 cm3/mol), this net hydration change involves an exchange of structural water for electrostricted water molecules (71). The measured removal of 27 structural waters contributes with a volume expansion of ∼122 cm3/mol (i.e. 27 × 4.5, where 4.5 is the change in the molar volume in cm3/mol of structural water) (72). We speculate that an immobilization of ∼43 electrostricted water molecules [(−15 + 122 cm3)/2.5, where 2.5 in cm3/mol is the change in the molar volume of electrostricted water (53,71)]. This net hydration exchange involving interconversion of structural to electrostricted water molecules due to the inclusion of oxoG may also contribute to the observed differential enthalpy term.
Table 3.
Differential thermodynamic profiles for G → oxoG and c7G → G substitutions in a DNA duplexa
| ODN | ΔΔG°10 | ΔΔHcal | Δ(TΔS) | ΔΔnNa+ | ΔΔnW | ΔΔV |
|---|---|---|---|---|---|---|
| (kcal/mol) | (kcal/mol) | (kcal/mol) | (mol Na+/mol) | (mol w/mol) | (cm3/mol) | |
| 2 versus 1 | +3.3 | +35.7 | +32.4 | +0.5 | +15 | n.d. |
| 4 versus 3 | +3.7 | +38.9 | +35.2 | +2.4 | +27 | −15 |
aValues derived by subtracting the thermodynamic parameters of ODN-2 versus ODN-1 and ODN-3 versus ODN-4 in 10 mM sodium phosphate buffer (Table 1).
The temperature-dependent NMR study shows enhanced exchange of the oxoG base with solvent and confirms the thermodynamic instability induced by the lesion and that its effect extends several base pairs in the 3′-direction. It is not clear why the previous temperature-dependent NMR structure of oxoG in the 5′-CGC–oxoG–AATTCGCG sequence did not show a sequence-dependent enhanced exchange in the imino proton spectrum at oxoG•C (31). It is likely that ODN-4 shows a selective destabilization from the oxoG through the 5′-terminus because of the stabilizing influence of the G/C central core that remains relatively intact until higher temperatures (>45°C). In the Dickerson dodecamer, which was the focus of the previous NMR study (31), there is an A2T2 core that exchanges at lower temperatures (>35°C) in the unmodified duplex, so the entire oxoG substituted duplex appears to be destabilized.
What is the origin of the destabilization induced by oxoG? One possibility is the hydrophilicity of the oxoG base mentioned, which could reduce the penalty for it to unstack and be exposed to solvent vs. unmodified G. Another possibility is that the electronic nature of oxoG could reduce H-bonding. However, a prior study on the base pairing properties of oxoG with C, A, G and T using the 5′,3′-bis silylated deoxynucleoside derivatives in CDCl3 solvent, which eliminates contributions due to base stacking and H-bonding involving the sugar ring hydroxyl groups, showed that oxoG•C and G•C have similar binding constants (33). Thus, the intrinsic H-bonding properties of oxoG are not perturbed due to electronic changes in the base. The potential preference for the syn- over the ‘normal’ anti-conformation around the glycosidic bond was also ruled out by the NMR studies in CDCl3, although the barrier for the two conformations may be different in double-stranded DNA. However, neither the NMR or crystal structure studies indicate the presence of a syn-conformation for oxoG when it is paired with dC (29–33).
An important consequence of the change from G•C to oxoG•C is the loss of a major groove cation-binding site due to the replacement of an electronegative N7 atom with an electropositive amide-like N–H. Monovalent cations in high-resolution crystal structures are generally observed near the major groove edge of G•C base pairs close to either the N7 and O6 atoms or equi-distant between the two (73,74). Another high-occupancy monovalent cation binding site is midway between stacked interstrand G's at 5′-GC sequences (69,70), which is the environment of oxoG in ODN-4. We have previously reported that 7-deazaguanine (c7G) (i.e. Figure 1, ODN-7 and ODN-8) causes a destabilization of 1.3–2.5 kcal/mol (over a range of 10-200 mM NaCl) that involves reduced enthalpic stabilization and accompanying reduction in hydration and cation binding (42,75). The destabilization did not occur at the c7G•C base pair but at the neighboring normal C•G base pair. It was shown that the cation, which buttresses the interstrand G's at the 5′-GC sequence, was eliminated in the crystal structure (43). Similar to what has been reported for oxoG•C base pairing (33), the c7G•C base pair did not impact H-bonding affinity. We propose that the loss of the electrostatic association of the cation with the major groove edge near 5′GC destabilizes the DNA, which is revealed in reduced base stacking and reduced hydration.
SUMMARY
Although DNA with oxoG lesions appears to have a similar structure to natural DNA at low temperature, the thermodynamic and temperature-dependent NMR studies indicate that the environment around the lesion is significantly altered. Changes in cation binding and hydration accompany the enthalpic destabilization of DNA by the presence of oxoG.
SUPPLEMENTARY DATA
Supplementary Data are available at NAR Online.
FUNDING
This research was supported by NIH grants CA29088 (to B.G.), CA55678 (to M.P.S.) and NSF grant MCB-0315746 (to L.A.M.). Funding for open access charges: Departmental funds.
Conflict of interest statement. None declared.
Supplementary Material
REFERENCES
- 1.Dizdaroglu M. Formation of an 8-hydroxyguanine moiety in deoxyribonucleic acid on gamma-irradiation in aqueous solution. Biochemistry. 1985;30:4476–4481. doi: 10.1021/bi00337a032. [DOI] [PubMed] [Google Scholar]
- 2.Kasai H, Nishimura S. Hydroxylation of guanine in nucleosides and DNA at the C-8 position by heated glucose and oxygen radical-forming agents. Environ. Health Perspect. 1986;67:111–116. doi: 10.1289/ehp.8667111. [DOI] [PMC free article] [PubMed] [Google Scholar]
- 3.Kasai H, Crain PF, Kuchino Y, Nishimura S, Ootsuyama A, Tanooka H. Formation of 8-hydroxyguanine moiety in cellular DNA by agents producing oxygen radicals and evidence for its repair. Carcinogenesis. 1986;7:1849–1851. doi: 10.1093/carcin/7.11.1849. [DOI] [PubMed] [Google Scholar]
- 4.Abu-Shakra A, Zeiger E. Formation of 8-hydroxy-2′-deoxyguanosine following treatment of 2′-deoxyguanosine or DNA by hydrogen peroxide or glutathione. Mutat. Res. 1997;390:45–50. doi: 10.1016/s0165-1218(96)00164-4. [DOI] [PubMed] [Google Scholar]
- 5.Cadet J, Douki T, Gasparutto D, Ravanat JL. Oxidative damage to DNA: formation, measurement and biochemical features. Mutat. Res. 2003;531:5–23. doi: 10.1016/j.mrfmmm.2003.09.001. [DOI] [PubMed] [Google Scholar]
- 6.Chen Q, Fischer A, Reagan JD, Yan LJ, Ames BN. Oxidative DNA damage and senescence of human diploid fibroblast cells. Proc. Natl Acad. Sci. USA. 1995;92:4337–4341. doi: 10.1073/pnas.92.10.4337. [DOI] [PMC free article] [PubMed] [Google Scholar]
- 7.Wood ML, Dizdaroglu M, Gajewski E, Essigmann JM. Mechanistic studies of ionizing radiation and oxidative mutagenesis: genetic effects of a single 8-hydroxyguanine (7-hydro-8-oxoguanine) residue inserted at a unique site in a viral genome. Biochemistry. 1990;29:7024–7032. doi: 10.1021/bi00482a011. [DOI] [PubMed] [Google Scholar]
- 8.Klungland A, Rosewell I, Hollenbach S, Larsen E, Daly G, Epe B, Seeberg E, Lindahl T, Barnes DE. Accumulation of premutagenic DNA lesions in mice defective in removal of oxidative base damage. Proc. Natl Acad. Sci. USA. 1999;96:13300–13305. doi: 10.1073/pnas.96.23.13300. [DOI] [PMC free article] [PubMed] [Google Scholar]
- 9.Choi JY, Kim HS, Kang HK, Lee DW, Choi EM, Chung MH. Thermolabile 8-hydroxyguanine DNA glycosylase with low activity in senescence accelerated mice due to a single-base mutation. Free Radical Biol. Med. 1999;27:848–854. doi: 10.1016/s0891-5849(99)00141-0. [DOI] [PubMed] [Google Scholar]
- 10.Shibutani S, Takeshita M, Grollman AP. Insertion of specific bases during DNA synthesis past the oxidation-damaged base 8-oxodG. Nature. 1991;349:431–434. doi: 10.1038/349431a0. [DOI] [PubMed] [Google Scholar]
- 11.Yuan F, Zhang Y, Rajpal DK, Wu X, Guo D, Wang M, Taylor JS, Wang Z. Specificity of DNA lesion bypass by the yeast DNA polymerase eta. J. Biol. Chem. 2000;275:8233–8239. doi: 10.1074/jbc.275.11.8233. [DOI] [PubMed] [Google Scholar]
- 12.Zhang Y, Yuan F, Wu X, Wang M, Rechkoblit O, Taylor JS, Geacintov NE, Wang Z. Error-free and error-prone lesion bypass by human DNA polymerase kappa in vitro. Nucleic Acids Res. 2000;28:4138–4146. doi: 10.1093/nar/28.21.4138. [DOI] [PMC free article] [PubMed] [Google Scholar]
- 13.Avkin S, Livneh Z. Efficiency, specificity and DNA polymerase-dependence of translesion replication across the oxidative DNA lesion 8-oxoguanine in human cells. Mutat. Res. 2002;510:81–90. doi: 10.1016/s0027-5107(02)00254-3. [DOI] [PubMed] [Google Scholar]
- 14.Haracska L, Prakash S, Prakash L. Yeast DNA polymerase zeta is an efficient extender of primer ends opposite from 7,8-dihydro-8-Oxoguanine and O6-methylguanine. Mol. Cell Biol. 2003;23:1453–1459. doi: 10.1128/MCB.23.4.1453-1459.2003. [DOI] [PMC free article] [PubMed] [Google Scholar]
- 15.Maga G, Villani G, Crespan E, Wimmer U, Ferrari E, Bertocci B, Hübscher U. 8-Oxo-guanine bypass by human DNA polymerases in the presence of auxiliary proteins. Nature. 2007;447:606–608. doi: 10.1038/nature05843. [DOI] [PubMed] [Google Scholar]
- 16.Mo JY, Maki H, Sekiguchi M. Hydrolytic elimination of a mutagenic nucleotide, 8-oxodGTP, by human 18-kilodalton protein: sanitization of nucleotide pool. Proc. Natl Acad. Sci. USA. 1992;89:11021–11025. doi: 10.1073/pnas.89.22.11021. [DOI] [PMC free article] [PubMed] [Google Scholar]
- 17.Tajiri T, Maki H, Sekiguchi M. Functional cooperation of MutT, MutM and MutY proteins in preventing mutations caused by spontaneous oxidation of guanine nucleotide in Escherichia coli. Mutat. Res. 1995;336:257–267. doi: 10.1016/0921-8777(94)00062-b. [DOI] [PubMed] [Google Scholar]
- 18.Cai JP, Ishibashi T, Takagi Y, Hayakawa H, Sekiguchi M. Mouse MTH2 protein which prevents mutations caused by 8-oxoguanine nucleotides. Biochem. Biophys. Res. Commun. 2003;305:1073–1077. doi: 10.1016/s0006-291x(03)00864-7. [DOI] [PubMed] [Google Scholar]
- 19.Hazra TK, Izumi T, Maidt L, Floyd RA, Mitra S. The presence of two distinct 8-oxoguanine repair enzymes in human cells: their potential complementary roles in preventing mutation. Nucleic Acids Res. 1998;26:5116–5122. doi: 10.1093/nar/26.22.5116. [DOI] [PMC free article] [PubMed] [Google Scholar]
- 20.Auffret van der Kemp P, Thomas D, Barbey RR, DeOliveira R, Boiteux S. Cloning and expression in E. coli of the OGG1 gene of S. cereÍisiae which codes for a DNA glycosylase that excises 7,8-dihydro-8-oxoguanine and 2,6-diamino-4-hydroxy-5-N-methylformamidopyrimidine. Proc. Natl Acad. Sci. USA. 1996;93:5197–5202. doi: 10.1073/pnas.93.11.5197. [DOI] [PMC free article] [PubMed] [Google Scholar]
- 21.Klungland A, Rosewell I, Hollenbach S, Larsen E, Daly G, Epe B, Seeberg E, Lindahl T, Barnes DE. Accumulation of pre-mutagenic DNA lesions in mice defective in removal of oxidative base damage. Proc. Natl Acad. Sci. USA. 1999;96:13300–13305. doi: 10.1073/pnas.96.23.13300. [DOI] [PMC free article] [PubMed] [Google Scholar]
- 22.Bruner SD, Norman DP, Verdine GL. Structural basis for recognition and repair of the endogenous mutagen 8-oxoguanine in DNA. Nature. 2000;403:859–866. doi: 10.1038/35002510. [DOI] [PubMed] [Google Scholar]
- 23.David SS, O'Shea VL, Kundu S. Base-excision repair of oxidative DNA damage. Nature. 2007;447:941–950. doi: 10.1038/nature05978. [DOI] [PMC free article] [PubMed] [Google Scholar]
- 24.Marsin S, Vidal AE, Sossou M, Ménissier-de Murcia J, Le Page F, Boiteux S, de Murcia G, Radicella JP. Role of XRCC1 in the coordination and stimulation of oxidative DNA damage repair initiated by the DNA glycosylase hOGG1. J. Biol. Chem. 2003;278:44068–44074. doi: 10.1074/jbc.M306160200. [DOI] [PubMed] [Google Scholar]
- 25.Lu T, Pan Y, Kao SY, Li C, Kohane I, Chan J, Yankner BA. Gene regulation and DNA damage in the ageing human brain. Nature. 2004;429:883–891. doi: 10.1038/nature02661. [DOI] [PubMed] [Google Scholar]
- 26.Stevnsner T, Thorslund T, de Souza-Pinto NC, Bohr VA. Mitochondrial repair of 8-oxoguanine and changes with aging. Exp. Gerontol. 2002;37:1189–1196. doi: 10.1016/s0531-5565(02)00142-0. [DOI] [PubMed] [Google Scholar]
- 27.D'Errico M, Parlanti E, Dogliotti E. Mechanism of oxidative DNA damage repair and relevance to human pathology. Mutat Res. 2008;659:4–14. doi: 10.1016/j.mrrev.2007.10.003. [DOI] [PubMed] [Google Scholar]
- 28.David SS, O'Shea VL, Kundu S. Base-excision repair of oxidative DNA damage. Nature. 2007;447:941–950. doi: 10.1038/nature05978. [DOI] [PMC free article] [PubMed] [Google Scholar]
- 29.Nakabeppu Y, Sakumi K, Sakamoto K, Tsuchimoto D, Tsuzuki T, Nakatsu Y. Mutagenesis and carcinogenesis caused by the oxidation of nucleic acids. Biol. Chem. 2006;387:373–379. doi: 10.1515/BC.2006.050. [DOI] [PubMed] [Google Scholar]
- 30.Lipscomb LA, Peek ME, Morningstar ML, Verghis SM, Miller EM, Rich A, Essigmann JM, Williams LD. X-ray structure of a DNA 5′-d(CGC-oxoG-AATTCGCG) decamer containing 7,8-dihydro-8-oxoguanine. Proc. Natl Acad. Sci. USA. 1995;92:719–723. doi: 10.1073/pnas.92.3.719. [DOI] [PMC free article] [PubMed] [Google Scholar]
- 31.Oda Y, Uesugi S, Ikehara M, Nishimura S, Kawase Y, Ishikawa H, Inoue H, Ohtsuka E. NMR studies of a DNA containing 8-hydroxydeoxyguanosine. Nucleic Acids Res. 1991;19:1407–1412. doi: 10.1093/nar/19.7.1407. [DOI] [PMC free article] [PubMed] [Google Scholar]
- 32.Plum GE, Grollman AP, Johnson F, Breslauer KJ. Influence of the oxidatively damaged adduct 8-oxodeoxyguanosine on the conformation, energetics, and thermodynamic stability of a DNA duplex. Biochemistry. 1995;34:16148–16160. doi: 10.1021/bi00049a030. [DOI] [PubMed] [Google Scholar]
- 33.Gannett PM, Sura TP. Base pairing of 8-oxoguanosine and 8-oxo-2′-deoxyguanosine with 2′-deoxyadenosine, 2′-deoxycytosine, 2′-deoxyguanosine, and thymidine. Chem. Res. Toxicol. 1993;6:690–700. doi: 10.1021/tx00035a015. [DOI] [PubMed] [Google Scholar]
- 34.Qi Y, Spong MC, Nam K, Banerjee A, Jiralerspong S, Karplus M, Verdine GL. Encounter and extrusion of an intrahelical lesion by a DNA repair enzyme. Nature. 2009;462:762–766. doi: 10.1038/nature08561. [DOI] [PMC free article] [PubMed] [Google Scholar]
- 35.Qi Y, Spong MC, Nam K, Karplus M, Verdine GL. Entrapment and structure of an extrahelical guanine attempting to enter the active site of a bacterial DNA glycosylase, MutM. J. Biol. Chem. 2010;285:1468–1478. doi: 10.1074/jbc.M109.069799. [DOI] [PMC free article] [PubMed] [Google Scholar]
- 36.Banerjee A, Verdine GL. A nucleobase lesion remodels the interaction of its normal neighbor in a DNA glycosylase complex. Proc. Natl Acad. Sci. USA. 2006;103:15020–15025. doi: 10.1073/pnas.0603644103. [DOI] [PMC free article] [PubMed] [Google Scholar]
- 37.Blainey PC, van Oijen AM, Banerjee A, Verdine GL, Xie XS. A base-excision DNA-repair protein finds intrahelical lesion bases by fast sliding in contact with DNA. Proc. Natl Acad. Sci. USA. 2006;103:5752–5727. doi: 10.1073/pnas.0509723103. [DOI] [PMC free article] [PubMed] [Google Scholar]
- 38.Parker JB, Bianchet MA, Krosky DJ, Friedman JI, Amzel LM, Stivers JT. Enzymatic capture of an extrahelical thymine in the search for uracil in DNA. Nature. 2007;449:433–437. doi: 10.1038/nature06131. [DOI] [PMC free article] [PubMed] [Google Scholar]
- 39.Porecha RH, Stivers JT. Uracil DNA glycosylase uses DNA hopping and short-range sliding to trap extrahelical uracils. Proc. Natl Acad. Sci. USA. 2008;105:10791–10796. doi: 10.1073/pnas.0801612105. [DOI] [PMC free article] [PubMed] [Google Scholar]
- 40.Friedman JI, Majumdar A, Stivers JT. Nontarget DNA binding shapes the dynamic landscape for enzymatic recognition of DNA damage. Nucleic Acids Res. 2009;37:3493–3500. doi: 10.1093/nar/gkp161. [DOI] [PMC free article] [PubMed] [Google Scholar]
- 41.Cao C, Jiang YL, Stivers JT, Song F. Dynamic opening of DNA during the enzymatic search for a damaged base. Nat. Struct. Mol. Biol. 2004;11:1230–1236. doi: 10.1038/nsmb864. [DOI] [PubMed] [Google Scholar]
- 42.Ganguly M, Wang F, Kaushik M, Stone MP, Marky LA, Gold B. A study of 7-deaza-2′-deoxyguanosine 2′-deoxycytidine base pairing in DNA. Nucleic Acids Res. 2007;35:6181–6195. doi: 10.1093/nar/gkm670. [DOI] [PMC free article] [PubMed] [Google Scholar]
- 43.Wang F, Li F, Ganguly M, Marky LA, Gold B, Egli M, Stone MP. A bridging water anchors the tethered 5-(3-aminopropyl)-2′-deoxyuridine amine in the DNA major groove proximate to the N + 2 C.G base pair: implications for formation of interstrand 5′-GNC-3′ cross-links by nitrogen mustards. Biochemistry. 2008;47:7147–7157. doi: 10.1021/bi800375m. [DOI] [PMC free article] [PubMed] [Google Scholar]
- 44.Cantor CR, Warshow MM, Shapiro H. Oligonucleotide interactions. 3. Circular dichroism studies of the conformation of deoxyoligonucleotides. Biopolymers. 1970;9:1059–1077. doi: 10.1002/bip.1970.360090909. [DOI] [PubMed] [Google Scholar]
- 45.Marky LA, Blumenfeld KS, Kozlowski S, Breslauer KJ. Salt-dependent conformational transitions in the self-complementary deoxydodecanucleotide d(CGCGAATTCGCG): evidence for hairpin formation. Biopolymers. 1983;22:1247–1257. doi: 10.1002/bip.360220416. [DOI] [PubMed] [Google Scholar]
- 46.Marky LA, Breslauer KJ. Calculating thermodynamic data for transitions of any molecularity from equilibrium melting curves. Biopolymers. 1987;26:1601–1620. doi: 10.1002/bip.360260911. [DOI] [PubMed] [Google Scholar]
- 47.Kaushik M, Suehl N, Marky LA. Calorimetric unfolding of the bimolecular and i-motif complexes of the human telomere complementary strand, d(C3TA2)4. Biophys Chem. 2007;126:154–164. doi: 10.1016/j.bpc.2006.05.031. [DOI] [PubMed] [Google Scholar]
- 48.Cantor CR, Schimmel PR. Biophysical Chemistry. New York: W.H. Freeman and Company; 1980. [Google Scholar]
- 49.Olsen CM, Marky LA. Monitoring the temperature unfolding of G-quadruplexes by UV and circular dichroism spectroscopies and calorimetry techniques. Methods Mol. Biol. 2010;608:147–158. doi: 10.1007/978-1-59745-363-9_10. [DOI] [PubMed] [Google Scholar]
- 50.Rayan G, Tsamaloukas AD, Macgregor RB, Jr, Heerklotz H. Helix-coil transition of DNA monitored by pressure perturbation calorimetry. J. Phys. Chem. B. 2009;113:1738–1742. doi: 10.1021/jp808253t. [DOI] [PubMed] [Google Scholar]
- 51.Dragan AI, Russell DJ, Privalov PL. DNA hydration studied by pressure perturbation scanning microcalorimetry. Biopolymers. 2009;91:95–101. doi: 10.1002/bip.21088. [DOI] [PubMed] [Google Scholar]
- 52.Olsen CM, Marky LA. Energetic and hydration contributions of the removal of methyl groups from thymine to form uracil in G-quadruplexes. J. Phys. Chem. B. 2009;113:9–11. doi: 10.1021/jp808526d. [DOI] [PubMed] [Google Scholar]
- 53.Millero FJ. The partial molal volumes of electrolytes in aqueous solution in structure and transport processes in water and aqueous solutions. In: Home RA, editor. Water and Aqueous Solutions. New York: Wiley; 1972. pp. 519–595. [Google Scholar]
- 54.Fehlauer H, Wolf H. Compressibility measurements using an oscillation-type density meter. Meas. Sci. Technol. 2006;17:2593–2596. [Google Scholar]
- 55.Wagner R, Berger S. Gradient-selected NOESY - A fourfold reduction of the measurement time form the NOESY experiment. J. Magn. Reson. A. 1996;123:119–121. doi: 10.1006/jmra.1996.0222. [DOI] [PubMed] [Google Scholar]
- 56.Jeener J, Meier BH, Bachmann P, Ernst RR. Investigation of exchange processes by two-dimensional NMR spectroscopy. J. Chem. Phys. 1979;71:4546–4553. [Google Scholar]
- 57.Piotto M, Saudek V, Sklenar V. Gradient-tailored excitation for single-quantum NMR spectroscopy of aqueous solutions. J. Biomol. NMR. 1992;2:661–665. doi: 10.1007/BF02192855. [DOI] [PubMed] [Google Scholar]
- 58.Spink CH, Chaires JB. Effects of hydration, ion release, and excluded volume on the melting of triplex and duplex DNA. Biochemistry. 1999;38:496–508. doi: 10.1021/bi9820154. [DOI] [PubMed] [Google Scholar]
- 59.Plum GE, Breslauer KJ. DNA lesions. A thermodynamic perspective. Ann. NY Acad. Sci. 1994;726:45–55. doi: 10.1111/j.1749-6632.1994.tb52796.x. [DOI] [PubMed] [Google Scholar]
- 60.Schneider B, Patel K, Berman HM. Hydration of the phosphate group in double-helical DNA. Biophys. J. 1998;75:2422–2434. doi: 10.1016/S0006-3495(98)77686-6. [DOI] [PMC free article] [PubMed] [Google Scholar]
- 61.Auffinger P, Westhof E. Water and ion binding around RNA and DNA (C,G) oligomers. J. Mol. Biol. 2000;300:1113–1131. doi: 10.1006/jmbi.2000.3894. [DOI] [PubMed] [Google Scholar]
- 62.Kopka ML, Fratini AV, Drew HR, Dickerson RE. Ordered water structure around a B-DNA dodecamer. A quantitative study. J. Mol. Biol. 1983;163:129–146. doi: 10.1016/0022-2836(83)90033-5. [DOI] [PubMed] [Google Scholar]
- 63.Shui X, McFail-Isom L, Hu GG, Williams LD. The B-DNA dodecamer at high resolution reveals a spine of water on sodium. Biochemistry. 1998;37:8341–8355. doi: 10.1021/bi973073c. [DOI] [PubMed] [Google Scholar]
- 64.Soler-López M, Malinina L, Liu J, Huynh-Dinh T, Subirana JA. Water and ions in a high resolution structure of B-DNA. J. Biol. Chem. 1999;274:23683–23686. doi: 10.1074/jbc.274.34.23683. [DOI] [PubMed] [Google Scholar]
- 65.Lipscomb LA, Zhou FX, Williams LD. Clathrate hydrates are poor models of biomolecule hydration. Biopolymers. 1995;38:177–181. doi: 10.1002/(sici)1097-0282(199602)38:2<177::aid-bip4>3.0.co;2-s. [DOI] [PubMed] [Google Scholar]
- 66.Buckin VA, Kankiya BI, Bulichov NV, Lebedev AV, Gukovsky VP, Sarvazyan AP, Williams AR. Measurement of anomalously high hydration of (dA)n.(dT) in double helices in dilute solution. Nature. 1989;340:321–322. doi: 10.1038/340321a0. [DOI] [PubMed] [Google Scholar]
- 67.Saenger W. In Principles of Nucleic Acid Structure. New York: Springer; 1984. pp. 368–384. [Google Scholar]
- 68.Marky LA, Kupke DW. Probing the hydration of the minor groove of A•T synthetic DNA polymers by volume and heat changes. Biochemistry. 1989;28:9982. doi: 10.1021/bi00452a016. [DOI] [PubMed] [Google Scholar]
- 69.Zieba K, Shu TM, Kupke DW, Marky LA. Differential hydration of dA•dT base pairing and dA, dT bulges in deoxyoligonucleotides. Biochemistry. 1991;30:8018–8026. doi: 10.1021/bi00246a020. [DOI] [PubMed] [Google Scholar]
- 70.Marky LA, Rentzeperis D, Luneva NP, Cosman M, Geacintov NE, Kupke DW. Differential hydration thermodynamics of stereoisomeric DNA-benzo[a]pyrene adducts derived from diol epoxide enantiomers with different tumorigenic potentials. J. Am. Chem. Soc. 1996;118:3804–3810. [Google Scholar]
- 71.Marky LA, Kupke DW. Enthalpy-entropy compensation in nucleic acids: contribution of electrostriction and structural hydration. Methods Enzymol. 2000;323:419–441. doi: 10.1016/s0076-6879(00)23376-4. [DOI] [PubMed] [Google Scholar]
- 72.Olsen CM, Marky LA. Energetic and hydration contributions of the removal of methyl groups from thymine to form uracil in G-quadruplexes. J. Phys. Chem. B. 2009;113:9–11. doi: 10.1021/jp808526d. [DOI] [PubMed] [Google Scholar]
- 73.Howerton SB, Nagpal A, Williams LD. Surprising roles of electrostatic interactions in DNA-ligand complexes. Biopolymers. 2003;69:87–99. doi: 10.1002/bip.10319. [DOI] [PubMed] [Google Scholar]
- 74.Howerton SB, Sines CC, VanDerveer D, Williams LD. Locating monovalent cations in the grooves of B-DNA. Biochemistry. 2001;40:10023–10031. doi: 10.1021/bi010391+. [DOI] [PubMed] [Google Scholar]
- 75.Ganguly M, Wang RW, Marky LA, Gold B. Introduction of cationic charge into DNA near the major groove edge of a guanine-cytosine base pair: characterization of oligodeoxynucleotides substituted with 7-aminomethyl-7-deaza-2′-deoxyguanosine. J. Am. Chem. Soc. 2009;131:12068–12069. doi: 10.1021/ja904930p. [DOI] [PMC free article] [PubMed] [Google Scholar]
Associated Data
This section collects any data citations, data availability statements, or supplementary materials included in this article.


