

Abstract
Aims
Hypoxia has been implicated as a cause of adipose tissue inflammation in obesity, although the inflammatory response of human adipose tissue to hypoxia is not well understood. The goal of this study was to define in vitro inflammatory responses of human adipose tissue to hypoxia and identify molecular mechanisms of hypoxia-induced inflammation.
Methods
The inflammatory milieu and responses of visceral (VAT) and subcutaneous (SAT) adipose tissue explants and purified stromovascular cells (SVFs) from obese and lean humans were studied in an in vitro hypoxic culture system using quantitative real-time PCR, ELISA, western blotting, immunofluorescence microscopy, flow cytometry and immunohistochemistry.
Results
Human adipose tissue in obesity demonstrates an increased leucocyte infiltrate that is greater in VAT than SAT and involves macrophages, T cells and natural killer (NK) cells. Hypoxic culture regulates inflammatory cytokine secretion and transcription of metabolic stress response genes in human adipose tissue SVF. Adipocyte diameter is increased and adipose tissue capillary density is decreased in obese participants. Inhibition of c-Jun terminal kinase (JNK) or p38 significantly attenuates hypoxia-induced SVF inflammatory responses. Hypoxia induces phosphorylation of p38 in adipose tissue.
Conclusions
Human adipose tissue in obesity is characterised by a depot-specific inflammatory cell infiltrate that involves not only macrophages, but also T cells and NK cells. Hypoxia induces inflammatory cytokine secretion by human adipose tissue SVF, the primary source of which is adipose tissue macrophages. These data implicate p38 in the regulation of hypoxia-induced inflammation and suggest that alterations in adipocyte diameter and adipose tissue capillary density may be potential underlying causes of adipose tissue hypoxia.
Keywords: Adipose tissue, Hypoxia, Inflammation, JNK, Macrophage, Obesity, p38, T cell
Introduction
Adipose tissue inflammation underlies the pathogenesis of multiple comorbidities of obesity including diabetes. Hypoxia is a potential cause of adipose tissue inflammation, and increased adipocyte size and decreased adipose tissue blood flow have been implicated as possible mechanisms [1, 2]. Adipose tissue is comprised not only of adipocytes, but also a stromovascular cell fraction (SVF), over half of which consists of leucocytes, including adipose tissue macrophages (ATMs), T cells, and natural killer (NK) cells. The SVF is a dominant source of inflammatory cytokines within adipose tissue [3–10], and is therefore an appropriate target for the study of mechanisms underlying hypoxia-induced inflammation.
Despite data implicating adipose tissue hypoxia in obesity and metabolic disease, hypoxia-induced inflammatory responses in human adipose tissue and adipose tissue SVFs are not well understood. Activation of mitogen activated protein kinase (MAPK) signalling pathways and endoplasmic reticulum stress (ERS) have been implicated in hypoxia-induced inflammation in adipose and other tissues [11–13] and in metabolic disease [1, 2, 14–16]. Based on these previous data, we hypothesised that hypoxia would induce a proinflammatory cytokine response in human adipose tissue, together with activation of MAPK and ERS-related genes. The goal of this study was to characterise cytokine and cellular stress gene responses to hypoxia in the human adipose tissue SVF, and to identify molecular mediators of hypoxia-induced inflammation within adipose tissue that might serve as targets for further research.
Methods
Participants
Obese participants undergoing laparoscopic bariatric surgery and lean participants undergoing abdominal surgery (fundoplication for reflux disease [n=12], cholecystectomy for gallstone disease [n=1], colectomy for quiescent diverticulitis [n=7] or stage I colon cancer [n=1]) were enrolled and consent was obtained, with Institutional Review Board approval consistent with applicable institutional and governmental regulations concerning the ethics of human volunteers. Obese participants met the National Institutes of Health (NIH) criteria for surgery [17]. Visceral adipose tissue (VAT) from the greater omentum and subcutaneous adipose tissue (SAT) from the abdominal wall were harvested at the beginning of the operation and processed immediately.
Tissues were collected from a total of 56 obese and 21 lean volunteers. The mean age for obese participants was 44±12 (SD)years and mean BMI was 51±8 kg/m2 (SD); 85% of obese participants were female. The mean age for lean participants was 46±12 years (SD) and mean BMI was 24±3 kg/m2 (SD); 38% of lean participants were female. The prevalence of diabetes, hypertension, sleep apnoea and hyperlipidaemia were 39%, 58%, 67% and 48%, respectively, in obese participants, and 0%, 11%, 0% and 4% in lean participants. Medications in obese volunteers included angiotensin converting enzyme inhibitor (21%), statin (14%), proton pump inhibitor (16%), H2 antagonist (14%), NSAID (18%), beta antagonist (14%), metformin (26%) and aspirin (28%). Medications in lean volunteers included angiotensin converting enzyme inhibitor (7%), statin (0%), proton pump inhibitor (33%), H2 antagonist (9%), NSAID (7%), beta antagonist (0%), metformin (0%) and aspirin (4%). There were no differences in comorbidities, medications, age or sex between obese or lean participant groups used for different experiments. Age was similar between lean and obese participants, but there were more men in the lean group than in the obese group (p=0.002).
SVF and adipose tissue isolation and culture
All media and reagents were certified to have endotoxin levels less than 0.030 endotoxin units (EU)/ml. Vessels were dissected from adipose tissue, which was washed in PBS+4% BSA, minced and digested with type II collagenase (175 units/ml in PBS+2% BSA, Gibco, Carlsbad, CA, USA) for 60 min at 37°C with gentle agitation followed by centrifugation at 200×g for 10 min. The SVF cell pellet was retrieved and washed. One million SVF cells or 10 mg of human VAT were cultured in 1 ml of RPMI+10% fetal calf serum for 24 h in standard culture conditions with 21% O2 and 5% CO2 (normoxia) or hypoxic conditions (1% O2, 5% CO2), for which cells were placed in a Billups– Rothenberg chamber (Billups-Rothenberg, del Mar, CA, USA) infused with 1%O2 and 5%CO2 at 37°C. The c-Jun terminal kinase (JNK) inhibitor SP6000125 and the p38 inhibitor SB202190 (Sigma-Aldrich, St Louis, MO, USA) were used at 10 μmol/l [18, 19]. Flow cytometry analysis with viable dye confirmed viability of >90% at 24 h for SVF cultures.
Immunohistochemistry
Sections of formalin-fixed, paraffin-embedded adipose tissue (5 μm) were deparaffinised with xylene and graded alcohols into deionised water, placed in citrate buffer solution pH 6.0 (Target Retrieval Solution, Dako, Carpinteria, CA, USA), heated in a pressure cooker for 10 min, quenched with 3% H2O2 in methanol in a humidifying chamber, rinsed in tris-buffered saline (TBS), and incubated for 20 min at 25°C with 2.5% normal horse serum (Vector Laboratories, Burlingame, CA, USA). CD34 antibody (1:3200 dilution of Clone QBEnd10; Dako), CD68 antibody (clone KP1), or CD3 antibody (clone 2GV6) (Ventana Medical Systems, Tucson, AZ, USA) were added for 1 h, then slides were rinsed in TBS. Detection was performed with the ImmPress peroxidase kit (Vector Laboratories) with a final 4 min reaction in 3,3′-diaminobenzidine (DAB) solution (Dako) and haematoxylin counterstaining. Stained cells and adipocytes were counted for ten 40× fields for each slide for ATM and T cells, and ten 20× fields for endothelial cells, by two blinded observers.
Flow cytometry
CD14 antibody was chosen for flow cytometry analysis of ATM because CD68 is primarily an intracellular protein. Cells were incubated with appropriate antibodies (CD14-APC-Cy7, CD3-PE, CD4-PE-Cy7, CD8-APC, CD45-PE-Cy5.5, CD56-PE [eBiosciences, San Diego, CA, USA]) for 30 min, washed with PBS, 0.5%, BSA, 0.1% NaN3, fixed with Cytofix/Perm solution and analysed on an LSR II flow cytometer (BD, Franklin Lakes, NJ, USA). Data were analysed using FlowJo software (Tree Star, Ashland, OR, USA) after exclusion of doublets and non-viable cells using viable dye (Invitrogen, Carlsbad, CA, USA). Post-acquisition compensation, isotype controls and fluorescence minus one gating were used to determine gates. After excluding doublets and non-viable cells, a large forward and side scatter gate was used to include all viable cells, followed by gating on cells expressing the pan-leucocyte marker CD45, followed by gating on cell populations of interest (Fig. 1c).
Fig. 1.
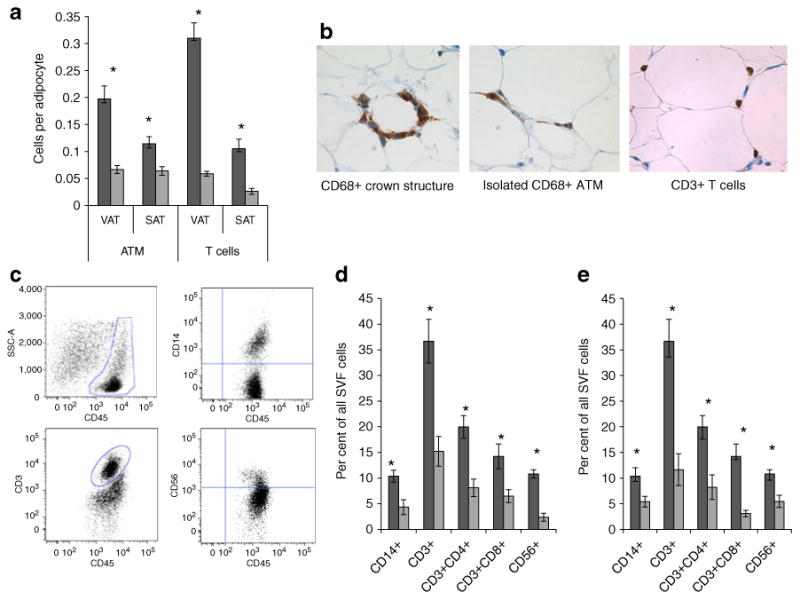
Inflammatory cell infiltrates in human adipose tissue. a Immunohistochemistry studying leucocyte ATM (CD68+) and T cell (CD3+) numbers in matched VAT and SAT specimens from nine obese and eight lean participants. The ordinate shows the number of cells per adipocyte counted in at least ten 40× fields per specimen. Differences between obese and lean participants were significant for all cell subpopulations in both depots (p<0.002 in all cases, independent t test, *p<0.002). Differences between VAT and SAT were statistically significant in all cases in the obese cohort (p<0.003, paired t test). Differences between VAT and SAT were statistically significant for T cells but not ATMs in the lean cohort (p=0.003 and 0.861 respectively, paired t test). Dark grey bars, obese participants; light grey bars, lean participants. b Representative photomicrographs of immunohistochemistry of obese VAT for ATMs (CD68) and T cells (CD3). c Representative flow cytometry dot plots of CD45+ cells within all SVF cells plotted against side-scatter area, and ATM (CD14+), T cell (CD3+) and NK cell (CD56+) subpopulations within the CD45+ gate. CD4+ and CD8+ cells formed discrete subpopulations within the CD3+ gate (data not shown). d Comparison of ATM, NK cell and T cell subpopulation frequencies within VAT SVF between nine obese and six lean participants. Leucocyte subpopulation frequencies (ordinate) are expressed as per cent of each subpopulation within all SVF cells and were calculated by multiplying the frequency of each cell population by the parent CD45+ gate frequencies for CD14+, CD3+ and CD56+ cells, and by the CD45+ and CD3+ gate frequencies for CD3+CD4+ and CD3+CD8+ T cell subpopulations. The ordinate shows per cent of each subpopulation within all SVFs. Error bars show SEM. *p<0.050 comparing obese VAT SVF vs lean VAT SVF for each cell subpopulation, independent t test. Dark grey bars, obese participants; light grey bars, lean participants. e Comparison of ATM, NK cell, and T cell subpopulation frequencies between VAT and SAT SVF within the obese cohort (n=9). The ordinate shows per cent of each subpopulation within all SVFs. Error bars show SEM. *p<0.05 comparing obese VAT vs obese SAT for each cell subpopulation, paired t test Dark grey bars, VAT SVF; light grey bars, SAT SVF
Magnetic bead sorting
SVF underwent two rounds of sorting with anti-human CD14 antibody-coated beads (Miltenyi Biotec, Bergisch Gladbach, Germany) according to the manufacturer's instructions. Flow cytometry demonstrated a mean enrichment of CD14+ cells from a mean of 18% CD14+ cells within bulk SVF to a mean of 82% CD14+ cells within CD14-enriched fractions and <1% CD14+ cells within the CD14-depleted fractions. Virtually all CD3+ T cells and CD56+ NK cells remained in the depleted fraction. Experiments performed by the manufacturer and our laboratory demonstrate that CD14-beads alone do not stimulate cytokine production. One million sorted (enriched or depleted) or bulk cells were cultured in 1 ml of media for 24 h in normoxic and hypoxic conditions.
Cytokine ELISA
ELISA of cell culture supernatant fractions was performed using standard cytokine-specific ELISA kits (Biolegend, San Diego, CA, USA) following the manufacturer's instructions. Standard curves were generated and samples were run in triplicate. Limits of detection for all ELISAs were 2–100 pg/ml. Appropriate dilutions were used for supernatant fractions above the upper limits of detection.
Quantitative real-time PCR (QRTPCR)
RNA was prepared from 1×10⁶ SVF cells using an RNeasy lipid kit (Qiagen, Germantown, MD, USA) and treated with DNase. Equal amounts of input RNA were used for all reactions, normalising results by amount of input RNA. RNA was reverse-transcribed using random hexamer primers. QRTPCR was performed using SYBR Green reagent and transcript-specific primers using an ABI7900 thermocycler (Applied Biosystems, Foster City, CA, USA). Glyceraldehyde-3-phosphate dehydrogenase (GAPDH) and actin were used as endogenous controls and provided similar results in all cases. Fold changes relative to actin are reported. The 2−ΔΔCt relative quantification method was used to calculate fold difference in transcript levels between samples; efficiencies of amplification for all primer pairs were verified to be equivalent over a range of template concentrations. Primer sequences are provided in the electronic supplementary material (ESM).
Western blotting
Tissue protein lysates in radioimmunoprecipitation (RIPA) buffer (50–100 μg) were loaded on a 10% SDS-PAGE gel for electrophoresis then transferred to polyvinylidene fluoride (PVDF) membrane. Membranes were blocked in tris-buffered saline Tween-20 (TBST)+5% skimmed milk for 1 h at 25°C, washed three times in TBST, then incubated with primary antibodies specific for phosphorylated or total JNK 1/2 or p38 (Cell Signaling Technologies, Beverly, MA, USA) or hypoxia-inducible factor 1, alpha subunit (HIF-1α) and actin (R&D Systems, Minneapolis, MN, USA) in TBST+5% skimmed milk for 12 h at 4°C. Membranes were washed three times in TBST and incubated with IRDye800-conjugated goat anti-rabbit IgG (Rockland Immunochemicals, Gilbertsville, PA, USA) and Alexa Fluor 700-conjugated goat anti-mouse IgG (Invitrogen, Carlsbad, CA, USA) secondary antibodies in TBST+5% skimmed milk for 1 h at 25°C, then washed three times. For HIF-1α, peak production was observed at 4–6 h of culture, with waning levels at 24 h of culture (data not shown); data was analysed at the 4 h time-point. Western blotting lysates were immunoprecipitated with antibody to HIF-1α (R&D Systems) prior to loading on gels. For p38 and JNK, immunoprecipitation was not necessary and peak production and phosphorylation levels were observed at 24 h and data is reported at this time-point. For HIF-1α, blots were stripped and reprobed with actin specific antibody (R&D Systems), and data are reported as actin-normalised HIF-1α levels, i.e. [HIF-1α, hypoxia/actin, hypoxia]//[HIF-1α, normoxia/actin, normoxia]. For JNK and p38, data is reported as relative phosphorylation, i.e. [phosphorylated protein, hypoxia/phosphorylated protein, normoxia]//[total protein, hypoxia/total protein, normoxia]. Finally, fresh (not cultured) VAT lysates were prepared immediately after tissue harvest from lean (n=7) and obese (n=8) participants and analysed with sequential western blotting using HIF-1α and actin antibodies as described above. Data from these blots were normalised to actin and reported as described above. Densitometry was performed using an Odyssey Infrared Imaging System and software (LI-COR Biosciences, Lincoln, NE, USA).
Adipocyte sizing
Minced whole adipose tissue explants were incubated in DMEM with 0.5%BSA at 5%CO2, 37°C for 2 h, followed by addition of 1 μl of 2.5 μmol/l C1-BODIPY 500/510 C12 (Invitrogen) and incubation for 1 h. Explants were washed in PBS, mounted on a slide and visualised using a Leica DM4000 B imaging system with 488 nm excitation and recorded at an emission wavelength of 500–550 nm (Leica Microsystems, Wetzlar, Germany). Photographs were digitised using Leica Applications Suite 2.7.1 software. Diameters were measured by a blinded observer on a minimum of 150 adipocytes per specimen using ImageJ software (W.S. Rasband, ImageJ, NIH, Bethesda, MD, USA; http://rsb.info.nih.gov/ij/, 1997–2009).
Statistical analysis
All statistical tests were two-tailed. All data were normally distributed. Because of limited tissue and cell yields, different experiments used tissue from different groups of volunteers. ANOVA was used to compare continuous variables between groups (age, BMI) and the χ2 test was used to compare dichotomous variables between groups (comorbidities, medications and sex). Delta cycle threshold (dCT) values were compared for statistical analysis of QRTPCR data. Paired t tests were used to compare QRTPCR and ELISA data between paired VAT and SAT specimens within obese participant cohorts and between normoxic and hypoxic arms or media and SP6000125 or SB202190-treated arms of in vitro cultures. Independent t tests were used to compare obese and lean cohorts.
Results
Human adipose tissue in obesity is characterised by a leucocyte infiltrate and elevated basal SVF inflammatory cytokine secretion
Immunohistochemistry with CD68 (macrophage) and CD3 (T cell) antibodies demonstrated an increased number of ATMs and T cells in obese, compared with lean, adipose tissue within both depots, and in VAT relative to SAT within obese participants (Fig. 1a). Crown-like structures of macrophages were observed in obese, but not lean, adipose tissues, together with isolated ATMs. T cells were evenly distributed (Fig. 1b). Flow cytometry phenotyping demonstrated that multiple leucocyte subpopulations, including ATM (CD14+), CD4+ and CD8+ T cell (CD3+) subsets, and NK cells (CD56+) were increased in frequency in obese VAT SVF relative to lean VAT SVF, and in obese VAT relative to obese SAT (Fig. 1c–e).
In order to functionally characterise this inflammatory cell infiltrate, we studied in vitro basal cytokine secretion in purified SVF. Consistent with the observed increased leucocyte infiltrate, SVF from obese compared with lean participants demonstrated increased secretion of TNF-α, IL-6, IL-10, and CCL-2 (Fig. 2a–d). Cytokine secretion levels were similar between VAT SVF and SAT SVF within the obese cohort (Fig. 2e–h).
Fig. 2.

Basal cytokine secretion in human adipose tissue SVF. a–d VAT SVFs from nine obese participants and eight lean participants were cultured for 24 h in standard tissue culture conditions and supernatant fractions studied with ELISA. p values compare data from obese vs lean individuals using independent t test. Note different scales for ordinates. Error bars show SEM. Comparing obese vs lean individuals: ap=0.020, bp=0.002, cp=0.016, dp=0.030. e–h Matched VAT and SAT SVFs from eight obese participants were cultured in standard tissue culture conditions and supernatant fractions studied with ELISA; p values compare VAT vs SAT within the obese cohort using paired t test: ep=0.223, fp=0.189, gp=0.119, hp=0.220. Note different scales for ordinates. Error bars show SEM
Hypoxia induces inflammatory cytokine secretion by ATM in adipose tissue SVF
We next studied the effect of hypoxia on cytokine secretion in VAT SVF from obese participants and sought to determine the cellular source of cytokines within SVF. Bulk SVF, together with matched CD14-enriched and CD14-depleted SVF fractions, was cultured for 24 h in normoxic or hypoxic conditions and supernatant fractions were studied with ELISA. In bulk SVF, TNF-α secretion was increased and IL-10 and chemokine (C-C motif) ligand 2 (CCL2) secretion were decreased in response to hypoxia, while IL-6 secretion was unchanged. These effects were magnified in CD14-enriched SVF and absent in CD14-depleted SVF, demonstrating that ATMs are the dominant source of inflammatory cytokines in both normoxic and hypoxic conditions (Fig. 3). Responses were similar in SAT SVF from obese participants, and in VAT SVF from lean participants, but of lower orders of magnitude that did not reach statistical significance (data not shown). Shorter culture times of 6 and 12 h demonstrated a similar pattern of cytokine production to 24 h, but with lower overall production levels consistent with production and accumulation of cytokine in the culture supernatant fractions over the culture period (data not shown).
Fig. 3.

Hypoxia-induced cytokine responses in obese human VAT SVF. Bulk VAT SVF and matched CD14-enriched (CD14+) and CD14-depleted (CD14−) cell fractions from ten obese participants were cultured (1,000,000 cells in 1 ml of media) for 24 h in normoxic (standard tissue culture conditions, 21% O2, 5% CO2) or hypoxic (1% O2, 5% CO2) conditions and supernatant fractions harvested and studied using ELISA. Similar data from SAT SVF from the same ten obese participants, and VAT SVF from eight lean participants demonstrate that hypoxia does not upregulate SVF cytokine secretion in these tissues (data not shown). *p<0.05 derived from paired t test comparing normoxic vs hypoxic conditions within each cell population. Note different scales for ordinates. Error bars show SEM. Dark grey bars, hypoxic conditions; light grey bars, normoxic conditions
Hypoxia induces transcription of metabolic stress response genes in obese VAT SVF
We next studied transcriptional responses of a panel of cellular stress response genes to hypoxic challenge in adipose tissue SVF in order to identify potential underlying molecular mechanisms of hypoxia-induced inflammatory responses. Obese VAT SVFs were cultured in hypoxic or normoxic conditions for 24 h and RNA studied with QRTPCR. Hypoxic culture increased transcript levels of GLUT1, VEGF (also known as VEGFA), PERK (also known as EIF2AK3), C-JUN (also known as JUN), ATF2 and UCP1 (Fig. 4). Expression of ATF6, HSPA5, IKKβ (also known as IKBKB) and IRE-1 were not altered by hypoxic culture. While trends were similar in SAT SVFs from obese participants, only an increase in GLUT1 transcription approached, but did not reach, statistical significance (3.86-fold increase, p=0.075). Hypoxic culture induced transcription of only GLUT1 in VAT SVFs from lean participants (n=8, 8.06-fold increase, p<0.001).
Fig. 4.

Obese VAT SVF transcriptional responses to hypoxic culture. RNA was prepared from VAT SVF from ten obese participants cultured in hypoxic or normoxic conditions for 24 h and subject to QRTPCR analysis. The ordinate shows fold difference in transcript level in hypoxic culture relative to normoxic culture referent. *p<0.05 derived from paired t tests of ΔCt values comparing hypoxic vs normoxic cultures for matched SVF specimens. Error bars show SEM. Similar data from matched SAT SVF from the same ten obese participants, and from VAT SVF from eight lean participants demonstrate that hypoxia did not induce upregulation of any transcripts studied except for GLUT1 in lean VAT SVF (data not shown, see the Results for details)
JNK and p38 inhibition attenuates cytokine secretion in response to hypoxic culture, and hypoxia induces upregulation of HIF-1α and phosphorylation of p38, but not JNK, in human adipose tissue
VAT SVFs from obese participants were cultured in normoxic or hypoxic conditions with or without the JNK inhibitor SP6000125 or the p38 inhibitor SB202190 for 24 h and supernatant fractions were studied using ELISA. JNK and p38 inhibition each decreased hypoxia-induced secretion of all cytokines studied (Fig. 5). We next studied p38 and JNK phosphorylation in response to hypoxia. Low protein yields precluded this analysis in purified SVF, but sufficient quantities of protein were isolated from whole VAT explants from obese participants. Hypoxia induced phosphorylation of p38 but not JNK in adipose tissue explants (Fig. 6). Upregulation of HIF-1α by hypoxic culture was observed (Fig. 6a), with a mean 1.30-fold upregulation (p=0.030, independent t test). No differences in basal HIF-1α levels were observed in obese, compared with lean, VAT lysates subject to western blotting analysis immediately after collection (p=0.487, independent t test).
Fig. 5.

JNK or p38 inhibition attenuates hypoxia-induced inflammatory cytokine secretion in VAT SVF. VAT SVFs from eight obese participants were cultured in normoxic or hypoxic conditions with or without the JNK inhibitor SP6000125 or with or without the p38 inhibitor SB202190 for 24 h. Supernatant fractions were studied using ELISA. *p<0.05, derived from paired t tests comparing matched culture arms between (hypoxia) and (hypoxia+JNK inhibitor), or (hypoxia) and (hypoxia+p38 inhibitor). Note different scales in ordinates represented in pg/ml
Fig. 6.
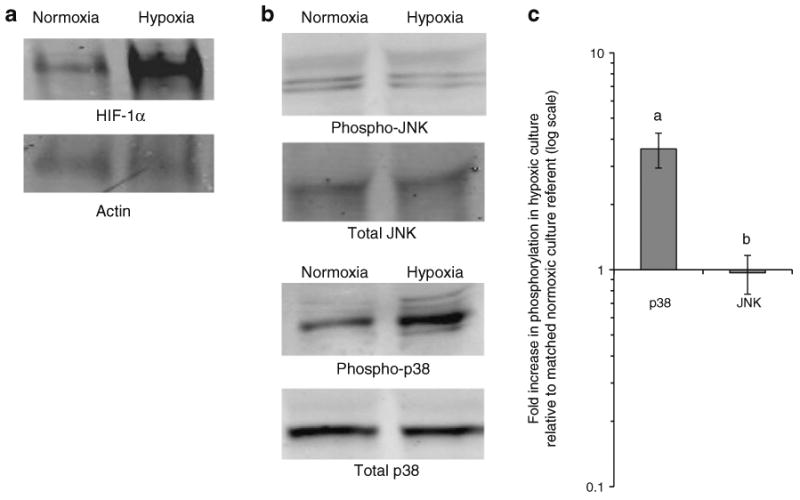
Hypoxia induces production of HIF-1α and phosphorylation of p38 but not JNK in adipose tissue. a Representative western blots of protein lysates from obese human VAT explants cultured in normoxic or hypoxic conditions for 4 h and studied with antibodies directed towards HIF-1α and matched actin. A mean actin-normalised fold increase of HIF-1α of 1.30 was observed (p=0.037, n=7). b Representative western blots of phosphorylated and total JNK and p38 in protein lysates from obese human VAT explants cultured in normoxic or hypoxic conditions for 24 h. c Densitometry data from VAT explants from eight obese participants cultured in normoxic and hypoxic conditions. The ordinate shows relative increase in phosphorylation in response to hypoxia calculated from densitometry values: [phosphorylated protein, hypoxia/phosphorylated protein, normoxia]//[total protein, hypoxia/total protein, normoxia]; fold change values were 3.61 for p38 and 0.967 for JNK p values are derived from paired t test comparing matched hypoxia and normoxic culture arms: ap= 0.005 for p38 and bp=0.851 for JNK Error bars show SEM
Adipocyte size and adipose tissue capillary density in human adipose tissue
Increased adipocyte diameter and reduced adipose tissue blood flow have been implicated as underlying mechanisms of adipose tissue hypoxia in vivo. Adipocyte diameter was greater in obese than lean participants in VAT and SAT. Adipocyte diameter was increased in SAT relative to VAT in obese, but not lean, participants (Fig. 7). Capillary density was decreased in adipose tissue from obese participants compared with lean participants in VAT and SAT. Capillary density was increased in VAT compared with SAT in lean participants, but no difference was observed in obese participants (Fig. 8).
Fig. 7.
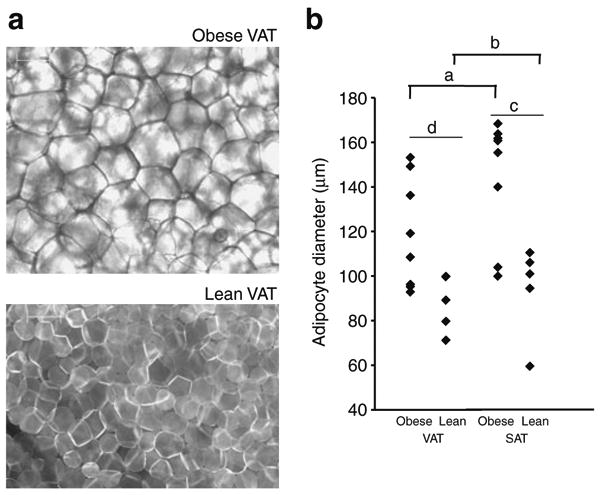
Adipocyte diameter is increased in obesity. a Representative photomicrographs of BODIPY-labelled fatty acid stained VAT explants from lean and obese participants under immunofluorescence microscopy. Scale bar, 100 μm. b Adipocyte diameters from matched VAT and SAT specimens from eight obese and six lean participants. a and b compare VAT vs SAT within each cohort (obese or lean) using paired t tests; c and d compare obese vs lean participants within each depot (VAT or SAT) using independent t tests. ap=0.017; bp=0.448; cp=0.003; dp=0.020
Fig. 8.
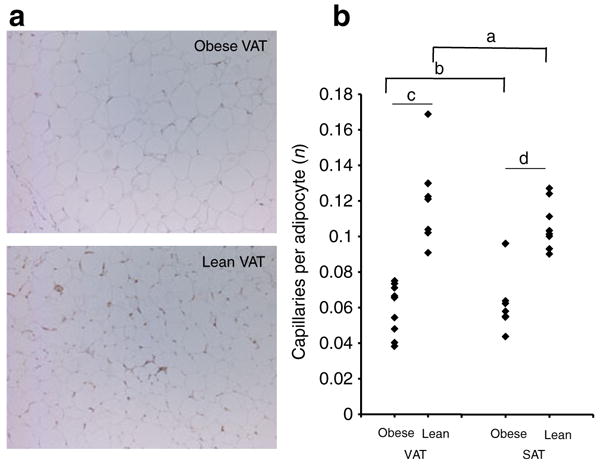
Adipose tissue capillary density is decreased in obesity. a Representative photomicrographs of VAT from lean and obese participants stained with CD34-antibody. b Capillary density from matched VAT and SAT specimens from nine obese and eight lean participants. The ordinate shows the mean number of capillaries per adipocyte in at least ten 20× fields per specimen. a and b compare VAT vs SAT within each cohort (obese or lean) using paired t tests; c and d compare obese vs lean participants within each depot (VAT or SAT) using independent t tests. ap=0.118; bp=0.402; cp=0.001; dp= 0.001. Results were similar when data was studied in terms of capillaries per 20× field
Discussion
Hypoxia is a potential root cause of adipose tissue inflammation. We used in vitro hypoxic culture to study human adipose tissue inflammatory responses to hypoxia and identify mediators of hypoxia-induced adipose tissue inflammation. Our data implicate p38 in the regulation of hypoxia-induced inflammation, and suggest that adipocyte size and adipose tissue capillary density may underlie adipose tissue hypoxia in obesity.
Human adipose tissue in obesity is characterised by a pan-leucocyte infiltrate and increased inflammatory cytokine secretion
We observed increased infiltration of ATMs, as well as T cells and NK cells, in adipose tissue in obese participants, which was greater in VAT than SAT. These data are consistent with multiple previous reports documenting increased ATM levels in obesity [4, 20, 21], as well as emerging data implicating adipose tissue T cells and NK cells in adipose tissue inflammation [7, 22]. In order to functionally characterise this leucocyte infiltrate, we studied in vitro cytokine production in purified SVF for select cytokines that have been implicated in metabolic disease. TNF-α is a central proinflammatory and diabetogenic mediator in obesity [23–25]. CCL2 and IL-6 have also been linked to adipose tissue inflammation [26–28]. IL-10, in contrast, attenuates inflammation and is decreased in obesity and the metabolic syndrome [29]. We observed increased basal secretion of TNF-α and IL-10 by the obese SVF compared with the lean SVF, consistent with the observed increased leucocyte infiltrate. We did not observe increased cytokine production in the VAT SVF compared with the SAT SVF within obese participants, consistent with the more modest increase in ATM infiltrate in obese VAT SVF relative to obese SAT SVF (compared with the greater difference observed between obese and lean VAT SVFs). Finally, we demonstrate that CD14+ ATMs are the primary source of basal inflammatory cytokine production within the SVF, consistent with previous data [7, 30]. The increased basal levels of IL-10 secretion in the obese SVF are not consistent with the observed lower serum levels of IL-10 reported in obesity [29]. These data are derived from purified SVF, which has been shown to produce higher levels of multiple pro- and anti-inflammatory cytokines, including IL-10 [7, 30]. In vitro SVF cytokine levels are therefore unlikely to be an accurate representation of serum cytokine levels, which derive from multiple in vivo sources in addition to adipose tissue.
Human adipose tissue SVF cytokine and transcriptional responses to hypoxia
Hypoxia regulated TNF-α and IL-10 secretion in obese VAT SVF in a reciprocal manner, inducing TNF-α secretion and inhibiting IL-10 secretion, consistent with a proinflammatory effect. Hypoxia also induced upregulation of GLUT1, VEGF, PERK, and C-JUN transcripts in obese VAT SVF. These hypoxia-induced responses were absent in lean VAT SVF and in obese SAT SVF, consistent with the decreased inflammatory infiltrate in these tissues.
Our data confirm that CD14+ ATMs are the dominant source of both basal and hypoxia-induced inflammatory cytokine secretion within the SVF. Others studies of hypoxia-induced adipose tissue inflammatory responses have focused primarily on adipocytes differentiated in vitro from pre-adipocytes [11, 31–33]. We focused study on the SVF because multiple reports suggest that it is the primary source of most inflammatory cytokines in adipose tissue [3–10]. Nonetheless, adipocytes represent an alternative source of cytokines, producing similar levels of select cytokines compared with the SVF, most notably IL-6 [6–8]. Our data in the SVF, therefore, not unexpectedly differ from studies of hypoxia-induced cytokine production in adipocytes. For example, Wang et al. demonstrated minimal hypoxia-induced TNF-α secretion in adipocytes, but increases in IL-6 [33], a pattern that we did not observe in the SVF, consistent with data demonstrating that adipocytes secrete significant levels of IL-6, but low levels of TNF-α [6–8], in part possibly due to lack of adipocyte production of TNF-α converting enzyme [34]. These observations aside, however, and with the exception of IL-6, previous data demonstrate that SVFs are the primary source of the cytokines studied in this manuscript [3–10].
p38 regulates hypoxia-induced adipose tissue inflammation
Given the hypoxia-induced increase in c-Jun and ATF2, transcription factors that are induced by JNK and p38 respectively, we elected to further study the MAPK family members JNK and p38, both of which have been implicated in obesity and metabolic disease [14, 19, 35, 36]. Hypoxia induced upregulation of p38 phosphorylation in cultured human adipose tissue, consistent with hypoxia-induced activation of p38. Small molecule inhibition of either p38 or JNK decreased hypoxia-induced SVF inflammatory cytokine secretion. These data suggest a role for p38 in regulating adipose tissue inflammation. Others have implicated p38 in metabolic disease [37, 38], demonstrating that p38 influences thermogenesis in adipose tissue via regulation of UCP1 expression and fatty acid oxidation [16] as well as regulating TNF-α-mediated insulin resistance in endothelial cells [19]. We demonstrate hypoxia-induced increase in UCP1 transcript levels in the SVF in response to hypoxia, suggesting that hypoxia may regulate mitochondrial, thermogenic and oxidative functions in adipose tissue. Further research will be necessary to determine the precise role of UCP1 in the regulation of hypoxia-induced inflammation.
Putative underlying mechanisms of hypoxias
Adipocyte enlargement may contribute to hypoxia by presenting a cellular oxygen diffusion barrier [1]. Adipocyte diameter was increased in obese compared with lean participants, and VAT adipocytes were smaller than SAT adipocytes, consistent with previous data [39–41]. Alterations in adipose tissue blood flow have also been implicated as a potential cause of hypoxia in human obesity based on systemic radionuclide washout techniques [42, 43]. Consistent with these data, adipose tissue capillary density was decreased in obese participants, similar to data from other researchers in mice [44] and humans [45], although no depot-specific differences were observed. These data suggest that, while adipocyte enlargement and decreased adipose tissue capillary density may contribute to hypoxia in obesity, these phenomena do not explain depot-specific differences in inflammation.
Limitations
In vivo tissue O2 concentrations are lower than standard tissue culture concentrations of 21%. Adipose tissue pO2 (the partial pressure of oxygen) is estimated to be 15–50 mmHg, corresponding to 3–15% O2 [1, 2, 46, 47]. In vitro hypoxic culture conditions therefore only approximate in vivo conditions. Nonetheless, 21% and 1% are commonly employed to approximate ‘normoxia’ and ‘hypoxia’ respectively in vitro [2, 11, 31, 48, 49] and 1% O2 induces a marked increase in inflammatory response relative to standard tissue culture conditions. Thus, while not an exact simulation of in vivo hypoxia, this in vitro system nonetheless provides a useful model, and demonstrates upregulation of HIF-1α in cultured adipose tissue explants. No differences were observed in HIF-1α levels between fresh obese and lean VAT explants, or between fresh VAT and SAT explants within the obese cohort. We suspect that in vivo differences in this marker, which is rapidly degraded and turned over, may be more subtle than the observed differences elicited by the strong hypoxic stimulus provided by the in vitro culture system. Furthermore, the in vivo hypoxic status of human adipose tissue is likely to be subject to multiple clinical variables, such as meal status, circadian rhythm and stress, which are not present or controlled for in the fasted patients under general anaesthesia that were the source of tissue in this study. These data focus on indirect in vitro measures of hypoxia; direct measurement of in vivo adipose tissue pO2 and blood flow will be pursued in future research.
Moreover, there were more men in the lean control group than in the obese group. This sex difference was unavoidable given the limited number of lean volunteers available.
Signalling pathways in addition to ERS are active in hypoxia-induced inflammation. Nuclear factor κB (NFκB), for example, has been shown to be activated in macrophages in response to hypoxia and to mediate inflammation [50]. Future research will study the role of NFκB and other signalling pathways in response to hypoxia in adipose tissue.
Conclusion
Hypoxia induces inflammatory cytokine secretion and metabolic stress gene transcription in obese adipose tissue ATMs together with increased phosphorylation of p38 in whole adipose tissue. Human obesity is associated with increased adipocyte size and decreased adipose tissue capillary density, suggesting possible mechanisms of adipose tissue hypoxia. These data suggest that hypoxia may regulate adipose tissue inflammation in vivo, and implicate p38 in the regulation of hypoxia-induced adipose tissue inflammatory responses.
Supplementary Material
Acknowledgments
This work was supported by National Institutes of Health Grants K08DK074397 (R.W. O'Rourke), R01DK070333 (D.L. Marks) and P51R000153 (C.T. Roberts), an American Surgical Association Foundation Fellowship Award (R.W. O'Rourke), an Oregon Clinical and Translational Research Institute Summer Research Award, grant number UL1 RR024140 from the National Center for Research Resources, and NIH Roadmap for Medical Research (E.C. Cheang). We thank C. Gendron and C. Poage for expert technical assistance with immunohistochemistry.
Abbreviations
- ATM
Adipose tissue macrophage
- ERS
Endoplasmic reticulum stress
- JNK
c-Jun terminal kinase
- MAPK
Mitogen activated protein kinase
- pO2
Partial pressure of oxygen
- QRTPCR
Quantitative real-time polymerase chain reaction
- SVF
Stromovascular cell fraction
- SAT
Subcutaneous adipose tissue
- TBS
Tris-buffered saline
- TBST
Tris-buffered saline Tween-20
- VAT
Visceral adipose tissue
Footnotes
Duality of interest The authors declare that there is no duality of interest associated with this manuscript.
Contributor Information
R. W. O'Rourke, Email: orourkro@ohsu.edu, Department of Surgery, Oregon Health & Science University, 3181 SW Sam Jackson Park Road, L223A, Portland, OR, USA.
A. E. White, Department of Surgery, Oregon Health & Science University, 3181 SW Sam Jackson Park Road, L223A, Portland, OR, USA
M. D. Metcalf, Department of Surgery, Oregon Health & Science University, 3181 SW Sam Jackson Park Road, L223A, Portland, OR, USA
A. S. Olivas, Department of Surgery, Oregon Health & Science University, 3181 SW Sam Jackson Park Road, L223A, Portland, OR, USA
P. Mitra, Department of Surgery, Oregon Health & Science University, 3181 SW Sam Jackson Park Road, L223A, Portland, OR, USA; Department of Pediatrics, Oregon Health & Science University, Portland, OR, USA
W. G. Larison, School of Medicine, Oregon Health & Science University, Portland, OR, USA
E. C. Cheang, School of Medicine, Oregon Health & Science University, Portland, OR, USA
O. Varlamov, National Primate Research Center, Beaverton, OR, USA
C. L. Corless, Department of Pathology, Oregon Health & Science University, Portland, OR, USA
C. T. Roberts, Jr, Department of Pediatrics, Oregon Health & Science University, Portland, OR, USA; Department of Medicine, Oregon Health & Science University, Portland, OR, USA; National Primate Research Center, Beaverton, OR, USA.
D. L. Marks, Department of Pediatrics, Oregon Health & Science University, Portland, OR, USA
References
- 1.Trayhurn P, Wang B, Wood IS. Hypoxia in adipose tissue: a basis for the dysregulation of tissue function in obesity? Br J Nutr. 2008;100:227–235. doi: 10.1017/S0007114508971282. [DOI] [PubMed] [Google Scholar]
- 2.Ye J, Gao Z, Yin J, He Q. Hypoxia is a potential risk factor for chronic inflammation and adiponectin reduction in adipose tissue of ob/ob and dietary obese mice. Am J Physiol Endocrinol Metab. 2007;293:E1118–E1128. doi: 10.1152/ajpendo.00435.2007. [DOI] [PubMed] [Google Scholar]
- 3.Capel F, Klimcáková E, Viguerie N, et al. Macrophages and adipocytes in human obesity: adipose tissue gene expression and insulin sensitivity during calorie restriction and weight stabilization. Diabetes. 2009;58:1558–1567. doi: 10.2337/db09-0033. [DOI] [PMC free article] [PubMed] [Google Scholar]
- 4.Cancello R, Henegar C, Viguerie N, et al. Reduction of macrophage infiltration and chemoattractant gene expression changes in white adipose tissue of morbidly obese subjects after surgery-induced weight loss. Diabetes. 2005;54:2277–2286. doi: 10.2337/diabetes.54.8.2277. [DOI] [PubMed] [Google Scholar]
- 5.Darimont C, Avanti O, Blancher F, et al. Contribution of mesothelial cells in the expression of inflammatory-related factors in omental adipose tissue of obese subjects. Int J Obes. 2008;32:112–120. doi: 10.1038/sj.ijo.0803688. [DOI] [PubMed] [Google Scholar]
- 6.Fain JN, Buehrer B, Bahouth SW, Tichansky DS, Madan AK. Comparison of messenger RNA distribution for 60 proteins in fat cells vs the nonfat cells of human omental adipose tissue. Metabolism. 2008;57:1005–1015. doi: 10.1016/j.metabol.2008.02.019. [DOI] [PubMed] [Google Scholar]
- 7.O'Rourke RW, Metcalf MD, White AE, et al. Depot-specific differences in inflammatory mediators and a role for NK cells and IFN-gamma in inflammation in human adipose tissue. Int J Obes Lond. 2009;33:978–990. doi: 10.1038/ijo.2009.133. [DOI] [PMC free article] [PubMed] [Google Scholar]
- 8.Weisberg SP, McCann D, Desai M, Rosenbaum M, Leibel RL, Ferrante AW., Jr Obesity is associated with macrophage accumulation in adipose tissue. J Clin Invest. 2002;112:1796–1808. doi: 10.1172/JCI19246. [DOI] [PMC free article] [PubMed] [Google Scholar]
- 9.Xu H, Barnes GT, Yang Q, et al. Chronic inflammation in fat plays a crucial role in the development of obesity-related insulin resistance. J Clin Invest. 2003;112:1821–1830. doi: 10.1172/JCI19451. [DOI] [PMC free article] [PubMed] [Google Scholar]
- 10.Zhou HR, Kim EK, Kim H, Claycombe KJ. Obesity-associated mouse adipose stem cell secretion of monocyte chemotactic protein-1. Am J Physiol Endocrinol Metab. 2007;293:E1153–E1158. doi: 10.1152/ajpendo.00186.2007. [DOI] [PubMed] [Google Scholar]
- 11.Hosogai N, Fukuhara A, Oshima K, et al. Adipose tissue hypoxia in obesity and its impact on adipocytokine dysregulation. Diabetes. 2007;56:901–911. doi: 10.2337/db06-0911. [DOI] [PubMed] [Google Scholar]
- 12.Ost A, Svensson K, Ruishalme I, et al. Attenuated mTOR signaling and enhanced autophagy in adipocytes from obese patients with type 2 diabetes. Mol Med. 2010;16:235–246. doi: 10.2119/molmed.2010.00023. [DOI] [PMC free article] [PubMed] [Google Scholar]
- 13.Zhang CL, Song F, Zhang J, Song QH. Hypoxia-induced Bcl-2 expression in endothelial cells via p38 MAPK pathway. Biochem Biophys Res Commun. 2010;394:976–980. doi: 10.1016/j.bbrc.2010.03.102. [DOI] [PubMed] [Google Scholar]
- 14.Maekawa T, Jin W, Ishii S. The role of ATF-2 family transcription factors in adipocyte differentiation: antiobesity effects of p38 inhibitors. Mol Cell Biol. 2010;30:613–625. doi: 10.1128/MCB.00685-09. [DOI] [PMC free article] [PubMed] [Google Scholar]
- 15.Ozcan U, Cao Q, Yilmaz E, et al. Endoplasmic reticulum stress links obesity, insulin action, and type 2 diabetes. Science. 2004;306:457–461. doi: 10.1126/science.1103160. [DOI] [PubMed] [Google Scholar]
- 16.Robidoux J, Cao W, Quan H, et al. Selective activation of mitogen-activated protein (MAP) kinase kinase 3 and p38alpha MAP kinase is essential for cyclic AMP-dependent UCP1 expression in adipocytes. Mol Cell Biol. 2005;25:5466–5479. doi: 10.1128/MCB.25.13.5466-5479.2005. [DOI] [PMC free article] [PubMed] [Google Scholar]
- 17.NIH conference. Gastrointestinal surgery for severe obesity: Consensus Development Conference Panel. Ann Intern Med. 1991;115:956–961. [PubMed] [Google Scholar]
- 18.Hsu YL, Cho CY, Kuo PL, Huang YT, Plumbagin LCC. (5-Hydroxy-2-methyl-1, 4-naphthoquinone) induces apoptosis and cell cycle arrest in A549 cells through p53 accumulation via c-Jun NH2-terminal kinase-mediated phosphorylation at serine 15 in vitro and in vivo. J Pharmacol Exp Ther. 2006;318:484–494. doi: 10.1124/jpet.105.098863. [DOI] [PubMed] [Google Scholar]
- 19.Li G, Barrett EJ, Barrett MO, Cao W, Liu Z. Tumor necrosis factor-alpha induces insulin resistance in endothelial cells via a p38 mitogen-activated protein kinase-dependent pathway. Endocrinology. 2007;148:3356–3363. doi: 10.1210/en.2006-1441. [DOI] [PubMed] [Google Scholar]
- 20.Aron-Wisnewsky J, Tordjman J, Poitou C, et al. Human adipose tissue macrophages: m1 and m2 cell surface markers in subcutaneous and omental depots and after weight loss. J Clin Endocrinol Metab. 2009;94:4619–4623. doi: 10.1210/jc.2009-0925. [DOI] [PubMed] [Google Scholar]
- 21.Harman-Boehm I, Blüher M, Redel H, et al. Macrophage infiltration into omental vs subcutaneous fat across different populations: effect of regional adiposity and the comorbidities of obesity. J Clin Endocrinol Metab. 2007;92:2240–2247. doi: 10.1210/jc.2006-1811. [DOI] [PubMed] [Google Scholar]
- 22.Yang H, Youm YH, Vandanmagsar B, et al. Obesity increases the production of proinflammatory mediators from adipose tissue T cells and compromises TCR repertoire diversity: implications for systemic inflammation and insulin resistance. J Immunol. 2010;185:1836–1845. doi: 10.4049/jimmunol.1000021. [DOI] [PMC free article] [PubMed] [Google Scholar]
- 23.Garaulet M, Pérez-Llamas F, Zamora S, Tebar FJ. Interrelationship between serum lipid profile, serum hormones and other components of the metabolic syndrome. J Physiol Biochem. 2002;58:151–160. doi: 10.1007/BF03179852. [DOI] [PubMed] [Google Scholar]
- 24.Hotamisligil GS, Shargill NS, Spiegelman BM. Adipose expression of tumor necrosis factor-alpha: direct role in obesity-linked insulin resistance. Science. 1993;259:87–91. doi: 10.1126/science.7678183. [DOI] [PubMed] [Google Scholar]
- 25.Uysal KT, Wiesbrock SM, Marino MW, Hotamisligil GS. Protection from obesity-induced insulin resistance in mice lacking TNF-[alpha] function. Nature. 1997;389:610–614. doi: 10.1038/39335. [DOI] [PubMed] [Google Scholar]
- 26.Eder K, Baffy N, Falus A, Fulop AK. The major inflammatory mediator interleukin-6 and obesity. Inflamm Res. 2009;58:727–736. doi: 10.1007/s00011-009-0060-4. [DOI] [PubMed] [Google Scholar]
- 27.Kamei N, Tobe K, Suzuki R, et al. Over-expression of MCP-1 in adipose tissues causes macrophage recruitment and insulin resistance. J Biol Chem. 2006;281:26602–26614. doi: 10.1074/jbc.M601284200. [DOI] [PubMed] [Google Scholar]
- 28.Weisberg SP, Hunter D, Huber R, et al. CCR2 modulates inflammatory and metabolic effects of high-fat feeding. J Clin Invest. 2005;116:115–124. doi: 10.1172/JCI24335. [DOI] [PMC free article] [PubMed] [Google Scholar]
- 29.Esposito K, Pontillo A, Giugliano F, et al. Association of low interleukin-10 levels with the metabolic syndrome in obese women. J Clin Endocrinol Metab. 2003;88:1055–1058. doi: 10.1210/jc.2002-021437. [DOI] [PubMed] [Google Scholar]
- 30.Zeyda M, Farmer D, Todoric J, et al. Human adipose tissue macrophages are of an anti-inflammatory phenotype but capable of excessive pro-inflammatory mediator production. Int J Obes Lond. 2007;31:1420–1428. doi: 10.1038/sj.ijo.0803632. [DOI] [PubMed] [Google Scholar]
- 31.Wang B, Wood IS, Trayhurn P. PCR arrays identify metallothionein-3 as a highly hypoxia-inducible gene in human adipocytes. Biochem Biophys Res Commun. 2008;368:88–93. doi: 10.1016/j.bbrc.2008.01.036. [DOI] [PMC free article] [PubMed] [Google Scholar]
- 32.Wang B, Wood IS, Trayhurn P. Hypoxia induces leptin gene expression and secretion in human preadipocytes: differential effects of hypoxia on adipokine expression by preadipocytes. J Endocrinol. 2008;198:127–134. doi: 10.1677/JOE-08-0156. [DOI] [PubMed] [Google Scholar]
- 33.Wang B, Wood IS, Trayhurn P. Dysregulation of the expression and secretion of inflammation-related adipokines by hypoxia in human adipocytes. Pflugers Arch. 2007;455:479–492. doi: 10.1007/s00424-007-0301-8. [DOI] [PMC free article] [PubMed] [Google Scholar]
- 34.Xu H, Uysal KT, Becherer JD, Arner P, Hotamisligil GS. Altered tumor necrosis factor-alpha (TNF-alpha) processing in adipocytes and increased expression of transmembrane TNF-alpha in obesity. Diabetes. 2002;51:1876–1883. doi: 10.2337/diabetes.51.6.1876. [DOI] [PubMed] [Google Scholar]
- 35.Chang L, Karin M. Mammalian MAP kinase signalling cascades. Nature. 2001;410:37–40. doi: 10.1038/35065000. [DOI] [PubMed] [Google Scholar]
- 36.Hirosumi J, Tuncman G, Chang L, et al. A central role for JNK in obesity and insulin resistance. Nature. 2002;420:333–336. doi: 10.1038/nature01137. [DOI] [PubMed] [Google Scholar]
- 37.Cao W, Collins QF, Becker TC, et al. p38 Mitogen-activated protein kinase plays a stimulatory role in hepatic gluconeogenesis. J Biol Chem. 2005;280:42731–42737. doi: 10.1074/jbc.M506223200. [DOI] [PubMed] [Google Scholar]
- 38.Xiong Y, Collins QF, An J, et al. p38 mitogen-activated protein kinase plays an inhibitory role in hepatic lipogenesis. J Biol Chem. 2007;282:4975–4982. doi: 10.1074/jbc.M606742200. [DOI] [PubMed] [Google Scholar]
- 39.Drolet R, Richard C, Sniderman AD, et al. Hypertrophy and hyperplasia of abdominal adipose tissues in women. Int J Obes Lond. 2008;32:283–291. doi: 10.1038/sj.ijo.0803708. [DOI] [PubMed] [Google Scholar]
- 40.Tchoukalova YD, Koutsari C, Karpyak MV, Votruba SB, Wendland E, Jensen M. Subcutaneous adipocyte size and body fat distribution. Am J Clin Nutr. 2008;87:56–63. doi: 10.1093/ajcn/87.1.56. [DOI] [PubMed] [Google Scholar]
- 41.Winkler G, Kiss S, Keszthelyi L, et al. Expression of tumor necrosis factor (TNF)-alpha protein in the subcutaneous and visceral adipose tissue in correlation with adipocyte cell volume, serum TNF-alpha, soluble serum TNF-receptor-2 concentrations and C-peptide level. Eur J Endocrinol. 2003;149:129–135. doi: 10.1530/eje.0.1490129. [DOI] [PubMed] [Google Scholar]
- 42.Blaak EE, van Baak MA, Kemerink GJ, Pakbiers MT, Heidendal GA, Saris WH. Beta-adrenergic stimulation and abdominal subcutaneous fat blood flow in lean, obese, and reduced-obese subjects. Metabolism. 1995;44:183–187. doi: 10.1016/0026-0495(95)90262-7. [DOI] [PubMed] [Google Scholar]
- 43.Jansson PA, Larsson A, Lönnroth PN. Relationship between blood pressure, metabolic variables and blood flow in obese subjects with or without non-insulin-dependent diabetes mellitus. Eur J Clin Invest. 1998;28:813–818. doi: 10.1046/j.1365-2362.1998.00360.x. [DOI] [PubMed] [Google Scholar]
- 44.Pang C, Gao Z, Yin J, Zhang J, Jia W, Ye J. Macrophage infiltration into adipose tissue may promote angiogenesis for adipose tissue remodeling in obesity. Am J Physiol Endocrinol Metab. 2008;295:E313–E322. doi: 10.1152/ajpendo.90296.2008. [DOI] [PMC free article] [PubMed] [Google Scholar]
- 45.Pasarica M, Sereda OR, Redman LM, et al. Reduced adipose tissue oxygenation in human obesity: evidence for rarefaction, macrophage chemotaxis, and inflammation without an angiogenic response. Diabetes. 2009;58:718–725. doi: 10.2337/db08-1098. [DOI] [PMC free article] [PubMed] [Google Scholar]
- 46.Fleischmann E, Kurz A, Niedermayr M, et al. Tissue oxygenation in obese and non-obese patients during laparoscopy. Obes Surg. 2005;15:813–819. doi: 10.1381/0960892054222867. [DOI] [PMC free article] [PubMed] [Google Scholar]
- 47.Kabon B, Nagele A, Reddy D, et al. Obesity decreases perioperative tissue oxygenation. Anesthesiology. 2004;100:274–280. doi: 10.1097/00000542-200402000-00015. [DOI] [PMC free article] [PubMed] [Google Scholar]
- 48.Pérez de Heredia F, Wood IS, Trayhurn P. Hypoxia stimulates lactate release and modulates monocarboxylate transporter (MCT1, MCT2, and MCT4) expression in human adipocytes. Pflugers Arch. 2010;459:509–518. doi: 10.1007/s00424-009-0750-3. [DOI] [PubMed] [Google Scholar]
- 49.Wood IS, Wang B, Lorente-Cebrián S, Trayhurn P. Hypoxia increases expression of selective facilitative glucose transporters (GLUT) and 2-deoxy-D-glucose uptake in human adipocytes. Biochem Biophys Res Commun. 2007;361:468–473. doi: 10.1016/j.bbrc.2007.07.032. [DOI] [PMC free article] [PubMed] [Google Scholar]
- 50.Rius J, Guma M, Schachtrup C, et al. NF-kappaB links innate immunity to the hypoxic response through transcriptional regulation of HIF-1alpha. Nature. 2008;453:807–811. doi: 10.1038/nature06905. [DOI] [PMC free article] [PubMed] [Google Scholar]
Associated Data
This section collects any data citations, data availability statements, or supplementary materials included in this article.