Abstract
Neuronal morphology plays a significant role in determining how neurons function and communicate1-3. Specifically, it affects the ability of neurons to receive inputs from other cells2 and contributes to the propagation of action potentials4,5. The morphology of the neurites also affects how information is processed. The diversity of dendrite morphologies facilitate local and long range signaling and allow individual neurons or groups of neurons to carry out specialized functions within the neuronal network6,7. Alterations in dendrite morphology, including fragmentation of dendrites and changes in branching patterns, have been observed in a number of disease states, including Alzheimer's disease8, schizophrenia9,10, and mental retardation11. The ability to both understand the factors that shape dendrite morphologies and to identify changes in dendrite morphologies is essential in the understanding of nervous system function and dysfunction.
Neurite morphology is often analyzed by Sholl analysis and by counting the number of neurites and the number of branch tips. This analysis is generally applied to dendrites, but it can also be applied to axons. Performing this analysis by hand is both time consuming and inevitably introduces variability due to experimenter bias and inconsistency. The Bonfire program is a semi-automated approach to the analysis of dendrite and axon morphology that builds upon available open-source morphological analysis tools. Our program enables the detection of local changes in dendrite and axon branching behaviors by performing Sholl analysis on subregions of the neuritic arbor. For example, Sholl analysis is performed on both the neuron as a whole as well as on each subset of processes (primary, secondary, terminal, root, etc.) Dendrite and axon patterning is influenced by a number of intracellular and extracellular factors, many acting locally. Thus, the resulting arbor morphology is a result of specific processes acting on specific neurites, making it necessary to perform morphological analysis on a smaller scale in order to observe these local variations12.
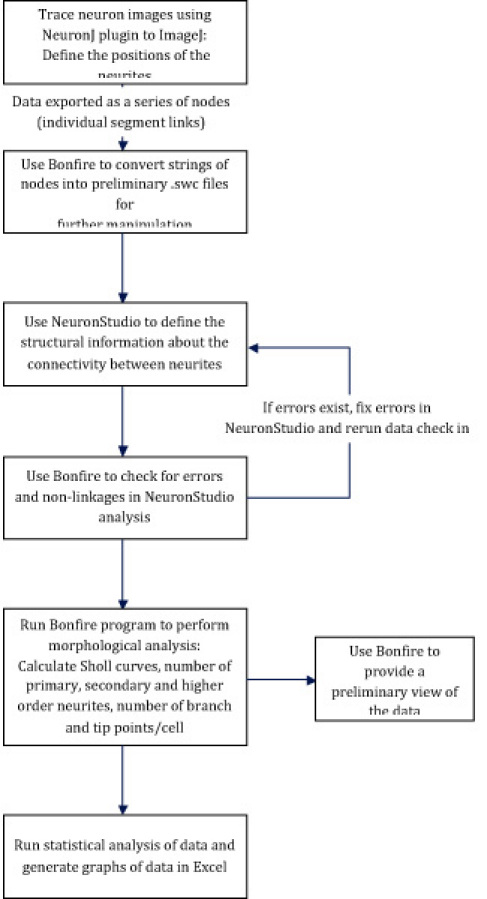
The Bonfire program requires the use of two open-source analysis tools, the NeuronJ plugin to ImageJ and NeuronStudio. Neurons are traced in ImageJ, and NeuronStudio is used to define the connectivity between neurites. Bonfire contains a number of custom scripts written in MATLAB (MathWorks) that are used to convert the data into the appropriate format for further analysis, check for user errors, and ultimately perform Sholl analysis. Finally, data are exported into Excel for statistical analysis. A flow chart of the Bonfire program is shown in Figure 1.
Protocol
1. Before You Begin:
1) E18 rat dissection:
Standard dissection methods of E18 hippocampal neurons have previously been described13. In order to use the Bonfire program to analyze the morphological characteristics of the neurites, 8 bit .tif images of individual neurons must be obtained. This can be accomplished in a number of ways depending on the experimental protocol you are following. Neurons can be plated at a low enough density so that single neurons appear in the microscope field. Alternatively, to image individual neurons that are grown in a dense culture, neurons can be transfected using a variety of transfection methods with a plasmid encoding a fluorescent protein.
2) Software Requirements and Installation:
The NeuronJ plugin for the ImageJ software from NIH and NeuronStudio must both be installed in order to run the Bonfire program. The software packs can be found at the following websites: ImageJ - http://rsbweb.nih.gov/ij/ NeuronJ - http://www.imagescience.org/meijering/software/neuronj/ NeuronStudio - http://research.mssm.edu/cnic/tools-ns.html
The Bonfire program can be found at http://lifesci.rutgers.edu/~firestein. The Bonfire user manual is also available at this website. Additionally, the initial description of Bonfire can be found in Langhammer et al, Cytometry 2010. All of our data have been analyzed using a Windows operating system.
3) Image Resolution Adjustment:
You will need to adjust the Bonfire program based on the image resolution of the images that you wish to analyze. In the bonfire_parameters portion of the Bonfire program, replace the current value for the variable pix_conv with the value of the image resolution (μm/pixel) of your images.
2. File Structure:
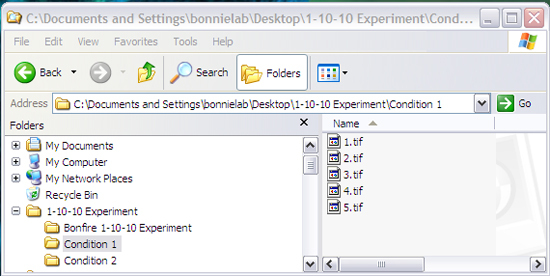
In order for Bonfire to analyze your data, the files must be organized in this specific structure (Figure 2). You will have:
A master folder
Sub-folders (containing each of your different conditions)
Cell image files (filename.tif files) contained in the different condition folders
A Bonfire folder containing the Bonfire Matlab mfiles (also contained in the master folder)
3. Tracing Neurons in NeuronJ:
- Prepare the image for tracing
- Open the image by selecting the 'Open' button on the NeuronJ toolbar and selecting the image you would like to trace.
- Resize the image by selecting the 'maximize' button.
- Adjust the brightness and contrast of the image so that you can visualize all of the neurites by selecting 'Image' on the NeuronJ toolbar then selecting 'Adjust brightness/contrast'.
- Trace the cell body in NeuronJ and identify the trace as being 'Type 06'
- Select the 'Add Traces' button on the NeuronJ toolbar.
- Trace around the perimeter of the cell body.
- Select the 'Label Tracings' button on the NeuronJ toolbar.
- Select 'N1' from the 'Tracing ID' dropdown menu.
- Select 'Type 06' in the NeuronJ: Attributes window and select 'OK'.
- Trace the neurites in NeuronJ
- Select the 'Add Traces' button on the NeuronJ toolbar.
- Add a trace along each neurite branch. You can select only the dendrites or the axon, depending on your experiment.
- We suggest that the segments you draw stop at each branch point, with each daughter branch point starting at that point as a new trace.
- Select the 'Save Tracings' button on the NeuronJ toolbar.
- Save the tracing you have just created in the same folder as the original image file.
- Export the trace files and the trace identifier file from NeuronJ Two types of files must be exported from NeuronJ and saved into the appropriate condition folders along with the .tif and .ndf files.
- Select the 'Export Trace' button on the NeuronJ toolbar.
- Select the "Tab-deliminated text-files: separate file for each tracing' option on the 'NeuronJ: Export' dialogue box and select 'OK'.
- Allow NeuronJ to choose the names of the files and the save location.
- Select the 'Measure Tracings' button on the NeuronJ toolbar.
- Select the 'Display tracing measurements' option on the 'NeuronJ: Measurements' window and select 'Run'.
- Select 'File' in the 'NeuronJ: Tracings' window.
- Select 'Save As' and save the file as filename_info. 'filename' must exactly match the name of the original image file (including capitalization) followed by _info and should not contain a 3-letter file-extension. For example, for original image name Cell20.tif, this file would be named 'Cell20_info'. Check that your computer does not automatically add a .xls file extension. If it does, the file extension must be manually deleted.
4. Use Bonfire to Build Preliminary .swc Files from NeuronJ Data:
- Reorganize folders using 'bonfire_load'
- Open Matlab by double clicking on the icon.
- Click on the ' ' button in the upper right of the command window.
- Select the 'Bonfire' folder in your master folder in the 'Browse For Folder' window.
- Type 'bonfire_load' into the Matlab command window and press enter.
- Select the condition folder that you wish to analyze in the 'Browse For Folder' window and select 'OK'.
- This will reorganize the folder structure by creating cell sub-folders containing all of the data for each individual cell.
- Create filename_prelim.swc files using 'bonfire_ndf2swc'
- Type 'bonfire_ndf2swc' into the command window and press enter.
- Select the same condition folder you just reorganized with 'bonfire_load' in the 'Browse For Folder' window and select 'OK'.
- This will create a .swc file in each cell folder for the chosen condition. Each cell folder will now contain 5 files; the original .tif image, the .ndf file, the _info trace identifier file, a .txt file and a .swc file.
5. Use NeuronStudio to Finalize .swc Files:
- Open and calibrate neuron images in NeuronStudio
- Open the NeuronStudio program.
- Select File→Open on the NeuronStudio toolbar.
- Find the .tif image of the neuron you want to edit and open it.
- Select Run→Settings and enter '1' into each of the 3 (X,Y,Z) boxes in the 'Voxel Size' window.
- Select File→Import SWC. Select the appropriate .swc file. The image file will now be overlaid with a trace image. The cell soma should be overlaid with a red circle.
- Use NeuronStudio to link neurites
- Use the tools in NeuronStudio to correctly identify branch points and end points (we recommend that you become acquainted with NeuronStudio's features and shortcuts before analyzing your data).
- Specifically, use the 'neurite tool' to join nodes so that:
- Each branch point (yellow nodes) can only create two branches
- All traces are continuous with the soma (only one red node)
- Export data from NeuronStudio
- Select File→Save Neurites (save as the default name).
- Check for errors in .swc files using 'bonfire_trace_check'
- Type 'bonfire_trace_check' into the Mathlab command window and press enter.
- Select the condition folder containing the data you have just processed in the 'Browse For Folder' window and select 'OK'.
- If there are any errors in any of the images in the folder the program will output images displaying where the error is located.
- Fixing errors in NeuronStudio
- Open the image file you saved in the exporting step.
- Locate and fix the problem(s).
- Click File→Save Neurites.
- Repeat for other images that need to be fixed.
- Rerun 'bonfire_trace_check' (5.4).
6. Use 'bonfire' to Extract Morphological Data from .swc Files:
Type 'bonfire' into the command window and press enter.
Select the condition folder that contains the data you want to analyze in the 'Browse For Folder' window and select 'OK'.
The Bonfire analysis will generate a window for each of the neurons being analyzed, in which it graphs the neuronal morphology along with the Sholl rings used in the analysis. Additionally, the 'bonfire' command will generate the .mat file that contains all of the morphological information that has been taken from the analysis.
7. Use 'bonfire_results' to View the Data:
Type 'bonfire_results' into the Matlab command window.
Select the condition folder for the condition you would like to view in the 'Browse For Folder' window and select 'OK'.
The 'Browse for Folder' window will close temporarily and re-open, allowing you to select additional conditions you would like to view.
When you are finished selecting condition folders, select 'Cancel' to exit the selection process.
'Bonfire_results' will return summary charts including the data from the condition folders you selected.
8. Use 'bonfire_export' to Export Data to Excel:
Type 'bonfire_export' into the command window.
Select the condition folder containing the data you would like to export in the 'Browse For Folder' window and select 'OK'. Bonfire_export will create Excel files of the morphological data and will place them in the condition folder that was selected.
9. Representative Results:
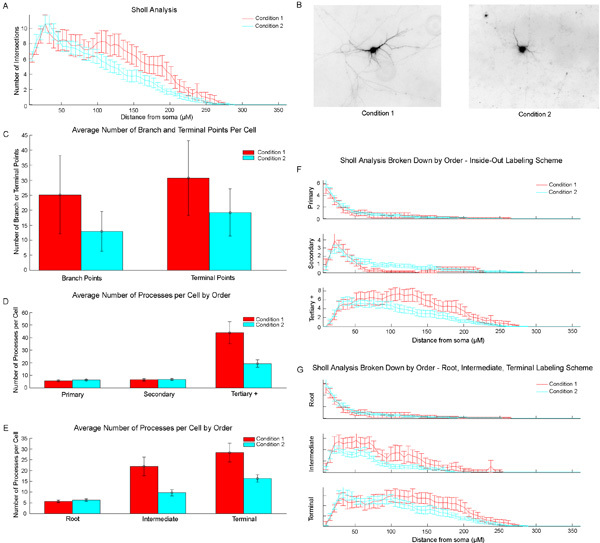
An example of the data generated by the Bonfire program on a data set containing two conditions is shown in Figure 3. In this example, Condition 1 neurons contain more neurites distal to the cell body. This phenomenon can be observed in the example images (Figure 3B) as well as in the Sholl curve of the total dendritic arbor (Figure 3A) and in the graph of the number of terminal points (Figure 3C). Additionally, because the Bonfire program also performs Sholl analysis on subregions of the images, we are able to identify more specifically the identity of the neurites that have increased. Both the total number of intersections of 3rd order or greater neurites (Figure 3F) and the total number of both intermediary and terminal neurites (Figure 3G) are increased distal to the cell body. These trends can also be observed in Figures 3D and 3E.
 Figure 1: Flow chart of the Bonfire program. Neurons are traced using ImageJ. The data are then exported and converted by the Bonfire program into preliminary .swc files. NeuronStudio is used to define the connectivity of the neurites. Bonfire checks for errors and then calculates Sholl curves, the number of primary, secondary, and higher order neurites, and the number of branch points and neurite tips. Finally, the data are exported to Excel for statistical analysis.
 Figure 2: File structure required for Bonfire analysis. The file structure must match this or the program will not run correctly. The names of the folders and files and the quantity of the folders and files can be changed.
 Figure 3: Example output data from Bonfire program. A) Total Sholl curves. B) Example inverted images of both conditions. C) Average number of branch points and terminal points/cell. D) Average number of processes/cell for primary, secondary, and tertiary or greater neurites. E) Average number of processes/cell for root, intermediate, and terminal neurites. F) Segment identity-specific Sholl analysis curves. Segments are grouped as primary, secondary, or tertiary or greater. G) Segment identity-specific Sholl analysis curves. Segments are grouped as root segments, intermediate segments, or terminal segments.
Discussion
The Bonfire program is a semi-automated program for the analysis of dendrite and axon morphology. It greatly increases the efficiency and accuracy of Sholl analysis over performing the analysis manually. In addition, the Bonfire program saves the data at every step of the process, making it possible to audit the data and to verify the accuracy of the analysis. Therefore, the task of data analysis can be distributed to numerous individuals without compromising accuracy. Lastly, by performing the analysis on subregions of the images, the program is able to identify local changes in branching that are missed when Sholl analysis is run only on the entire dendrite or axon arbor. Our program is able to identify how specific subsets of neurites are arranged in reference to the cell body. As a result, the branching patterns in the images are well- represented by the data that are generated by the Bonfire program.
Disclosures
The authors declare no competing interests. The funding agencies had no scientific role in the development of Bonfire.
Acknowledgments
This work was supported in part by a Busch Biomedical Grant, NSF grant IBN-0548543, NSF grant IBN-0919747, March of Dimes Foundation Grant 1-FY04-107, March of Dimes Foundation Grant 1-FY08-464 (to B.L.F). M.K.K. and C.G.L. were supported by NIH Biotechnology Training Grant T32 GM008339-20, and C.G.L. was also supported by a NJ Commission on Spinal Cord Research Predoctoral Fellowship 08-2941-SCR-E-0.
References
- Elston GN. Pyramidal cells of the frontal lobe: all the more spinous to think with. J Neurosci. 2000;20 doi: 10.1523/JNEUROSCI.20-18-j0002.2000. [DOI] [PMC free article] [PubMed] [Google Scholar]
- Koch C, Segev I. The role of single neurons in information processing. Nat Neurosci. 2000;(Suppl 3):1171–1177. doi: 10.1038/81444. [DOI] [PubMed] [Google Scholar]
- Poirazi P, Mel BW. Impact of active dendrites and structural plasticity on the memory capacity of neural tissue. Neuron. 2001;29:779–796. doi: 10.1016/s0896-6273(01)00252-5. [DOI] [PubMed] [Google Scholar]
- Schaefer AT, Larkum ME, Sakmann B, Roth A. Coincidence detection in pyramidal neurons is tuned by their dendritic branching pattern. J Neurophysiol. 2003;89:3143–3154. doi: 10.1152/jn.00046.2003. [DOI] [PubMed] [Google Scholar]
- Vetter P, Roth A, Hausser M. Propagation of action potentials in dendrites depends on dendritic morphology. J Neurophysiol. 2001;85:926–937. doi: 10.1152/jn.2001.85.2.926. [DOI] [PubMed] [Google Scholar]
- Hausser M, Spruston N, Stuart GJ. Diversity and dynamics of dendritic signaling. Science. 2000;290:739–744. doi: 10.1126/science.290.5492.739. [DOI] [PubMed] [Google Scholar]
- Brette R. Simulation of networks of spiking neurons: a review of tools and strategies. J Comput Neurosci. 2007;23:349–398. doi: 10.1007/s10827-007-0038-6. [DOI] [PMC free article] [PubMed] [Google Scholar]
- Arendt T, Zvegintseva HG, Leontovich TA. Dendritic changes in the basal nucleus of Meynert and in the diagonal band nucleus in Alzheimer's disease--a quantitative Golgi investigation. Neuroscience. 1986;19:1265–1278. doi: 10.1016/0306-4522(86)90141-7. [DOI] [PubMed] [Google Scholar]
- Harrison PJ. The neuropathology of schizophrenia. A critical review of the data and their interpretation. Brain. 1999;122:593–624. doi: 10.1093/brain/122.4.593. [DOI] [PubMed] [Google Scholar]
- Lewis DA, Glantz LA, Pierri JN, Sweet RA. Altered cortical glutamate neurotransmission in schizophrenia: evidence from morphological studies of pyramidal neurons. Ann N Y Acad Sci. 2003;1003:102–112. doi: 10.1196/annals.1300.007. [DOI] [PubMed] [Google Scholar]
- Kaufmann WE, Moser HW. Dendritic anomalies in disorders associated with mental retardation. Cereb Cortex. 2000;10:981–991. doi: 10.1093/cercor/10.10.981. [DOI] [PubMed] [Google Scholar]
- Georges PC, Hadzimichalis NM, Sweet ES, Firestein BL. The yin-yang of dendrite morphology: unity of actin and microtubules. Mol Neurobiol. 2008;38:270–284. doi: 10.1007/s12035-008-8046-8. [DOI] [PubMed] [Google Scholar]
- Firestein BL. Cypin: a cytosolic regulator of PSD-95 postsynaptic targeting. Neuron. 1999;24:659–672. doi: 10.1016/s0896-6273(00)81120-4. [DOI] [PubMed] [Google Scholar]


