

Abstract
Objective
To examine CD4 cell responses to combination antiretroviral therapy (cART) in patients enrolled in the Australian HIV Observational Database (AHOD) who commenced cART at CD4 cell counts >350 cells/μL.
Methods
CD4 cell counts were modelled using random-effects, repeated-measurement models in 432 HIV-infected adults from AHOD who commenced their first cART regimen and had a baseline CD4 count >350 cells/μL. Using published AIDS and/or death incidence rates combined with the data summarised by time and predicted CD4 cell count, we calculated the expected reduction in risk of an event for different starting baseline CD4 strata.
Results
Mean CD4 counts increased above 500 cells/μL in all baseline CD4 strata by 12 months (means of 596, 717 and 881 cells/μL in baseline CD4 strata 351-500, 501-650 and >650 cells/μL respectively) and after 72 months since initiating cART, mean CD4 cell counts (by increasing baseline CD4 strata) were 689, 746, 742 cells/μL. The expected reduction in risk of mortality for baseline CD4 counts >650 cells/μL relative to 351-500 cells/μL was approximately 8%, an absolute risk reduction 0.33 per 1000 treated patient years.
Conclusion
Patients starting cART at high CD4 cell counts (>650 cells/μL) tend to maintain this immunological level over six years of follow-up. Patients starting from 351-500 CD4 cells/μL achieve levels of >650 cells/μL after approximately three years of cART. Initiating cART with a baseline CD4 count 501-650 or >650 cells/μL relative to 351-500 cells/μL indicated a minimal reduction in risk of AIDS incidence and/or death.
Keywords: HIV, CD4 cell counts, immune restoration, long term cART, disease progression
INTRODUCTION
A number of observational and randomized clinical trials in resource replete and resource poor settings have shown the benefit of combination antiretroviral therapy (cART) to suppress viral replication in patients with low CD4 cell counts. This has led to a marked reduction in AIDS and death due to immune recovery in these HIV-infected individuals on treatment1. However few studies have been published comparing the CD4 cell count increases and disease progression in patients who commence treatment at differing high CD4 levels (i.e. 351-500, 501-650, >650 cells/μL).
Several cohort study groups have shown the majority of patients who commence cART at CD4 counts as low as 350 cells/μL achieve a CD4 count above 500 cells/μL within 6-12 months 2-5. In one cohort it was also observed that the majority of patients starting cART within a CD4 count range 350-500 cells/μL could achieve CD4 cell restoration (during follow-up) to levels comparable to uninfected HIV patients (>800 cells/μL) 2. The demonstrated rapid recovery of CD4 cell counts to levels well above 500 cells/μL indicates that patients commencing cART with a CD4 count >350 cells/μL are well protected against new AIDS illnesses and AIDS-related mortalities, especially relative to HIV-infected individuals with impaired immune function, i.e. CD4 count < 200 cells/μL 6.
There is good randomised clinical trial data, reinforced by large observational cohort data supporting initiation of cART at a CD4 count of 350 cells/μL as opposed to delaying treatment until counts fall below 200 cells/μL 7-12. However, for patients who initiate cART at CD4 cell counts above 500 cells/μL, the benefits of starting cART earlier rather than deferring treatment are less clear. The published data on disease progression has found little evidence of large beneficial differences in event rates (AIDS/non-AIDS/death) in patients with a current CD4 count above 650 cells/μL compared to patients with a CD4 count in the range 350 to 500 or 501 to 649 cells/μL 13-14. Analyses specifically comparing early versus deferred cART from large cohort observational studies (NA-ACCORD and ART-CC) 15-16 have shown somewhat conflicting results.
The primary objective of this study was to evaluate CD4 cell count responses in patients from the Australian HIV Observation Database (AHOD) who initiated cART with no prior treatment experience and had a baseline CD4 count greater than 350 cells/μL. A key secondary objective was to estimate the effects of any differences observed in CD4 cell count responses to cART on clinical outcomes (mortality, AIDS, or both).
METHODS
Data Collection
Analyses were based on patients recruited to AHOD, for which a comprehensive description has been previously described elsewhere 17. Briefly, AHOD data are collected from 27 sites throughout Australia including hospitals, sexual health clinics and general medical practices with a special interest in HIV. Prospective data collection commenced in 1999 and retrospective data is provided where available. Written, informed consent is obtained at time of enrollment. Ethics approval for AHOD was granted to all participating sites by relevant Research and Ethics committees. Data for AHOD are collected every 6 months on a core set of demographic and clinical variables including sex, age, HIV exposure, hepatitis B virus (HBV) surface antigen status, hepatitis C virus (HCV) antibody status, CD4 and CD8 cell counts, HIV viral load, antiretroviral treatment history, AIDS illnesses and date and cause of death. Data are transferred electronically to the National Centre in HIV Epidemiology and Clinical Research (NCHECR) and are subjected to quality control and quality assurance procedures 17.
Data for this analysis included retrospective and prospective data collected from participants in AHOD who commenced their first cART regiment after 1st January 1997 and when their pre-cART CD4 counts were greater than 350 cells/μL. Patients with previous exposure to mono/dual antiretroviral therapy were excluded. We assume “intention-to-treat” principles (ITT) and no account was taken for any change or interruption to cART during the follow-up period. To minimize potential survivorship/follow-up bias, data were restricted to a maximum of 72 months of follow-up.
Statistical Analysis
The primary endpoint for this analysis was CD4 cell count measured post cART initiation every 6 months up to 72 months. If a patient had multiple CD4 cell measurements within a 3 month window either side of any time-point, then the CD4 cell count closest to the time-point was selected. A patient’s baseline CD4 cell count was identified by selecting the corresponding record closest to initiation of cART date and within a window of six months prior and one month post initiation of cART. Patients were deemed lost to follow-up if they did not have a clinical visit recorded within one year since the last routine data transfer (March 2010).
CD4 cell responses were summarised by average CD4 cell count, proportion of patients with CD4 counts >500 cells/μL, proportion with CD4 counts >650 cells/μL and compared according to initial pre-cART CD4 cell count strata and time since commencing cART. Patients were categorised into different baseline CD4 count strata: 351-500, 501-650 and >650 cells/μL. Data were modelled using maximum likelihood, random-intercept (unstructured correlation structure), repeated-measurement linear regression and models were adjusted a priori for age, sex, baseline HIV viral load, evidence of seroconversion within 6 months prior to initiating cART, HCV, initial cART regimen and calendar year. Time since commencing cART was split into three periods 0-12, 18-30, 36-72 months to allow for varying slopes and the knot points were chosen by inspection of the data. Interaction between baseline CD4 category and time since initiating cART were tested for significance. Covariate levels for the categorical adjustment variables are outlined in Table 1. We estimated HIV seroconversion date as the midpoint between a patient’s last known negative HIV serology test result and the patient’s first HIV-positive test.
Table 1.
Study population baseline characteristics and demographics, stratified by baseline CD4 cell count strata.
| Baseline CD4 (cells/μL) | 351-500 | 501-650 | >650 | |||
|---|---|---|---|---|---|---|
| N=220 | (%) | N=116 | (%) | N=96 | (%) | |
| Age atcART initiation (years) | ||||||
| <30 | 39 | 18 | 24 | 21 | 16 | 17 |
| 30-39 | 81 | 37 | 51 | 44 | 37 | 39 |
| 40-49 | 61 | 28 | 29 | 25 | 35 | 36 |
| 50-59 | 32 | 15 | 9 | 8 | 6 | 6 |
| >60 | 7 | 3 | 3 | 3 | 2 | 2 |
| Sex | ||||||
| Female | 12 | 5 | 7 | 6 | 4 | 4 |
| Male | 208 | 95 | 109 | 94 | 92 | 96 |
| HIV exposure | ||||||
| Homosexual | 162 | 74 | 98 | 84 | 80 | 83 |
| Heterosexual | 16 | 7 | 7 | 6 | 4 | 4 |
| IDU | 10 | 5 | 4 | 3 | 6 | 6 |
| Other | 30 | 14 | 5 | 4 | 6 | 6 |
| Missing | 2 | 1 | 2 | 2 | 0 | 0 |
| HCV co-infection | ||||||
| No/Not Tested | 204 | 93 | 105 | 91 | 84 | 88 |
| Yes | 16 | 7 | 11 | 9 | 12 | 13 |
| Baseline cART regimen | ||||||
| NRTI+NNRTI | 112 | 51 | 61 | 53 | 41 | 43 |
| NRTI+PI | 97 | 44 | 49 | 42 | 46 | 48 |
| Other | 11 | 5 | 6 | 5 | 9 | 9 |
| Baseline HIV viral load (copies/ml) | ||||||
| missing | 6 | 3 | 1 | 1 | 5 | 5 |
| <400 | 23 | 10 | 11 | 9 | 17 | 18 |
| 400 – 10 000 | 31 | 14 | 18 | 16 | 24 | 25 |
| 10 001 – 100 000 | 104 | 47 | 50 | 43 | 28 | 29 |
| >100 000 | 56 | 25 | 36 | 31 | 22 | 23 |
| Calendar year of first cART | ||||||
| <1999 | 110 | 50 | 72 | 62 | 49 | 51 |
| 1999-2001 | 20 | 9 | 10 | 9 | 11 | 11 |
| 2002-2004 | 26 | 12 | 19 | 16 | 22 | 23 |
| 2005-2007 | 31 | 14 | 7 | 6 | 6 | 6 |
| 2008-2010 | 33 | 15 | 8 | 7 | 8 | 8 |
| Evidence of Recent Seroconversion | ||||||
| >180 days | 78 | 35 | 41 | 35 | 32 | 33 |
| <180 days | 12 | 5 | 13 | 11 | 19 | 20 |
| Missing | 130 | 59 | 62 | 53 | 45 | 47 |
| Time since first positive (years) | ||||||
| Mean | 4.4 | 3.7 | 3.9 | |||
| STD | 5.0 | 4.5 | 5.0 | |||
| Median | 2.6 | 2.2 | 1.1 | |||
| IQR | 0.3 | 7.3 | 0.2 | 6.2 | 0.1 | 6.5 |
The mixed model regression framework is ideal for analyses with missing observations or incomplete follow-up, as patients who are lost to follow-up or have missing (assumed at random) observations at any time-point can be included in the analysis. This approach minimises lost to follow-up and missing data bias for sample-based model prediction summaries (i.e. mean, median, percentiles). Sensitivity analyses were completed to examine the robustness of our results under various data assumptions, including, restricting data to 24 months of follow-up; expanding data to include all follow-up (greater than 72 months); prospective CD4 cell measurements only; baseline CD4 strata determined from the average of at least two pre-cART CD4 cell measurements, all within one year of initiating cART; baseline CD4 cell count restricted to 6 months prior and 7 days post initiating cART.
To investigate what our observed differences in CD4 count responses might mean in terms of clinical outcomes, we selected from the literature the available data on AIDS, death and AIDS/death incidence rates by CD4 count from three large, different observational cohorts 13-14, 18. External rates of incidence were preferred as we felt that our internal rates calculated from a small number of endpoints (AIDS defining illness=15, mortality=5) were too unreliable. Two of the studies 13, 18 presented adjusted relative risk ratios, which were extrapolated into approximate incidence rates by multiplying the appropriate base group incidence rate by the relative risk ratio. See Table 3 footnote for the base group incidence rate assumed. Using the published disease progression incidence rates by CD4 cell count strata and multiplying these rates with summarized data across baseline CD4 count strata, time and predicted CD4 cell count, we calculated crude event rates and hazard ratio estimates according to the differing baseline CD4 counts.
Table 3.
Cumulative proportion of time (patient years) predicted for CD4 strata over follow up (72 months) and the estimated absolute risk reduction (ARR) and the expected relative risk ratio (RRR) of AIDS and (or) death incidence. ARR and RRR are referenced against the baseline CD4 strata 351-500 cells/μL group.
| Mortality1 | AIDS2 | AIDS/Death3 | |||||||||||||
|---|---|---|---|---|---|---|---|---|---|---|---|---|---|---|---|
| Baseline CD4 (cell/μL) | Predicted CD4 strata | Follow-up (%) in CD4 strata | Hypothetical Patient Year Split (N=1,000) | Estimated No. Events by CD4 strata | Total Estimate No. Events | ARR | RRR | Estimated No. Events by CD4 strata | Total Estimate No. Events | ARR | RRR | Estimated No. Events by CD4 strata | Total Estimate No. Events | ARR | RRR |
| CD4BL 351-500 | <500 | 18 | 180 | 0.9 | 1.8 | 2.3 | |||||||||
| 501-650 | 40 | 398 | 1.6 | 4.0 | 0.00 | 1.00 | 3.4 | 7.8 | 0.00 | 1.00 | 3.6 | 8.9 | 0.00 | 1.00 | |
| 650+ | 42 | 422 | 1.5 | 2.6 | 3.0 | ||||||||||
| CD4BL 501-650 | <500 | 11 | 113 | 0.6 | 1.1 | 1.5 | |||||||||
| 501-650 | 27 | 269 | 1.0 | 3.8 | -0.17 | 0.96 | 2.3 | 7.3 | -0.56 | 0.93 | 2.4 | 8.2 | -0.66 | 0.93 | |
| 650+ | 62 | 618 | 2.2 | 3.8 | 4.3 | ||||||||||
| CD4BL >650 | <500 | 4 | 41 | 0.2 | 0.4 | 0.5 | |||||||||
| 501-650 | 19 | 190 | 0.7 | 3.6 | -0.33 | 0.92 | 1.6 | 6.8 | -1.03 | 0.87 | 1.7 | 7.6 | -1.25 | 0.86 | |
| 650+ | 77 | 770 | 2.7 | 4.8 | 5.4 | ||||||||||
Risk ratio of mortality for treatment naïve HIV-infected patients by current CD4 strata; 0.75, 0.67 for 500-699 and >700 cells/μL respectively, relative to 350-499 cells/μL. Incidence rate assumed for 350-499 cells/μL group is 5.2 per 1000 person years [18].
Incidence risk ratio of an AIDS event for patients on cART by current CD4 strata; 0.86, 0.62 for 500-699 and >700 cells/μL respectively, relative to 350-499 cells/μL. Incidence rate assumed for 350-499 cells/μL group is 10 per 1000 person years [13].
Estimated incidence rate of AIDS/deaths per 1000 person years by current CD4 strata; 13, 9, 7 per 1000 person years for 350-500, 501-650 and >650 cells/μL respectively [14]
The amount of time a patient spent in each predicted CD4 cell count strata was calculated using linear interpolation over the time point ti to ti+6 (i=0, … ,66). For example, if a patient had a baseline CD4 count of 400 cells/μL and at the time point of 6 months had a count of 700 cells/μL, then the patient had spent 2 months in the less 500 cells/μL strata, 3 months in the 501-650 cells/μL strata and 1 month in the >650 cells/μL strata. The total time in each predicted CD4 count strata was calculated by summation across the cohort over 72 months since cART initiation and aggregated into a table by baseline CD4 stratum and predicted CD4 count strata.
As sensitivity analyses, we further split the proportion of time a patient spent below 500 cells/μL into the proportion of time spent <350 cells/μL and 350-500 cells/μL and applied appropriate event rates. Additionally we repeated the above calculations using observed CD4 cell values, where missing CD4 cell values were replaced with previously last known CD4 cell count and patients that were lost to follow-up stopped contributing to the cumulative time totals at the point of drop-out. All statistical calculations were performed with SAS/STAT software, Version 9.2 of the SAS system for Windows.
RESULTS
Of the 3,173 AHOD patients recruited, 1,555 patients recorded a pre-cART CD4 cell measurement and initiated cART with no prior antiretroviral therapy (i.e mono or dual therapy), of these patients, 432 patients were eligible for the analysis. A total of 4,057 CD4 count measurements were recorded over a combined total of 1,957 observed patient years. Of the 432 patients, 71 (16%) were lost to follow-up (estimated rate of 3.0 persons/100 person-years [95% CI: 2.4-3.8]). Table 1 outlines the baseline clinical characteristics and patient demographics by baseline CD4 strata. Covariates have similar proportions in each covariate level across the different baseline CD4 strata. A notable difference is the proportion of patients who are estimated to have evidence of recent seroconversion in the >650 group, which is higher compared to others. Also, the proportion of patients whose year of first cART is 2005 onwards is also higher in the 351-500 cells/μL group.
Regardless of baseline CD4 count stratum, similar proportions of patients had CD4 counts greater than 500 cells/μL after 60 months of cART (Figure 1). The proportion of patients whose CD4 counts were above 500 cells/μL at 12 months (by baseline CD4 strata) was 64%, 84%, 93% and by 72 months was 70%, 69%, 73%. The full timeseries and proportion of patients with CD4 counts >650 cells/μL over time can be found in supplementary digital content-Table 1.
Figure 1.
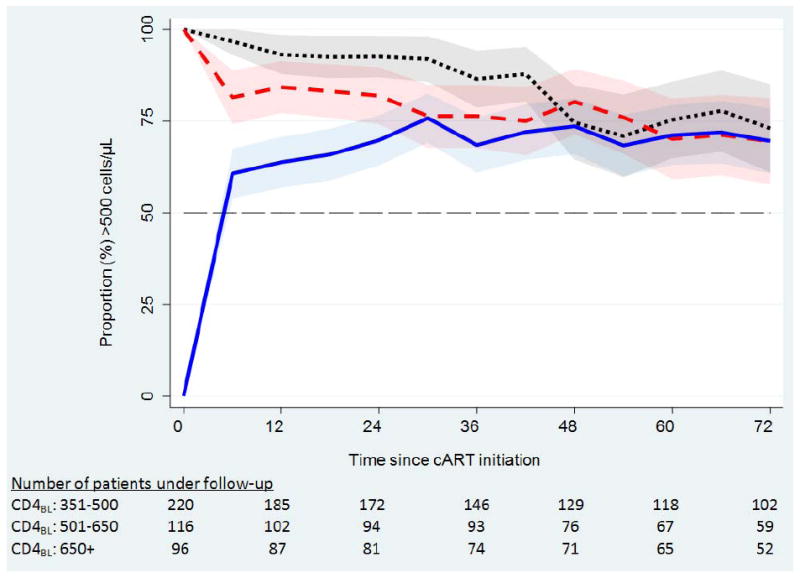
the proportion of patients with CD4 count >500 cells/μL over time since initiation of cART. The shaded regions represent a 95% binomial proportion confidence interval.
We found that CD4 cell counts were largely predicted by time since initiation of cART, baseline CD4 cell count and their interaction (Table 2). The interaction effect between baseline CD4 strata and time period 1 (0, 6, 12 months) was significant (p-value <0.0001), indicating that the response to cART differs depending on baseline CD4 strata. Patients with a baseline CD4 cell count between 350 and 650 cells/μL on average increased their CD4 cell count by approximately 50-100 cells/μL per 6 months and patients in the baseline CD4 count >650 cells/μL group had a mixed response (-23 to 30 cells/μL per 6 months). Globally, no difference between baseline CD4 strata and time period 2 (18, 24, 30 months) was found (p-value=0.12), however marginally, there appears to be some evidence that CD4 cell counts still increased slightly over the period within the baseline CD4 group 351-500 cells/μL (1 to 15 cells/μL per 6 months). The interaction between baseline CD4 strata and time period 3 (36 – 72 months) was significant (p-value=<0.0001). The interaction showed very little changes in CD4 cells counts over this period for baseline CD4 groups 351-500 and 501-650 cells/μL (Table 2), however a slight decrease in CD4 cell counts (-16 to -8 cells/μL per 6 months) for the baseline CD4 group >650 cells/μL.
Table 2.
selected multivariate model parameter estimates and 95% confidence intervals (CI). Individual parameter P-values reflects a Wald test for the parameter estimate being equal to zero. P-value for intercept and interactions reflects a global test of equal effect size.
| Estimate# (cells/μL) | 95% CI | P-value | |
|---|---|---|---|
| CD4BL: 351-500 | |||
| Intercept | 431.1 | [353 to 509] | <.0001 |
| Time* (0, 6, 12) | 81.0 | [63 to 99] | <.0001 |
| Time (18, 24, 30) | 7.9 | [1 to 15] | 0.02 |
| Time (36 – 72) | 2.7 | [0 to 5] | 0.04 |
| CD4BL: 501-650 | |||
| Intercept | 572.9 | [489 to 657] | <.0001 |
| Time (0, 6, 12) | 75.3 | [51 to 100] | <.0001 |
| Time (18, 24, 30) | -0.5 | [-9 to 9] | 0.92 |
| Time (36 – 72) | -0.3 | [-4 to 3] | 0.85 |
| CD4BL: >650 | |||
| Intercept | 887.5 | [794 to 981] | <.0001 |
| Time (0, 6, 12) | 3.4 | [-23 to 30] | 0.80 |
| Time (18, 24, 30) | 4.0 | [-6 to 14] | 0.43 |
| Time (36 – 72) | -12.2 | [-16 to -8] | <.0001 |
| Intercept and Interaction significance tests | |||
| CD4BL (intercept) | <.0001 | ||
| CD4BL × Time (0, 6, 12) | <.0001 | ||
| CD4BL × Time (18, 24, 30) | 0.12 | ||
| CD4BL × Time (36 – 72) | <.0001 | ||
multivariate model was also adjusted for age, sex, baseline HIV viral load, evidence of recent seroconversion, calendar year, HCV co-infection, baseline cART regimen, baseline CD4 cell count, time since initiating cART.
estimate represents CD4 cell count slope per 6 months, i.e. 0 to 6, 6 to 12, etc
Observed and modelled mean CD4 cell counts by baseline CD4 strata and time since commencing cART are summarized in Figure 2 and supplementary digital content (Table 1). Absolute mean CD4 counts were above 500 cells/μL in all baseline CD4 strata by 12 months (means of 596, 717 and 881 cells/μL in baseline CD4 strata 351-500, 501-650 and >650 cells/μL, respectively). Plotting the mean and inter-quartile range for CD4 counts by each baseline CD4 strata (Figure 2) indicates a slight downward trend for the baseline CD4 cell count group >650 cells/μL. Caution is recommended when interpreting the trend for the highest baseline CD4 group. It is probable that this trend is due to a combination of patients with very high counts of CD4 cells dropping out of follow-up and differing proportions of detectable viral load over time. Modelled mean CD4 cell count responses were broadly similar across a variety of model specifications and sensitivity analyses (not shown); model summary results include predictions made for lost to follow-up and missing data.
Figure 2.
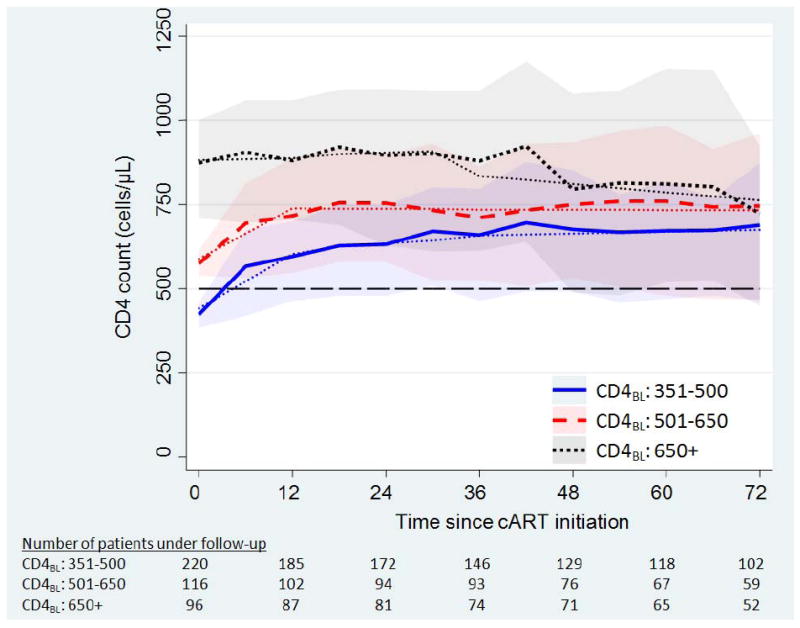
mean CD4 cell count (modelled -- dots) over time since initiating cART, stratified by baseline CD4 count. Shaded bands are the inter-quartile range for the observed CD4 cell counts at a given time point.
The covariate adjusted risk ratios used for the expected reduction in mortality were originally published by Lodwick et al18. These rates of mortality by CD4 cell count for ART-naive patient are presented relative to those with CD4 counts in the range 350-499 cells/μL. The rates found were 0.77 [95% CI: 0.61-0.95] and 0.66 [95% CI: 0.52-0.85] for CD4 count strata 500-699 and ≥700+ cells/μL respectively. Expressing these relative risk ratios as approximate incidence rates, we took the reported population incidence rate (5.2/1000 person years) and multiplied by the relative risk ratios. Table 3 shows the calculated proportion of follow-up time each individual would spend in each predicted CD4 count stratum, i.e. 351-500, 501-650 and >650 cells/μL. We found that the expected reduction in mortality for a patient starting cART with a CD4 count >650 cells/μL compared to a count in the range 351-500 cells/μL over a 72 month period was around 8%, an absolute reduction in risk of 0.33 per 1000 patient years (Table 3). The expected in risk for initiating cART at >650 cells/μL relative to those with 501-650 cells/μL was 4%, an absolute reduction in risk of 0.16 per 1000 patient years (calculated from Table 3).
Two other studies 13-14 found AIDS/death (composite endpoint) crude incidence rates of 13, 9, 7 per 1000 patient years for CD4 count groupings 350-499, 500-649 and >650 cells/μL respectively; and AIDS incidence risk ratios of 1.00, 0.86 [95% CI: 0.66-1.14] and 0.62 [95% CI: 0.44-0.87] for CD4 strata 350-499, 500-699 and ≥700 cells/μL respectively. Applying these event rates and risk ratios to the duration of follow-up in each predicted CD4 cell count strata, the equivalent relative risk reduction for >650 cells/μL relative to 351-500 cells/μL was 14 and 13% respectively. The calculated absolute risk reductions were 1.25 and 1.03 per 1000 patient years (Table 3).
Qualitatively very similar results were found across the scenarios when repeating the calculations using observed CD4 cell counts and also when splitting the proportion of time predicted CD4 count <500 cells/μL into <350 cells/μL and 351-500 cell/μL (data not shown).
DISCUSSION
We found that the observed and modelled CD4 cell response to cART for patients who commenced treatment at higher CD4 cell counts varied depending on the initial baseline CD4 level, the time since cART initiation and their interaction. On average, patients who commenced treatment with a baseline CD4 count 351-500 cells/μL, typically and rapidly (within 6-12 months of commencing cART) achieved and maintained a CD4 count greater than 500 cells/μL. Additionally, the proportion of patients that maintained a CD4 cell count >500 cells/μL after 72 months of follow-up remained above 65% across all baseline CD4 strata. Our data also showed that there is minimal absolute difference between the baseline CD4 strata for predicted mean CD4 cell counts at 72 months after initiating cART (676, 734, 763 cells/μL for baseline CD4 counts 351-500, 501-650 and >650 cells/μL respectively).
Using published data for AIDS incidence and mortality rates, we calculated approximate risk ratios for different CD4 cell count strata when initiating cART. We acknowledge that the event rates published by these large cohorts are based on patient populations that differ from AHOD and typically these rates are not generalisable. However, to our knowledge, these are the only published data available that give clinical event rates/risk ratios in high CD4 count strata, and we felt that it was important to try to illustrate how the CD4 count differences we observed might translate into clinical outcomes.
Our results suggest that for patients enrolled in AHOD who commence treatment at higher CD4 cell count levels (501-650, >650 cells/μL), a small difference in all cause mortality would be expected as compared to patients who commenced treatment with lower CD4 counts (i.e 351-500 cells/μL). It is possible to attribute this minimal reduction in risk finding to the point that overall our patients who commenced cART with a CD4 cell count between 351-500 cells/μL had a favorable immune reconstitution while receiving cART. The accumulated time spent in differing high CD4 cell count strata for the patients who initiated treatment with a CD4 count in the range 351-500 cells/μL typically spend the majority of the time having a CD4 count greater than 500 cells/μL and hence, are deemed to have a smaller risk of mortality. Additionally, the reduction in risk of AIDS when comparing patients initiating cART at >650 cells/μL to 351-500 cells/μL is notable (13%, or approx 1/1000 patients years) and our results show that potentially, initiating cART at CD4 cell counts >650 cells/μL could yield the prevention of hundreds or thousands AIDS events or illnesses.
There are some limitations to our analysis. First, AHOD is an observational cohort study of HIV-infected persons under routine clinical care from a non-random selection of sexual health clinics, hospitals and general practitioners across Australia. Therefore the subset of patients from the AHOD cohort used in the analysis is unlikely to be representative of all HIV infected persons in Australia. Second, it is possible that several patients in our study population initiated cART early by their own admissions, potentially leading to an unmeasured and (or) un-measurable confounder (i.e. risk aversion, health obsessive, etc) that could influence our results. Third, due to the design of AHOD, no information is collected on date of seroconversion. We can estimate a seroconversion date by taking the midpoint between a patient’s last known HIV negative result and their first positive result. However, not all patients are screened regularly for HIV and a large proportion of last known negative test result are unpopulated with values; as a consequence we are unable to determine if we have correctly adjusted for the known influence of seroconversion on CD4 cell counts19. Fourth, although we have used the appropriate statistical methods to account for lost to follow-up and missing data as best as possible, it is not possible to eliminate or quantify any remaining bias within our results. Naturally, this is not only applicable to our study, but it is an inherent trait of any study utilising incomplete observational data. Finally, cART may also increase other illnesses (non-AIDS events) or, increase toxicities. Because minimal data are available at high CD4 cell counts, we were unable to incorporate any associated risks of cART into our analysis.
There is currently no firm consensus on when to start cART in asymptomatic patients with CD4 cell counts >350 cells/μL. Based on observational studies, there is a view that starting cART before any immunodeficiency has occurred is the most likely strategy to minimize morbidity or mortality20. We believe our analysis is the first to compare exclusively CD4 count changes in patients who started cART at CD4 counts >350 cells/μL. Our analysis suggests that patients who start cART at CD4 counts >650 cells/μL have better preserved immune function, but only to a relatively modest degree. Furthermore the extent to which this might be expected to result in better clinical outcomes we show is uncertain. The optimal time to commence antiretroviral treatment (early or deferred) for newly HIV-infected patients is being directly addressed by the Strategic Timing of AntiRetroviral Treatment (START) randomized clinical trial (NCT00867048). The trial compares eligible patients (HIV-infected, treatment naive, CD4 count greater than 500 cells/μL) who are randomised to either a group that receives treatment early (immediately after randomization) or defers treatment until their CD4 count falls below 350 cells/μL. The results are not expected to be reported before 2014 and should provide the most reliable evidence for the optimal time to initiate treatment in asymptomatic individuals.
Supplementary Material
Acknowledgments
All authors contributed to the development of the hypothesis and analysis plan. STW performed the statistical analysis and wrote the first draft of the manuscript. All authors commented on drafts and approved the final version of the manuscript. We would also like to acknowledge the two anonymous referees whose comments helped improve the manuscript. Finally we would like to acknowledge all of the contributors to the AHOD study (appendix 1) who without, this work would not have been possible.
The Australian HIV Observational Database is funded as part of the Asia Pacific HIV Observational Database, a program of The Foundation for AIDS Research, amfAR, and is supported in part by a grant from the U.S. National Institutes of Health’s National Institute of Allergy and Infectious Diseases (NIAID) (Grant No. U01-AI069907) and by unconditional grants from MSD; Gilead; Bristol-Myers Squibb; Boehringer Ingelheim; Roche; Pfizer; GlaxoSmithKline/ViiV Healthcare; Janssen-Cilag. The National Centre in HIV Epidemiology and Clinical Research is funded by The Australian Government Department of Health and Ageing, and is affiliated with the Faculty of Medicine, The University of New South Wales.
Footnotes
Selected data presented at the 15th International Workshop on HIV Observational Databases, Prague, 26th March 2011.
Conflicts of interest: none to declare.
References
- 1.Hammer SM, Squires KE, Hughes MD, et al. A controlled trial of two nucleoside analogues plus indinavir in persons with human immunodeficiency virus infection and CD4 cell counts of 200 per cubic millimeter or less. AIDS Clinical Trials Group 320 Study Team. N Engl J Med. 1997 Sep 11;337(11):725–733. doi: 10.1056/NEJM199709113371101. [DOI] [PubMed] [Google Scholar]
- 2.Gras L, Kesselring AM, Griffin JT, et al. CD4 cell counts of 800 cells/mm3 or greater after 7 years of highly active antiretroviral therapy are feasible in most patients starting with 350 cells/mm3 or greater. J Acquir Immune Defic Syndr. 2007 Jun 1;45(2):183–192. doi: 10.1097/QAI.0b013e31804d685b. [DOI] [PubMed] [Google Scholar]
- 3.Moore RD, Keruly JC. CD4+ cell count 6 years after commencement of highly active antiretroviral therapy in persons with sustained virologic suppression. Clin Infect Dis. 2007 Feb 1;44(3):441–446. doi: 10.1086/510746. [DOI] [PubMed] [Google Scholar]
- 4.Nash D, Katyal M, Brinkhof MW, et al. Long-term immunologic response to antiretroviral therapy in low-income countries: a collaborative analysis of prospective studies. AIDS. 2008 Nov 12;22(17):2291–2302. doi: 10.1097/QAD.0b013e3283121ca9. [DOI] [PMC free article] [PubMed] [Google Scholar]
- 5.Egger S, Petoumenos K, Kamarulzaman A, et al. Long-term patterns in CD4 response are determined by an interaction between baseline CD4 cell count, viral load, and time: The Asia Pacific HIV Observational Database (APHOD) J Acquir Immune Defic Syndr. 2009 Apr 15;50(5):513–520. doi: 10.1097/qai.0b013e31819906d3. [DOI] [PMC free article] [PubMed] [Google Scholar]
- 6.Egger M, May M, Chene G, et al. Prognosis of HIV-1-infected patients starting highly active antiretroviral therapy: a collaborative analysis of prospective studies. Lancet. 2002 Jul 13;360(9327):119–129. doi: 10.1016/s0140-6736(02)09411-4. [DOI] [PubMed] [Google Scholar]
- 7.Emery S, Neuhaus JA, Phillips AN, et al. Major clinical outcomes in antiretroviral therapy (ART)-naive participants and in those not receiving ART at baseline in the SMART study. J Infect Dis. 2008 Apr 15;197(8):1133–1144. doi: 10.1086/586713. [DOI] [PubMed] [Google Scholar]
- 8.Severe P, Juste MA, Ambroise A, et al. Early versus standard antiretroviral therapy for HIV-infected adults in Haiti. N Engl J Med. 2010 Jul 15;363(3):257–265. doi: 10.1056/NEJMoa0910370. [DOI] [PMC free article] [PubMed] [Google Scholar]
- 9.Mocroft A, Vella S, Benfield TL, et al. Changing patterns of mortality across Europe in patients infected with HIV-1. EuroSIDA Study Group. Lancet. 1998 Nov 28;352(9142):1725–1730. doi: 10.1016/s0140-6736(98)03201-2. [DOI] [PubMed] [Google Scholar]
- 10.Hogg RS, Yip B, Chan KJ, et al. Rates of disease progression by baseline CD4 cell count and viral load after initiating triple-drug therapy. JAMA. 2001 Nov 28;286(20):2568–2577. doi: 10.1001/jama.286.20.2568. [DOI] [PubMed] [Google Scholar]
- 11.Baker JV, Peng G, Rapkin J, et al. CD4+ count and risk of non-AIDS diseases following initial treatment for HIV infection. AIDS. 2008 Apr 23;22(7):841–848. doi: 10.1097/QAD.0b013e3282f7cb76. [DOI] [PMC free article] [PubMed] [Google Scholar]
- 12.Sterne JA, May M, Costagliola D, et al. Timing of initiation of antiretroviral therapy in AIDS-free HIV-1-infected patients: a collaborative analysis of 18 HIV cohort studies. Lancet. 2009 Apr 18;373(9672):1352–1363. doi: 10.1016/S0140-6736(09)60612-7. [DOI] [PMC free article] [PubMed] [Google Scholar]
- 13.Mocroft A, Reiss P, Gasiorowski J, et al. Serious fatal and nonfatal non-AIDS-defining illnesses in Europe. J Acquir Immune Defic Syndr. 2010 Oct 1;55(2):262–270. doi: 10.1097/QAI.0b013e3181e9be6b. [DOI] [PubMed] [Google Scholar]
- 14.Guiguet M, Porter K, Phillips A, Costagliola D, Babiker A. Clinical progression rates by CD4 cell category before and after the initiation of combination antiretroviral therapy (cART) Open AIDS J. 2008;2:3–9. doi: 10.2174/1874613600802010003. [DOI] [PMC free article] [PubMed] [Google Scholar]
- 15.May M, Sterne JA, Sabin C, et al. Prognosis of HIV-1-infected patients up to 5 years after initiation of HAART: collaborative analysis of prospective studies. AIDS. 2007 May 31;21(9):1185–1197. doi: 10.1097/QAD.0b013e328133f285. [DOI] [PMC free article] [PubMed] [Google Scholar]
- 16.Kitahata MM, Gange SJ, Abraham AG, et al. Effect of early versus deferred antiretroviral therapy for HIV on survival. N Engl J Med. 2009 Apr 30;360(18):1815–1826. doi: 10.1056/NEJMoa0807252. [DOI] [PMC free article] [PubMed] [Google Scholar]
- 17.Rates of combination antiretroviral treatment change in Australia, 1997-2000. HIV Med. 2002 Jan;3(1):28–36. doi: 10.1046/j.1464-2662.2001.00094.x. [DOI] [PubMed] [Google Scholar]
- 18.Lodwick RK, Sabin CA, Porter K, et al. Death rates in HIV-positive antiretroviral-naive patients with CD4 count greater than 350 cells per mu L in Europe and North America: a pooled cohort observational study. Lancet. 2010 Jul-Aug;376(9738):340–345. doi: 10.1016/S0140-6736(10)60932-4. [DOI] [PMC free article] [PubMed] [Google Scholar]
- 19.Poli G, Pantaleo G, Fauci AS. Immunopathogenesis of human immunodeficiency virus infection. Clin Infect Dis. 1993 Aug;17(Suppl 1):S224–229. [PubMed] [Google Scholar]
- 20.Jain V, Deeks SG. When to start antiretroviral therapy. Curr HIV/AIDS Rep. 2010 May;7(2):60–68. doi: 10.1007/s11904-010-0044-6. [DOI] [PMC free article] [PubMed] [Google Scholar]
Associated Data
This section collects any data citations, data availability statements, or supplementary materials included in this article.