

Abstract
Sleep deprivation (SD) can give rise to faltering attention but the mechanics underlying this remain uncertain. Using a covert attention task that required attention to a peripheral target location, we compared the effects of attention and SD on baseline activity prior to visual stimulation as well as on stimulus-evoked activity. Volunteers were studied after a night of normal sleep (RW) and a night of SD. Baseline signal elevations evoked by preparatory attention in the absence of visual stimulation were attenuated within rFEF, rIPS (sparing SEF) and all retinotopically mapped visual areas during SD, indicative of impaired endogenous attention. In response to visual stimuli, attention modulated activation in higher cortical areas and extrastriate cortex (hV4, ventral occipital areas) after RW. SD attenuated rFEF, rIPS, V3a and VO stimulus-evoked activation regardless of whether stimuli were attended. Notably, the modulation of stimulus-evoked activation by attention was not affected by SD unlike for the preparatory period, suggesting a reduced number, but still functional circuits during SD. Deficits in endogenous attention in SD dominate in the preparatory period, whereas changes in stimulus-related activation arise from an interaction between compromised fronto-parietal top-down control of attention and reduced sensitivity of extrastriate visual cortex to top-down or bottom-up inputs.
Keywords: fMRI, endogenous attention, exogenous attention, preparatory period, sleep deprivation
INTRODUCTION
Faltering attention in the setting of sleep deprivation (SD) contributes to transient cognitive failures (Lim and Dinges, 2010) that can lead to serious traffic, industrial and medical accidents (Mitler et al., 1988; Dinges, 1995; Barger et al., 2006; Philip and Akerstedt, 2006). The reduced ability to direct limited mental resources to process salient information at a given moment can take several forms, specifically the impairment of sustained (Doran et al., 2001; Chee et al., 2008; Tomasi et al., 2009), selective (Horowitz et al., 2003; Mander et al., 2008; Chee et al., 2010; Lim et al., 2010) or divided attention (Drummond et al., 2001). Behavioural impairment in SD can manifest in reduced performance accuracy, slower responses, greater variability in response time and an increase in non-responses (Doran et al., 2001; Lim and Dinges, 2010)
Reduced performance accuracy (Chuah and Chee, 2008; Tomasi et al., 2009; Chee and Tan, 2010), increased non-responses (Chuah and Chee, 2008) and delayed responding (Chee et al., 2008; Chee and Tan, 2010) have been correlated with reduced activation in brain regions that show task-related activity, especially in fronto-parietal regions that bias sensory processing in visual cortex to task-relevant stimuli (Kastner et al., 1999; Hopfinger et al., 2000).
In addition to modulating stimulus-related activation, attention may bias sensory cortical activation in the period preceding target appearance. Such baseline shifts in neural activity have been demonstrated using single-cell recordings in monkey visual cortex (Luck et al., 1997) event related potentials (Grent-’t-Jong and Woldorff, 2007) and fMRI (Sapir et al., 2005; Sylvester et al., 2006; Stokes et al., 2009) in humans. Of specific interest, subjects cued to a specified location show sustained baseline shifts in fMRI signals within retinotopically organized areas in the absence of visual stimulation (Kastner et al., 1999; Sapir et al., 2005; Sylvester et al., 2006; Silver et al., 2007). Hence, observing sleep deprivation induced, state-dependent differences in baseline shifts could allow us to unambiguously infer altered endogenous attention in that state. We hypothesized that we would find evidence for attenuated endogenous attention in the form of reduced baseline shifts during the preparatory period after the cue but before stimulus onset. In contrast, altered stimulus-related responses to attended targets at a peripheral location can result from changes in both bottom-up influences on attention and endogenous attention. The contribution of such bottom-up effects on stimulus-related responses may nevertheless be discerned by examining state differences in responses to unattended peripheral stimuli. Along this line of reasoning we predicted that SD would reduce visual cortex responses to both attended and non-attended targets.
An additional issue of interest is whether lowered visual cortical responses to stimuli in sleep deprived persons primarily originates from attenuated biasing signals arising from the fronto-parietal cortex (Chee et al., 2008; Chee and Tan, 2010) or if this is also due to reduced sensitivity of visual cortex to sensory stimuli. The latter could possibly arise from use-dependent effects accompanying sustained wakefulness (Pigarev et al., 1997; Krueger et al., 2008; Vyazovskiy et al., 2011) - the converse of enhanced excitability of visual cortex induced by light-deprivation (Boroojerdi et al., 2000).
To resolve these questions, volunteers were studied twice with fMRI, once following a normal night of sleep and once following 24h of SD. In one condition, volunteers were cued to covertly direct attention to a peripheral location, in anticipation of targets that appeared after variable periods (Kastner et al., 1999). In another condition, targets were not preceded by a cue and were not attended to. To evaluate the effects of SD on neural activation associated with preparatory attention and visually-evoked activity, we contrasted the magnitude of baseline shift and attentional modulation of stimulus-related activity across task-condition and state in fronto-parietal regions mediating attentional control and retinotopically mapped visual cortex.
MATERIALS AND METHODS
Participants
Twelve volunteers (5 men, mean age 26.4 years, range 22-31 years) participated in the study after giving informed consent and fulfilling the recruitment criteria. Participants had to: (1) be right-handed, (2) be between 18 and 35 years of age, (3) report sleeping 6.5 hours or more each night on a regular basis (4) not be on any long-term medication, (5) have no symptoms suggestive of a sleep disorder and (6) have no history of any psychiatric or neurologic disorders.
Participants’ sleep habits were monitored throughout the two-week duration of the study using motion-sensing by wrist actigraphy. Only persons who kept a regular sleep schedule (slept > 6.5 hours at night; went to sleep no later than 1:00 AM; woke up no later than 9:00 AM) for the week prior to each fMRI scanning session underwent scanning. All participants indicated that they did not smoke, consume any medications, stimulants, caffeine or alcohol for at least 24 h prior to scanning.
Study procedure
Participants visited the laboratory three times - for a practice session, a rested wakefulness (RW) session and a sleep deprivation (SD) session. During the practice session, they were assessed for MR compatibility and were briefed before practicing the experimental task in the scanner. There were 10 practice runs and participants were given feedback on their performance accuracy after each run. Eye movements were observed using an in scanner eye-camera (Resonance Technology, Los Angeles, USA), and each volunteer was evaluated for the ability to maintain fixation and to covertly attend and respond to the targets as described below. At the end of the practice session, qualifying participants were given an actigraph (Actiwatch, Philips Respironics, USA). They were also issued sleep diaries in which they were to record the onset and offset of all sleep bouts.
Brain imaging was conducted on the second and third visits. The order of these scanning sessions was counterbalanced across participants. The first session took place approximately one week after the practice session to ensure that regular sleep times were adhered to. The two scanning sessions were separated by one week to minimize residual effects of sleep curtailment on cognitive performance in participants whose SD session preceded the RW session (Van Dongen et al., 2003).
Scanning commenced at about 8:00 AM in the RW session and at about 6:00 AM after a night of total sleep deprivation for the SD session. These times were chosen as they represent the typical start time of a regular workday and the time when vigilance hits a nadir after a night of sleep deprivation (Doran et al., 2001; Graw et al., 2004).
During the SD session, participants arrived at the laboratory by 7:00 PM and were under the constant supervision of a research assistant. Retinotopic mapping scans were performed at 8:00 PM. From 9:00 PM to 6:00 AM, participants spent the first 12 minutes of each hour completing the Psychomotor Vigilance Task (Dinges et al., 1997; Doran et al., 2001) and rating their subjective sleepiness using the Karolinska Sleepiness Scale. At other times, participants were allowed to engage in non-strenuous activities such as reading and watching movies. Use of caffeine in any form and smoking was strictly prohibited.
Experimental stimuli
There were three types of trials - ‘ attend’, ‘non-attend’ and ‘catch’ sharing an identical temporal structure (Fig. 1). Visual stimuli appeared in the ‘attend’ and ‘non-attend’ trials and consisted of a set of 10 successively appearing displays. Each display contained a complex image presented in the left upper quadrant comprised of an array of 4 colorful patterns, each 2 degrees × 2 degrees in size. A target pattern appeared in the right lower quadrant of the complex image at random, up to 5 times within the sequence. The target pattern was presented at 6 degrees eccentricity from a central fixation cross. To reduce learning effects, 5 different targets were used in the 10 runs that constituted each scanning session.
Fig. 1. Experimental design.
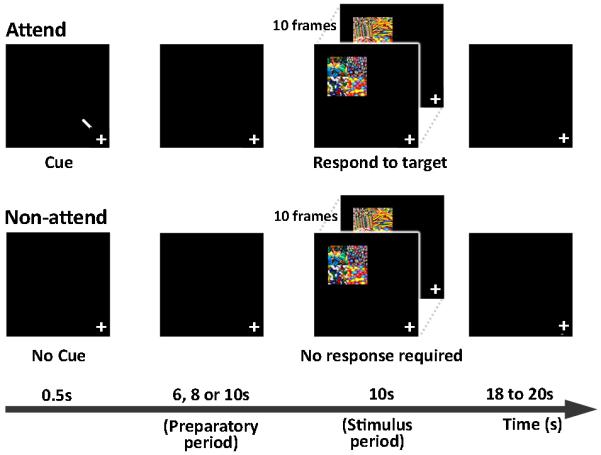
In ‘Attend’ trials (upper panel), participants were cued to covertly attend to the upper left quadrant of the screen by a centrally presented arrow , while maintaining fixation at the centre of the display. After 6, 8, or 10 s, a series of 10 complex images was presented. The images were presented at 6–10 degrees eccentricity from fixation. Note that the complex images are not shown to scale. Each display appeared for 250 ms within a 1 s window. Each complex image comprised an array of 4 colorful patterns. Participants responded to a target pattern, always located in the lower right corner of the complex image. Five different targets were used in each scanning session which involved 10 experimental runs. In ‘Non-attend’ trials (lower panel), there was no cue. Participants maintained fixation and were not required to respond to target stimuli. In ‘catch’ trials (not shown), a cue was presented but was not followed by any images.
These visual stimuli were presented using a set of MR-compatible LCD goggles (Resonance Technology, Los Angeles, USA). Participants responded to targets by pressing a button with their right index finger. An eye-camera was used to continuously monitor eyelid closures and maintenance of fixation. Participants were prompted through the intercom system if they failed to respond to two consecutive targets
All trials shared the same temporal structure - a 6, 8 or 10 s pre-stimulus period where baseline shifts were expected in ‘attend’ but not ‘non-attend’ trials, followed by a 10 s period when the sequence of complex images appeared, followed by 18 or 20 s of fixation (Fig. 1). The effect of endogenous attention on visual cortex activation was assessed during the prestimulus ‘preparatory attention’ period. The effect of attention on stimulus-related activation was assessed when the series of complex images was presented. Each imaging session involved 10 experimental runs, each 6 minutes long. Each run comprised 10 trials, 5 ‘attend’ trials, 4 ‘non-attend’ trials and 1 ‘catch’ trial.
In ‘attend’ trials participants were cued to covertly attend to the target location by a centrally presented arrow that pointed to the left upper quadrant. The sequence of complex images containing the target pattern(s) appeared after a delay of 6, 8, or 10s.
‘Non-attend’ trials, were similar to ‘attend’ trials except that the sequence of complex images was not preceded by a cue. Participants maintained fixation and were not required to respond. In ‘Catch’ trials, a cue appeared and was followed by 28 s of fixation i.e. the sequence of complex images did not appear.
Retinotopic mapping
Polar angle and eccentricity mapping were conducted using procedures described previously (Sereno et al., 1995; DeYoe et al., 1996; Engel et al., 1997; Warnking et al., 2002; Arcaro et al., 2009) and are described only briefly here.
To measure polar angle representation in visual cortex, a wedge that rotated counterclockwise around a central fixation point was used. This wedge spanned 1–11.5° in eccentricity, had an arc length of 90° and moved at a rate of 11.25°/s. To measure cortical representation of eccentricity, an expanding annulus was used. The duty cycle of the annulus was 25%, that is, any given point on the screen was within the annulus for only 25% of the time. The annulus enlarged on a logarithmic scale over time approximately matching the cortical magnification factor of early visual cortex (Horton and Hoyt, 1991). The outer part of the ring expanded to a maximum eccentricity of 11.5° before returning to the foveal origin.
Each rotating wedge/expanding annulus run consisted of 16 cycles lasting 32 s each, amounting to a run duration of 512 s. The rotating wedge was shown for 3 runs of rotating wedge and the expanding annulus was shown for 2 runs. The wedge/annulus used for the retinotopic mapping consisted of a colored checkerboard, with the chrominance and luminance of each check alternating at a flicker frequency of 4 Hz. A transparent wedge/annulus within a dark foreground rotated around a central fixation. The underlying checkerboard was only visible through the transparent wedge/annulus, giving the appearance of a rotating checkerboard wedge/expanding checkerboard annulus. Participants attended to wedge/annulus while maintaining fixation on a central cross. They were instructed to detect a luminance change and to press a button in response. Luminance changes occurred on average every 5 s.
Image acquisition and analysis
Structural and functional brain images were acquired on a 3T Siemens Tim Trio scanner (Siemens, Erlangen, Germany) using a 12-channel head coil. Functional images for the main experiment were collected using a single-shot gradient echo-planar imaging sequence (TR: 2000 ms; TE: 30 ms; flip angle: 90°; field-of-view: 192 × 192 mm; matrix size: 64 × 64 pixels). For each functional volume, 36 oblique 3mm-thick axial slices, aligned to the intercommisural plane, were acquired. Coplanar T1 anatomical images were also obtained to align functional images to a high-resolution 3D-MPRAGE image (TR 2300ms, TI 900ms, flip angle 9°, FOV 256 × 240mm, matrix size: 256 × 256; 192 slices) to register images into a common stereotactic space.
Functional images for retinotopic mapping were also acquired using a single-shot gradient echo-planar-imaging sequence but using different parameters from the main experiment (TR: 2560ms; TE: 27ms; field-of-view: 256 × 256 mm; matrix size: 128 × 128). For each functional volume, 36 transverse, 2 mm-thick slices parallel to the calcarine sulcus were acquired.
Functional images were preprocessed using Brain Voyager QX version 1.10.3 (Brain Innovation, Maastricht). Corrections were made for inter-slice timing differences. Motion correction was performed by aligning functional images to the last image of the functional run acquired immediately before the anatomical coplanar T1-weighted image using three-dimensional rigid-body motion-correction. Temporal high-pass filtering was used to remove linear trends and low frequency scanner drifts (below 0.008 Hz). Spatial smoothing was performed using a 4 mm FWHM Gaussian kernel. Functional volumes were co-registered to the subject’s MPRAGE image before undergoing Talairach transformation.
The functional data was modeled using a general linear model (GLM) with 16 predictors, one for each trial type (‘attend’, ‘non-attend’, ‘catch’ and ‘invalid’) for each period (preparatory and stimulus) and for each state (RW and SD). Trials were deemed ‘invalid’ if participants failed to respond to targets in the ‘attend’ trials or if there was a response during ‘non-attend’ or ‘catch’ trials. This step excluded trials where subjects were possibly briefly asleep. Each predictor was convolved with a canonical hemodynamic response function.
For each individual, regions showing suprathreshold stimulus-related activation were identified as those showing significant activation (thresholded at p<0.00001 uncorrected) relative to fixation baseline in the conjunction (Nichols et al., 2005) of ‘attend’ and ‘non-attend’ conditions in RW as well as SD states.
From the conjunction map involving these four contrasts, three fronto-parietal regions known to mediate attentional control were selected as regions of interest (ROI) for comparison of signal across conditions (Kastner et al., 1999) – frontal eye field (FEF), supplementary eye field (SEF) and intraparietal sulcus (IPS). We obtained signals from the right hemisphere homologs of these areas as the literature regarding the functional anatomy of spatial (Coull and Nobre, 1998) sustained attention (Sturm and Willmes, 2001) suggests a right hemisphere bias to this function. Signals from the voxel showing peak activation and its 6 adjacent voxels were used to generate fMRI time courses for comparison across the four conditions of interest and for each subject.
For analysis of visual cortex data, surface-based retinotopic maps were separately defined for each subject. The cortical surface was first extracted from the MPRAGE images using FreeSurfer (Martinos Centre, Charlestown, MA). Boundary-based registration (Fischl et al., 1999) was then used to align the cortical surface to the functional volumes. Gray matter functional voxels were identified as those intersecting the ‘graymid’ surface – midway between the white-gray matter boundary and pial surfaces. Eccentricity and polar angle maps were derived using conventional Fourier methods (Sereno et al., 1995; Warnking et al., 2002), projected onto the graymid surface and smoothed (4mm FWHM) using heat-kernel smoothing (Chung et al., 2005) (threshold p<0.00001 uncorrected). In this manner, visual areas V1, V2, V3v, V3a, hV4 and Ventral Occipital region (VO) (Brewer et al., 2005; Arcaro et al., 2009) were defined for each individual. Finally, this retinotopic map was intersected with the conjunction map of stimulus-related activation created as described earlier. The resulting patches were then used for signal time course analysis as described for the fronto-parietal regions.
To verify that subjects maintained fixation, activation in V1 patches was checked for topographic specificity. Individuals who showed activity that mapped onto both central and eccentric loci on retinotopically defined visual cortex, (as opposed to only eccentric loci), were excluded from analysis (3 out of 12 subjects).
From each ROI, trial-related averages of signals from both the pre-stimulus/preparatory (0 s to up to −10 s preceding stimulus onset) and stimulus (0 s to 26 s from stimulus onset) periods were obtained for each trial type (attend, non-attend) and state (RW, SD; Figs. 2-5). To determine state and attention effects on the baseline shift and stimulus related activity, paired-samples t-tests (single-tailed, p<.05) were performed on the area under the curve (AUC) for each pair of conditions. These were computed from 4 s to 8s relative to cue onset for preparatory period (or −8 to −4 s for non-attend trials when a cue is absent) and from 4 s to 14s relative to stimulus onset for the stimulus period.
Fig. 2. Time series of fMRI signals in cortical regions of interest.

The time points used in the statistical analyses of state differences for the pre-stimulus (grey) and stimulus-related (blue) periods are indicated. Preparatory attention elicited significant baseline increases in all regions of interest during RW. Baseline activity was significantly reduced during the preparatory, pre-stimulus period in SD in the rFEF, rIPS and all visual areas (p<.05; red asterisk) relative to RW. Stimulus-related activation was significantly higher for attended stimuli in rFEF, SEF, rIPS, V4 and VO but not in V1 or other visual areas. SD attenuated the effects of attention on stimulus-related activation only in rIPS and VO (red asterisks). In SD subjects, responses evoked by unattended stimuli were attenuated in rFEF, rIPS, V3A and VO (green asterisks).
Fig. 5. Flattened cortical maps of the right cerebral hemisphere of a representative subject.

Brain regions demonstrating stimulus-related activation (yellow-red) during RW and SD (p<.0001 uncorrected). Boundaries of retinotopically defined visual areas are outlined in black and labeled accordingly. The purple and green patches within visual cortex represent the intersection between significantly activated patches and retinotopically mapped cortex. Note attenuated activation in SD within regions also activated in RW.
To minimize the effect of differences in absolute magnitude of baseline shift and stimulus-related activation across subjects and across state, signal modulation in preparatory and stimulus periods were evaluated using two additional indices - attention modulation index (AMI) defined as the ratio of signal in (Attend – Non-attend)/Attend conditions and baseline shift index (BSI) defined as the ratio of signal in (Baseline shift/Attend) conditions. Signal magnitudes for these calculations were based on individual signal measures as defined earlier and calculated independently for each state. Single-tailed paired-samples t-tests were used to evaluate between state differences in these indices using a threshold of significance of p < 0.05.
RESULTS
Behavioral findings
Subjects were less accurate at detecting peripheral targets during valid trials (responses within 300ms to 1 s) in SD (mean accuracy RW: 73.6% (Std Dev 9.5%), SD: 59.2% (Std Dev 12.3%); (t(8) = 3.07, p < 0.05); but not significantly slower for correct responses (t(8) = (Mean RT(correct) RW 664 ms (Std Dev 134ms); SD 721 ms (Std Dev 142 ms) t(8)= −0.29, n.s.). This RT data does not fully reflect response slowing in the SD state as responses longer than 1000ms were not accepted as valid. A response at 1200 ms for example, could represent an advance in response to the next target if it were consecutive.
Pre-stimulus and stimulus-related activation after a normal night of sleep (RW)
With respect to the effects of endogenous attention, covertly directing attention to the peripheral target location in the pre-stimulus period, elevated fMRI signal in all fronto-parietal regions of interest relative to the un-cued condition (Fig. 2): rFEF (t(8) = 6.60, p < 0.001), SEF (t(8) = 5.77, p < 0.001) and rIPS (t(8) = 4.84, p < 0.001). Such baseline increases in the absence of visual stimulation were also observed in all visual cortical ROIs, consistent with previous reports (Kastner et al., 1999; McMains et al., 2007): right V1 (t(8) = 5.05, p < 0.001), hV4 (t(8) = 3.27, p < 0.01), VO (t(8) = 2.88, p < 0.05), V3A (t(8) = 3.14, p < 0.01), V2v (t(8) = 4.91, p < 0.001) and V3v (t(8) = 2.96, p < 0.01), .
Analogously, during the stimulus period, attended stimuli elicited significantly greater activation than unattended stimuli in all fronto-parietal regions of interest (rFEF (t(8) = 5.20, p < 0.001), SEF (t(8) = 4.87, p < 0.001) and rIPS (t(8) = 7.54, p < 0.001; Fig. 2). In the visual cortex, increased activation as a result of covertly attending to the stimuli was confined to right hV4 and VO, (hV4 (t(8) = 2.68, p < 0.05) and VO (t(8) = 2.93, p < 0.01; Fig. 2) .
Effects of sleep deprivation on pre-stimulus activation
In the pre-stimulus period during SD, covertly attending to the left upper quadrant in response to the cue continued to elicit higher BOLD signal in all fronto-parietal regions of interest compared to the un-cued condition (rFEF (t(8) = 9.37, p < 0.001), SEF (t(8) = 4.33, p < 0.01), rIPS (t(8) = 3.93, p < 0.005)). However, reflecting a decline in endogenous attention, the signal difference was lower compared to the RW condition in rFEF (0.42% SD vs. 0.52% RW) and rIPS (0.4% SD vs. 0.56% RW; Fig. 2). Critically, the direct comparison of baseline shifts (cue-related signals) across RW and SD, showed a significant effect of state in rFEF and rIPS, but sparing the SEF (rFEF (t(8) = 2.45, p < 0.05), rIPS (t(8) = 2.69, p < 0.05), SEF (t(8) = 0.54, n.s). The finding for SEF indicates that SD does not merely have a global effect on lowering BOLD signals across large-scale networks irrespective of locus or condition, but that SD leads to highly specific effects in parts of the networks that are more vulnerable to changes in state.
During SD, although the effect of attention on pre-stimulus activity was reduced in early visual cortex (V1, V2v, V3A), these signals remained significantly higher compared to the non-attend condition. In contrast, preparatory pre-stimulus signal was markedly attenuated and not significantly different from the non-attend condition in extrastriate cortex hV4, V3v and V0 - areas known to be sensitive to attention (Desimone and Duncan, 1995; Kastner and Ungerleider, 2000; Corbetta and Shulman, 2002). (V1 (t(8) = 3.63, p < 0.01, V2v (t(8) = 2.02, p < 0.05), V3A (t(8) = 1.95, p < 0.05), hV4 (t(8) <1, n.s), V3v (t(8) <1, n.s), VO (t(8) <1, n.s); Fig. 2).
Critically the between state (RW-SD) comparison of baseline shifts showed significantly lowered cue-related signal in all visual areas (V1 (t(8) = 1.91, p < 0.05), V2 (t(8) = 3.15, p < 0.01) and V3v (t(8) = 2.79, p < 0.05, V3A (t(8) = 2.61, p < 0.05), hV4 (t(8) = 3.22, p < 0.01), VO (t(8) = 2.74, p < 0.05), ,Fig. 2).
The effect of sleep deprivation on stimulus-related activation
During SD, the effect of attention on stimulus-related activation remained significant in fronto-parietal regions: rFEF (t(8) = 4.60, p < 0.001), SEF (t(8) = 4.79, p < 0.001), and rIPS (t(8) = 4.62, p < 0.001). However, there was a significant effect of state in the RW-SD comparison of attended stimuli in rFEF and rIPS sparing the SEF (rFEF (t(8) = 2.42, p < 0.05), rIPS (t(8) = 2.47, p < 0.05), SEF (t(8) = −0.60, n.s). The analogous comparison of the effect of state on visual cortex activity found significant differences only in VO (t(8) = 3.79, p < 0.01; Fig. 2).
Interestingly, SD also attenuated stimulus-related responses in the ‘non-attend’ condition. This was observed in rFEF and rIPS as well as VO and V3A, the same areas showing state effects on attention suggesting that previously observed effects of state on stimulus-related activation (Chee et al., 2008; Chee et al., 2010) may be attributable to reduced responses to visual stimulation regardless of whether attention is deployed (rFEF (t(8) = 2.89, p < 0.05), rIPS (t(8) = 2.15, p < 0.05), VO (t(8) = 2.54, p < 0.05) and V3A (t(8) = 2.27, p < 0.05; Fig. 2).
Quantitative analysis of baseline increases and attentional modulation as a function of state
The baseline shift index (BSI) reflects the relative magnitude of the baseline shift and stimulus-related signal when volunteers attend to the cue and the stimulus respectively. The index takes into account inter-individual differences in BOLD signal as well as non-attention related signal differences across state. SD reduced BSI in the several regions that play a role either in the generation of top-down biasing signals-rFEF; t(8) = 2.07, p < 0.05, rIPS; t(8) = 2.60, p < 0.05 as well as in visual cortex hV4 (t(8) = 3.43, p < 0.01, VO; t(8) = 2.98, p < 0.01, V2v; t(8) = 3.17, p < 0.01, V3A; t(8) = 2.89, p < 0.05, and V3v; t(8) = 2.70, p < 0.05; Fig. 3 & 4).
Fig. 3. Mean Baseline Shift Index (BSI) and Attentional Modulation Index across different cortical regions.

fMRI signal change normalized for activation magnitude was assessed using BSI (Baseline shift/Attend) and AMI (Attend – Non-attend)/Attend), as calculated separately for each state and for each individual before being averaged across individuals for display purposes. Across the volunteers, SD reduced BSI in right FEF and IPS, as well as all visual cortical regions except V1 indicating a deficit in endogenous attention. AMIs were not significantly changed due to state in any region indicating regions that show an effect of attention on activation - higher cognitive areas and the extrastriate cortex show comparable reduction in activation across state whether the peripheral stimulus was attended or not. These findings also highlight that SD has a relatively more pronounced effect on the preparatory / prestimulus signal than on stimulus-related activity. Error bars indicate SEM.
Fig. 4. Individual subject’s Baseline Shift Index (BSI) and Attentional Modulation Index across state.

Individual plots of BSI (Baseline shift/Attend) and AMI (Attend – Non-attend)/Attend) comparing these indices across state within each individual show the consistency of SD-induced reduction of BSI (points below the equivalence line) across different subjects in fronto-parietal regions and the visual cortex. This contrasts with the even scattering of points around the equivalence line for AMI indicating no state related shift in AMI.
In contrast, although the AMI was significantly different from zero in all three higher cortical regions (rFEF, SEF and rIPS), and the extrastriate cortex (hV4, VO), SD did not have a significant effect on AMI in any region (all t<1 n.s.; Fig. 3 & 4) indicating that the stimulus-related signal in these areas was lower in SD independent of whether the stimuli were attended.
Taken together, the reduction in BSI across state without a comparable alteration in AMI implies a larger effect on preparatory attention than on modulation of stimulus-related activity.
DISCUSSION
We found that baseline increases evoked in the preparatory period prior to stimulus appearance were attenuated within rFEF, rIPS and all retinotopically mapped visual areas in SD relative to RW, indicative of impaired endogenous attention. The modulation of baseline activity was significant even after accounting for reduced stimulus-related responses in SD. Attenuation of visual cortex activation in SD occurred in early and higher visual cortex when a stimulus was anticipated but absent, but was selective for extrastriate cortex when a stimulus was present, regardless of whether it was attended. Finally, attenuated responses to unattended images during SD were present in the rFEF and rIPS in addition to visual extrastriate cortex, paralleling findings for attended stimuli. Reduced responses to visual stimuli were therefore not limited to the visual cortex. The consistently observed attenuation of stimulus-related activation in higher visual and fronto-parietal cortices during SD likely arose from an interaction between a reduced number of functional circuits in higher cortical areas mediating attention control and reduced sensitivity of extrastriate visual cortex to both bottom-up and top-down inputs.
Attenuated baseline increases reflect the effect of sleep deprivation on endogenous attention
During both RW and SD, preparatory signals in the attend condition within cognitive control regions and visual cortex differed significantly from signals in the non-attend condition, indicating that even in the sleep deprived state, exercise of endogenous attention was possible. However, it was also clear that SD resulted in attenuation of biasing signals from the rFEF and rIPS. As these signal alterations occurred in the absence of visual stimulation they provide unequivocal evidence that SD affects cortical regions mediating endogenous attention. This is likely a result of a reduced number of functional circuits mediating top-down control of attention.
The finding that baseline shift and stimulus-related activation in SEF were modulated by attention (Kastner et al., 1999) but not state indicates that state reductions of rFEF, rIPS and visual cortex signal cannot be simply attributed to a generalized reduction in BOLD response throughout the entire brain. Differential responses during SD to task-driven activation across brain regions have been demonstrated previously (Chee and Chuah, 2007; Chee et al., 2008; Tomasi et al., 2009) involving frontal regions and the thalamus. Indeed, the locus of preserved or elevated activation varies across experimental tasks and may reflect task-specific differences in compensatory brain responses (Drummond et al., 2005).
It is unclear as to why the SEF was not affected by SD in the current experiment. Within the superior medial frontal region where the SEF is located, both reduced activation in working memory (Choo et al., 2005) and Go/No-Go tasks (Chuah et al., 2006) as well as maintained activation in risky decision making experiments (Venkatraman et al., 2007) have been reported. Here, an explanation for why SEF signal is not affected by SD is that it may reflect the requirement for extra effort in order to avoid making saccades to the peripheral target (Stuphorn and Schall, 2006) as attention falters.
Consistent with the notion that reduced baseline shift has functional significance we observed that individual performance was affected during SD. Preparatory period baseline shifts in neural activity in multiple brain areas including sensory, motor and cognitive control areas have been shown to predict trial-by-trial fluctuations in performance (Pessoa et al., 2003; Sapir et al., 2005). Response errors may be anticipated by signal changes preceding the stimulus by as much as 20s (Eichele et al., 2008). Unfortunately, the extended stimulus period used in the current experiment did not allow the analysis of trial-to-trial level effects of baseline shift and behavior.
Reduced visual cortex activation during SD is predominantly a result of attenuated top down signals
Visual perception is affected by the quality of sensory information and its neural representation, making it important to understand the basis for lowered visual cortical responses to stimuli in sleep deprived persons.
One explanation for reduced extrastriate visual cortex activation during SD is that it results from reduced sensitivity of the visual cortex to sensory stimuli that is consequent on persistent engagement of the visual cortex during sustained wakefulness (Chee et al., 2008). This hypothesis arose from mounting evidence that ‘sleep’ need not involve the whole brain simultaneously and that discrete neuronal assemblies can show features suggesting ‘local sleep’ (Krueger et al., 2008; Vyazovskiy et al., 2011). Indeed parts of the brain extensively engaged during wakefulness may require more slow-wave sleep (Huber et al., 2004) and the converse, that areas less engaged need less sleep, may also be true (Huber et al., 2006). Such a ‘use-dependent’ model could explain the diminished visual extrastriate cortex firing rates observed in a macaque performing a visual task following sustained wakefulness. The firing rate recovered after the animal had a brief nap (Pigarev et al., 1997).
Against the strong form of this hypothesis, the effect of SD on reducing visual cortex activation is not uniform. Extrastriate cortex is sensitive to the effects of SD whereas early visual cortex is less so. Whether stimulated with a flickering checkerboard or a peripheral pattern as in the present case, early visual cortex has not shown significant reduction in stimulus-related activity, regardless of a person’s vulnerability to SD (Chee and Tan, 2010).
An alternative explanation for reduced extrastriate responses to visual stimulation in SD is that this arises from reduced generation of top-down attention biasing signals from the fronto-parietal cortex. Supporting this hypothesis, individuals who are less vulnerable to SD have higher fronto-parietal activation that correlates with better preserved extrastriate activation (and behavioral performance) as compared to vulnerable individuals (Chee and Tan, 2010). In the current study, lowered baseline shifts in higher and visual cortex during SD indicate that state-related reduction of top-down biasing signals can account for reduced visual cortical responses. That SD affects early visual cortex activation when only endogenous attention is probed is noteworthy, as it highlights differences in visual cortex responses in the presence and absence of sensory stimulation.
Reduced visual cortical responses to unattended stimuli signify an interaction of top-down and bottom-up effects during SD
As the visual stimuli in the present study were presented to the periphery, decreased sensitivity of the visual cortex to passive visual stimulation (to non-attended stimuli) might be expected to be restricted to the retinopically specific visual cortex. Instead, we observed concurrent reduction in rFEF and rIPS activation and the selective attenuation of visual cortex responses in VO.
These altered rFEF and rIPS responses in SD cannot simply be attributed to an overall attenuation of cortical responses in the task-positive networks as the SEF was spared. Additionally, the selective reduction of extrastriate response in VO to unattended stimuli also cannot be merely attributed to an overall reduction in brain activation during SD as early visual cortex was unaffected. Finally, it is notable that the attentional modulation, as indexed by the AMI, was not affected by SD in any region indicating a proportionate reduction in stimulus-related activation in rIPS, rFEF and VO whether the peripheral stimulus was attended or not. Hence, although during SD and in the absence of sensory stimulation, there is a clear deficit in endogenous attention, the capacity to direct attention to visual stimuli is less affected. Rather, it is the processing of sensory input itself that seems to be affected. Since SEF and early visual cortex are unaffected by SD, and AMI is intact, we can surmise that when they can be recruited, the fronto-parietal-extrastriate circuits involved in responding to stimuli are functional. The problem in SD appears to be a reduction in their number at any given instant as further elaborated on shortly. The most parsimonious explanation for the observed responses to unattended stimuli is that they represent an interaction between a reduction in functional circuits in the sleep deprived brain and the greater sensitivity of extrastriate cortex to the effects of SD and top-down biasing signals.
Reduced functional circuits- sleeping when awake in the sleep deprived state
In addition to the above, other lines of evidence support the case for a reduction in functional circuits available to process visual information during SD as opposed to merely reduced activation levels of these circuits (Fig.6). The strongest support for this hypothesis is the finding that neurons can go into an ‘off’ state in awake but sleep deprived animals who appear to continue to pursue goal directed behavior (Vyazovskiy et al., 2011). Several human functional neuroimaging experiments provide supporting evidence.
Fig. 6. Schematic illustrating how ‘off’ state neurons in awake individuals may affect performance during SD.

Each node represents a neuron and each solid line edge, a functional connection. During RW, ‘neurons’ in the area shaded blue, are activated. They represent the optimal level of activation of neural circuits required to perform the task. During SD, ‘neurons’ in this network represented in open circles go into an ‘off’ state, leaving only a critical minimal circuitry, to execute the task (area shaded pink). This could lead to less efficient processing, or if more neurons enter the ‘off’ state, a brief inability to respond. The light blue ‘neurons’ indicate how other neurons not immediately affected during task performance may be peripherally affected by the ‘off’ neurons going offline.
When visual short term memory and visual item load were separately tested using parametric designs, it was found that SD attenuated parietal and extrastriate activation at all levels of memory or item load (Chee and Chuah, 2007). If the function of neuronal circuits were compromised, as opposed to having fewer of them online at any point in time, one might expect that activation would be affected only as the memory capacity limit was reached. Instead, significant reduction in activation was at all levels of memory or item load in the sleep-deprived state, suggesting that redundant neural activation may occur when we respond to stimuli when not sleep deprived. Such additional activation may be important in ensuring optimal performance in well-rested persons. Conversely, in the sleep deprived state, during correct responses, a critical minimum activation may suffice in fulfilling immediate task goals but barely - leading to overall less accurate and slower performance.
These imaging findings were replicated in a separate group of volunteers using an event-related design where only correct trials were analyzed (Chuah and Chee, 2008). Finally, in a difference due to memory (subsequent memory) experiment, parallel attenuation of activation following SD was observed for both remembered and forgotten items (Chuah et al., 2009), reminiscent of the observation regarding attended and non-attended targets in the present experiment.
As the ‘off’ state of neurons in sleep deprived animals can asynchronously occur in non-adjacent brain regions (i.e. ‘local sleep’), the critical point remains that reduced visual cortical responses to visual stimuli in the sleep-deprived brain are unlikely to be the sole result of reduced sensitivity to visual stimulation. A ‘local sleep’ explanation for alterations in cortical responses to sensory stimulation needs to be further explored in future research.
*Research Highlights.
Preparatory attention is engaged prior to stimulus appearance and indexes endogenous attention
Preparatory and stimulus-driven attention were tested after normal sleep and sleep deprivation
After a normal night of sleep, baseline shifts occured when attention was deployed
Sleep deprivation, attenuated baseline shifts signifying degradation of endogenous attention
Sleep deprivation reduced responses to ignored in addition to attended stimuli
ACKNOWLEDGEMENTS
Annette Chen, Kavitha Dorairaj, Kong Danyang, Jack De Havas, Koh Shuwei and Vanessa Chen contributed to data collection. Su Mei Lee helped with editing. This work was supported by grants awarded to M.C. from the Defense Science and Technology Agency Singapore (POD0713897) and the National Research Foundation Singapore (STaR Award). S.K.’s work is supported by grants from the U.S. National Institute of Health (RO1 MH64043, RO1 EY017699, R21 EY021078) and the National Science Foundation (BCS-1025149).
Footnotes
Publisher's Disclaimer: This is a PDF file of an unedited manuscript that has been accepted for publication. As a service to our customers we are providing this early version of the manuscript. The manuscript will undergo copyediting, typesetting, and review of the resulting proof before it is published in its final citable form. Please note that during the production process errors may be discovered which could affect the content, and all legal disclaimers that apply to the journal pertain.
References
- Arcaro MJ, McMains SA, Singer BD, Kastner S. Retinotopic organization of human ventral visual cortex. J Neurosci. 2009;29:10638–10652. doi: 10.1523/JNEUROSCI.2807-09.2009. [DOI] [PMC free article] [PubMed] [Google Scholar]
- Barger LK, Ayas NT, Cade BE, Cronin JW, Rosner B, Speizer FE, Czeisler CA. Impact of extended-duration shifts on medical errors, adverse events, and attentional failures. PLoS medicine. 2006;3:e487. doi: 10.1371/journal.pmed.0030487. [DOI] [PMC free article] [PubMed] [Google Scholar]
- Boroojerdi B, Bushara KO, Corwell B, Immisch I, Battaglia F, Muellbacher W, Cohen LG. Enhanced excitability of the human visual cortex induced by short-term light deprivation. Cereb Cortex. 2000;10:529–534. doi: 10.1093/cercor/10.5.529. [DOI] [PubMed] [Google Scholar]
- Brewer AA, Liu J, Wade AR, Wandell BA. Visual field maps and stimulus selectivity in human ventral occipital cortex. Nature neuroscience. 2005;8:1102–1109. doi: 10.1038/nn1507. [DOI] [PubMed] [Google Scholar]
- Chee MW, Chuah YM. Functional neuroimaging and behavioral correlates of capacity decline in visual short-term memory after sleep deprivation. Proc Natl Acad Sci U S A. 2007;104:9487–9492. doi: 10.1073/pnas.0610712104. [DOI] [PMC free article] [PubMed] [Google Scholar]
- Chee MW, Tan JC. Lapsing when sleep deprived: neural activation characteristics of resistant and vulnerable individuals. Neuroimage. 2010;51:835–843. doi: 10.1016/j.neuroimage.2010.02.031. [DOI] [PubMed] [Google Scholar]
- Chee MW, Tan JC, Parimal S, Zagorodnov V. Sleep deprivation and its effects on object-selective attention. Neuroimage. 2010;49:1903–1910. doi: 10.1016/j.neuroimage.2009.08.067. [DOI] [PubMed] [Google Scholar]
- Chee MW, Tan JC, Zheng H, Parimal S, Weissman DH, Zagorodnov V, Dinges DF. Lapsing during sleep deprivation is associated with distributed changes in brain activation. J Neurosci. 2008;28:5519–5528. doi: 10.1523/JNEUROSCI.0733-08.2008. [DOI] [PMC free article] [PubMed] [Google Scholar]
- Choo W-C, Lee W-W, Venkatraman V, Sheu F-S, Chee MWL. Dissociation of cortical regions modulated by both working memory load and sleep deprivation and by sleep deprivation alone. NeuroImage. 2005;25:579–587. doi: 10.1016/j.neuroimage.2004.11.029. [DOI] [PubMed] [Google Scholar]
- Chuah LY, Chee MW. Cholinergic augmentation modulates visual task performance in sleep-deprived young adults. J Neurosci. 2008;28:11369–11377. doi: 10.1523/JNEUROSCI.4045-08.2008. [DOI] [PMC free article] [PubMed] [Google Scholar]
- Chuah LY, Chong DL, Chen AK, Rekshan WR, 3rd, Tan JC, Zheng H, Chee MW. Donepezil improves episodic memory in young individuals vulnerable to the effects of sleep deprivation. Sleep. 2009;32:999–1010. doi: 10.1093/sleep/32.8.999. [DOI] [PMC free article] [PubMed] [Google Scholar]
- Chuah YM, Venkatraman V, Dinges DF, Chee MW. The neural basis of interindividual variability in inhibitory efficiency after sleep deprivation. J Neurosci. 2006;26:7156–7162. doi: 10.1523/JNEUROSCI.0906-06.2006. [DOI] [PMC free article] [PubMed] [Google Scholar]
- Chung MK, Robbins SM, Dalton KM, Davidson RJ, Alexander AL, Evans AC. Cortical thickness analysis in autism with heat kernel smoothing. Neuroimage. 2005;25:1256–1265. doi: 10.1016/j.neuroimage.2004.12.052. [DOI] [PubMed] [Google Scholar]
- Corbetta M, Shulman GL. Control of goal-directed and stimulus-driven attention in the brain. Nat Rev Neurosci. 2002;3:201–215. doi: 10.1038/nrn755. [DOI] [PubMed] [Google Scholar]
- Coull JT, Nobre AC. Where and when to pay attention: the neural systems for directing attention to spatial locations and to time intervals as revealed by both PET and fMRI. J Neurosci. 1998;18:7426–7435. doi: 10.1523/JNEUROSCI.18-18-07426.1998. [DOI] [PMC free article] [PubMed] [Google Scholar]
- Desimone R, Duncan J. Neural mechanisms of selective visual attention. Annu Rev Neurosci. 1995;18:193–222. doi: 10.1146/annurev.ne.18.030195.001205. [DOI] [PubMed] [Google Scholar]
- DeYoe EA, Carman GJ, Bandettini P, Glickman S, Wieser J, Cox R, Miller D, Neitz J. Mapping striate and extrastriate visual areas in human cerebral cortex. Proc Natl Acad Sci U S A. 1996;93:2382–2386. doi: 10.1073/pnas.93.6.2382. [DOI] [PMC free article] [PubMed] [Google Scholar]
- Dinges DF. An overview of sleepiness and accidents. J Sleep Res. 1995;4:4–14. doi: 10.1111/j.1365-2869.1995.tb00220.x. [DOI] [PubMed] [Google Scholar]
- Dinges DF, Pack F, Williams K, Gillen KA, Powell JW, Ott GE, Aptowicz C, Pack AI. Cumulative sleepiness, mood disturbance, and psychomotor vigilance performance decrements during a week of sleep restricted to 4-5 hours per night. Sleep. 1997;20:267–277. [PubMed] [Google Scholar]
- Doran SM, Van Dongen HP, Dinges DF. Sustained attention performance during sleep deprivation: evidence of state instability. Arch Ital Biol. 2001;139:253–267. [PubMed] [Google Scholar]
- Drummond SP, Gillin JC, Brown GG. Increased cerebral response during a divided attention task following sleep deprivation. J Sleep Res. 2001;10:85–92. doi: 10.1046/j.1365-2869.2001.00245.x. [DOI] [PubMed] [Google Scholar]
- Drummond SP, Meloy MJ, Yanagi MA, Orff HJ, Brown GG. Compensatory recruitment after sleep deprivation and the relationship with performance. Psychiatry Res. 2005;140:211–223. doi: 10.1016/j.pscychresns.2005.06.007. [DOI] [PubMed] [Google Scholar]
- Eichele T, Debener S, Calhoun VD, Specht K, Engel AK, Hugdahl K, von Cramon DY, Ullsperger M. Prediction of human errors by maladaptive changes in event-related brain networks. Proc Natl Acad Sci USA. 2008;105:6173–6178. doi: 10.1073/pnas.0708965105. [DOI] [PMC free article] [PubMed] [Google Scholar]
- Engel SA, Glover GH, Wandell BA. Retinotopic organization in human visual cortex and the spatial precision of functional MRI. Cereb Cortex. 1997;7:181–192. doi: 10.1093/cercor/7.2.181. [DOI] [PubMed] [Google Scholar]
- Fischl B, Sereno MI, Tootell RB, Dale AM. High-resolution intersubject averaging and a coordinate system for the cortical surface. Hum Brain Mapp. 1999;8:272–284. doi: 10.1002/(SICI)1097-0193(1999)8:4<272::AID-HBM10>3.0.CO;2-4. [DOI] [PMC free article] [PubMed] [Google Scholar]
- Graw P, Krauchi K, Knoblauch V, Wirz-Justice A, Cajochen C. Circadian and wake-dependent modulation of fastest and slowest reaction times during the psychomotor vigilance task. Physiol Behav. 2004;80:695–701. doi: 10.1016/j.physbeh.2003.12.004. [DOI] [PubMed] [Google Scholar]
- Grent-’t-Jong T, Woldorff MG. Timing and sequence of brain activity in top-down control of visual-spatial attention. PLoS Biol. 2007;5:e12. doi: 10.1371/journal.pbio.0050012. [DOI] [PMC free article] [PubMed] [Google Scholar]
- Hopfinger JB, Buonocore MH, Mangun GR. The neural mechanisms of top-down attentional control. Nature neuroscience. 2000;3:284–291. doi: 10.1038/72999. [DOI] [PubMed] [Google Scholar]
- Horowitz TS, Cade BE, Wolfe JM, Czeisler CA. Searching night and day: a dissociation of effects of circadian phase and time awake on visual selective attention and vigilance. Psychol Sci. 2003;14:549–557. doi: 10.1046/j.0956-7976.2003.psci_1464.x. [DOI] [PubMed] [Google Scholar]
- Horton JC, Hoyt WF. The representation of the visual field in human striate cortex. A revision of the classic Holmes map. Arch Ophthalmol. 1991;109:816–824. doi: 10.1001/archopht.1991.01080060080030. [DOI] [PubMed] [Google Scholar]
- Huber R, Ghilardi MF, Massimini M, Tononi G. Local sleep and learning. Nature. 2004;430:78–81. doi: 10.1038/nature02663. [DOI] [PubMed] [Google Scholar]
- Huber R, Ghilardi MF, Massimini M, Ferrarelli F, Riedner BA, Peterson MJ, Tononi G. Arm immobilization causes cortical plastic changes and locally decreases sleep slow wave activity. Nature neuroscience. 2006;9:1169–1176. doi: 10.1038/nn1758. [DOI] [PubMed] [Google Scholar]
- Kastner S, Ungerleider LG. Mechanisms of visual attention in the human cortex. Annu Rev Neurosci. 2000;23:315–341. doi: 10.1146/annurev.neuro.23.1.315. [DOI] [PubMed] [Google Scholar]
- Kastner S, Pinsk MA, De Weerd P, Desimone R, Ungerleider LG. Increased activity in human visual cortex during directed attention in the absence of visual stimulation. Neuron. 1999;22:751–761. doi: 10.1016/s0896-6273(00)80734-5. [DOI] [PubMed] [Google Scholar]
- Krueger JM, Rector DM, Roy S, Van Dongen HP, Belenky G, Panksepp J. Sleep as a fundamental property of neuronal assemblies. Nat Rev Neurosci. 2008;9:910–919. doi: 10.1038/nrn2521. [DOI] [PMC free article] [PubMed] [Google Scholar]
- Lim J, Dinges DF. A meta-analysis of the impact of short-term sleep deprivation on cognitive variables. Psychol Bull. 2010;136:375–389. doi: 10.1037/a0018883. [DOI] [PMC free article] [PubMed] [Google Scholar]
- Lim J, Tan JC, Parimal S, Dinges DF, Chee MW. Sleep deprivation impairs object-selective attention: a view from the ventral visual cortex. PLoS One. 2010;5:e9087. doi: 10.1371/journal.pone.0009087. [DOI] [PMC free article] [PubMed] [Google Scholar]
- Luck SJ, Chelazzi L, Hillyard SA, Desimone R. Neural mechanisms of spatial selective attention in areas V1, V2, and V4 of macaque visual cortex. J Neurophysiol. 1997;77:24–42. doi: 10.1152/jn.1997.77.1.24. [DOI] [PubMed] [Google Scholar]
- Mander BA, Reid KJ, Davuluri VK, Small DM, Parrish TB, Mesulam MM, Zee PC, Gitelman DR. Sleep deprivation alters functioning within the neural network underlying the covert orienting of attention. Brain Res. 2008;1217:148–156. doi: 10.1016/j.brainres.2008.04.030. [DOI] [PMC free article] [PubMed] [Google Scholar]
- McMains SA, Fehd HM, Emmanouil T-A, Kastner S. Mechanisms of feature- and space-based attention: response modulation and baseline increases. J Neurophysiol. 2007;98:2110–2121. doi: 10.1152/jn.00538.2007. [DOI] [PubMed] [Google Scholar]
- Mitler MM, Carskadon MA, Czeisler CA, Dement WC, Dinges DF, Graeber RC. Catastrophes, sleep, and public policy: consensus report. Sleep. 1988;11:100–109. doi: 10.1093/sleep/11.1.100. [DOI] [PMC free article] [PubMed] [Google Scholar]
- Nichols T, Brett M, Andersson J, Wager T, Poline JB. Valid conjunction inference with the minimum statistic. Neuroimage. 2005;25:653–660. doi: 10.1016/j.neuroimage.2004.12.005. [DOI] [PubMed] [Google Scholar]
- Pessoa L, Kastner S, Ungerleider LG. Neuroimaging studies of attention: from modulation of sensory processing to top-down control. J Neurosci. 2003;23:3990–3998. doi: 10.1523/JNEUROSCI.23-10-03990.2003. [DOI] [PMC free article] [PubMed] [Google Scholar]
- Philip P, Akerstedt T. Transport and industrial safety, how are they affected by sleepiness and sleep restriction? Sleep Med Rev. 2006;10:347–356. doi: 10.1016/j.smrv.2006.04.002. [DOI] [PubMed] [Google Scholar]
- Pigarev IN, Nothdurft HC, Kastner S. Evidence for asynchronous development of sleep in cortical areas. Neuroreport. 1997;8:2557–2560. doi: 10.1097/00001756-199707280-00027. [DOI] [PubMed] [Google Scholar]
- Sapir A, d’Avossa G, McAvoy M, Shulman GL, Corbetta M. Brain signals for spatial attention predict performance in a motion discrimination task. Proc Natl Acad Sci USA. 2005;102:17810–17815. doi: 10.1073/pnas.0504678102. [DOI] [PMC free article] [PubMed] [Google Scholar]
- Sereno MI, Dale AM, Reppas JB, Kwong KK, Belliveau JW, Brady TJ, Rosen BR, Tootell RB. Borders of multiple visual areas in humans revealed by functional magnetic resonance imaging. Science. 1995;268:889–893. doi: 10.1126/science.7754376. [DOI] [PubMed] [Google Scholar]
- Silver MA, Ress D, Heeger DJ. Neural correlates of sustained spatial attention in human early visual cortex. J Neurophysiol. 2007;97:229–237. doi: 10.1152/jn.00677.2006. [DOI] [PMC free article] [PubMed] [Google Scholar]
- Stokes M, Thompson R, Nobre AC, Duncan J. Shape-specific preparatory activity mediates attention to targets in human visual cortex. Proc Natl Acad Sci USA. 2009;106:19569–19574. doi: 10.1073/pnas.0905306106. [DOI] [PMC free article] [PubMed] [Google Scholar]
- Stuphorn V, Schall JD. Executive control of countermanding saccades by the supplementary eye field. Nature neuroscience. 2006;9:925–931. doi: 10.1038/nn1714. [DOI] [PubMed] [Google Scholar]
- Sturm W, Willmes K. On the functional neuroanatomy of intrinsic and phasic alertness. Neuroimage. 2001;14:S76–84. doi: 10.1006/nimg.2001.0839. [DOI] [PubMed] [Google Scholar]
- Sylvester CM, d’Avossa G, Corbetta M. Models of human visual attention should consider trial-by-trial variability in preparatory neural signals. Neural networks: the official journal of the International Neural Network Society. 2006;19:1447–1449. doi: 10.1016/j.neunet.2006.09.010. [DOI] [PMC free article] [PubMed] [Google Scholar]
- Tomasi D, Wang RL, Telang F, Boronikolas V, Jayne MC, Wang GJ, Fowler JS, Volkow ND. Impairment of attentional networks after 1 night of sleep deprivation. Cereb Cortex. 2009;19:233–240. doi: 10.1093/cercor/bhn073. [DOI] [PMC free article] [PubMed] [Google Scholar]
- Van Dongen HP, Maislin G, Mullington JM, Dinges DF. The cumulative cost of additional wakefulness: dose-response effects on neurobehavioral functions and sleep physiology from chronic sleep restriction and total sleep deprivation. Sleep. 2003;26:117–126. doi: 10.1093/sleep/26.2.117. [DOI] [PubMed] [Google Scholar]
- Venkatraman V, Chuah YM, Huettel SA, Chee MW. Sleep deprivation elevates expectation of gains and attenuates response to losses following risky decisions. Sleep. 2007;30:603–609. doi: 10.1093/sleep/30.5.603. [DOI] [PubMed] [Google Scholar]
- Vyazovskiy VV, Olcese U, Hanlon EC, Nir Y, Cirelli C, Tononi G. Local sleep in awake rats. Nature. 2011;472:443–447. doi: 10.1038/nature10009. [DOI] [PMC free article] [PubMed] [Google Scholar]
- Warnking J, Dojat M, Guerin-Dugue A, Delon-Martin C, Olympieff S, Richard N, Chehikian A, Segebarth C. fMRI retinotopic mapping--step by step. Neuroimage. 2002;17:1665–1683. doi: 10.1006/nimg.2002.1304. [DOI] [PubMed] [Google Scholar]