

Abstract
The ribonuclease H (RNase H) domain on the p66 monomer of HIV-1 reverse transcriptase enzyme, has become a target for inhibition. The active site is one potential binding site, but other RNase H sites can accommodate inhibitors. Using a combination of experimental and computational studies, potential new binding sites and binding modes have been identified. Libraries of compounds were screened with an experimental assay to identify actives without knowledge of the binding site. The compounds were computationally docked at putative binding sites. Based on positive enrichment of natural-product actives relative to the database of compounds, we proposed that many inhibitors bind to an alternative, potentially allosteric, site centered on Q507 of p66. For a series of hydrazone compounds, small amount of positive enrichment was obtained when active compounds bind by induced-fit docking at the interface between the DNA:RNA substrate and the RNase H domain near residue Q500.
Keywords: HIV RNase H, inhibitors, binding site, docking, receiver operating characteristic curves
1 Introduction
Identifying the binding site for a group of active compounds which inhibit a target protein is often not a trivial task. There may be several potentially druggable sites on the target besides the substrate binding site that could accomodate an inhibitor. Sometimes experimental evidence identifies actives and inactives without indicating where they bind. Structural information about the inhibition site may be incomplete. Computational methods can be used to identify possible druggable sites, but cannot definitively point to the preferred binding site.1–9 Docking programs can be used to place actives into these various sites and provide estimates of the binding energy, but the errors in the estimated energies are often large enough to make unequivocal identification of the binding sites difficult without additional information. The true binding sites have physicochemical features that favor binding active compounds over inactives. The focus of the work reported in this paper is the identification of putative binding sites for inhibitors of the ribonuclease H (RNase H) domain of HIV-1 reverse transcriptase (RT), a new target for anti-AIDS drug design.10–13 One of our groups has developed a fluoresence assay which we have used to identify active inhibitors of the RNase H activity of RT in high throughput screens of ligand libraries.14 Unfortunately, we do not have complementary X-ray structures of complexes for any of the active compounds bound to RT. More generally, there is relatively little information available about the structures of complexes of RNase H inhibitors bound to their receptors, and the little information that is available suggests the possibility of multiple binding sites.15–17
In this work we attempt to leverage the experimental information we have obtained identifying the active inhibitors of the RNase H function of RT in three ligand libraries by performing in silico docking studies against several possible targets. The idea is that the true binding sites will show stronger enrichment of the active inhibitors than non-specific sites. Our previous experience with high throughput in silico docking and enrichment18 provides us with a framework against which to measure the quality of the in silico enrichment curves obtained in the present study. Furthermore, we have recently obtained crystallographic data concerning ligand fragments that bind to HIV-1 RNase H which provides some corroboration of the results reported here. (A PDB file of these results is presented in the Supplementary Material.)
While there have been several effective drug combinations for treating the human immunodeficiency virus (HIV) that causes acquired immunodeficiency syndrome (AIDS), they have not been effective in every patient and they have been prone to become ineffective due to mutations caused by misreads during the viral life cycle. The life cycle of HIV includes i) entry/fusion of the virus to the host cell, ii) release of key enzymes (reverse transcriptase (RT), protease (PR), and integrase) and the viral RNA, iii) translation by RT of the viral RNA to double-stranded DNA, iv) integration of the viral DNA into the host’s genome where it is transcribed to new viral RNA and a polypeptide which is an assemblage of the viral proteins, v) processing by PR the polypeptide into new viral proteins, and vi) assembly of new viruses. Currently, the medications available and in development have disrupted the viral life cycle at most of these stages by inhibiting fusion, RT, PR, and integrase. (See Ref. 19 and references therein). To deal with viral mutations, new drugs have been required to continue to be able to stop HIV replication. RT has been an attractive target because of its multiple and central roles in the life cycle of HIV. RT is a heterodimer with a p66 monomer and the smaller p51 monomer.20 The p66 monomer has two active sites: the polymerase site which builds the DNA onto the viral RNA, and the ribonuclease H (RNase H) site which removes the viral RNA from the newly synthesized DNA:RNA duplex.21 This free DNA strand is finally converted to the duplex strand of DNA for insertion into the host cell’s nucleus. Currently, inhibitors of RT have existed that either bind directly to the polymerase site (the nucleoside RT inhibitors [NRTIs] and nucleotide RT inhibitors [NtRTIs]) or adjacent to it causing an allosteric change disabling polymerase activity (the non-nucleoside RT inhibitors [NNRTIs]). Work has continued to develop medications that target RT at these two sites.19, 21
Recently, work has been focusing on the other RT catalytic site which is located in the RNase H domain on p66. An inhibitor of viral RNase H would break the viral life cycle by stopping the removal of viral RNA from the DNA:RNA duplex and preventing RT from assembling the DNA duplex for insertion into the host’s genome. Currently inhibitors which bind to the metal-chelated active site of RNase H have been identified along with compounds whose binding modes are unclear, but have yet to be developed into viable medications.10–13 Compounds chelating to the metals in the catalytic site of RNase H have included nucleotide derivatives,22–24 diketo acids,25–27 N-hydroxyimides,28 hydroxylated tropolones,29–32 2-hydroxyisoquinoline-1,3(2H,4H)-dione derivatives,33 pyrimidinol carboxylic acids,34 and naphthyridinone-based compounds.35 Compounds with unknown binding modes or with putative binding modes outside of the catalytic site have included quinones from natural products,36–39 hydrazone compounds,15, 40–42 vinylogous ureas,16 thiocarbamates and triazoles.43
As suspected for the quinones, hydrazones, vinylogous ureas, thiocarbamates and triazoles, the active site might not be the only place on the RNase H domain to accommodate an inhibitor. With the exception of one hydrazone15 and one of the naphthyridinone-based compounds,35 the known X-ray crystallographic structures of RNase H inhibitors have them chelating to the active site.32, 34, 35 But there has been evidence that the active site may be inaccessible to inhibitors when the DNA:RNA substrate was bound to RT. In the case of the hydroxylated tropolone β-thujaplicinol, it “appears unable to compete with the intact nucleic acid substrates.”31 The potential exists that inhibitors may bind to alternative sites. Such inhibitors might induce an allosteric change in RNase H disabling the active site in a similar vein as a NNRTI acting on the adjacent RT polymerase site. It might also be possible that an inhibitor will bind to the RNase H domain in a fashion that will prevent the substrate from having access to the active site. The advantage of allosteric inhibitors has been that these binding sites are exclusive to the viral RNase H domain whereas the active site itself is very similar to human RNase H1.44 Inhibitors which bind to the active site of viral RNase H might also bind to human RNase H1 potentially leading to unwanted side effects. We investigated, through a synergistic combination of experimental evidence and computational modeling, the possibility that a collection of natural-product and drug-like active inhibitors were preferentially bound to alternative sites on viral RNase H domain. The identification of possible binding sites where these active inhibitors bind could be utilized for further structure-based drug design.
Programs have been available which attempt to identify potentially druggable binding sites based on their geometry and physicochemical nature.1–9 The physicochemical features that were considered in the interaction between the protein and a potential ligand included desolvation from hydrophobic and hydrophilic surfaces and hydrogen-bonding donor and acceptor regions. To probe for putative binding sites we have chosen SiteMap; it has a reported accuracy of identifying over 80% of the known druggable sites.8 However, as is the case for other druggability prediction programs,45 SiteMap has identified multiple sites per target along with actual binding sites. For RT, there have been multiple potential sites to which a drug-like molecule could bind, even multiple sites located on the RNase H domain. The challenge was to identify which have been the actual sites where RNase H inhibitors may preferentially bind.
Favorable simulated binding energies have not been sufficient to determine if an active inhibitor will preferentially bind to a particular site. Many concavities in a given target can provide favorable van der Waals, electrostatic, and/or hydrogen-bonding interactions to accumulate comparable non-specific binding for active inhibitors and inactive compounds. True binding sites have physicochemical features which favor, on average, active compounds over other inactive weak binders. Our strategy was to use docking and in silico enrichment studies to seach for binding sites capable of making the distinction between actives and inactives based on the predicted binding energy scores for a large set of compounds. A binding site’s discrimination between active and inactive compounds has been manifested in a robust enrichment curve which has described how well actives were found at the top of the ranked database. While scanning the ranked database from lowest energy (most favorable) to highest, the percentage of actives encountered was determined for the percentage of database that had been scanned. The percentage of encountered actives versus the percentage of the database can be plotted as a receiver operating characteristic (ROC) curve (also referred to as an enrichment curve).46, 47 The area under the ROC curve has indicated how rapidly the active compounds were encountered when scanning a ranked database: an area of one indicates that all of the actives have been found at the top of the database (perfect enrichment); an area around 0.5 would indicate that the actives were randomly distributed in the database (no enrichment). Enrichment could also be expressed as a percentage of the actives that were encountered after a small sample (for instance, the top 10%) of the ranked database had been searched.
Previous work using ROC or enrichment curves with a database of known inhibitors and drug-like decoys have focused on benchmarking how well a docking algorithm and its scoring function can discriminate actives from inactives when binding to an experimentally determined site.18, 48–53 It has been argued that this ability should be a key feature for any docking procedure.54 In this work we employed Glide XP55 for the in silico enrichment studies.18, 48–51 Recently, we have benchmarked Glide XP other docking algorithms in terms of its ability to predict enrichment. Glide XP performed well in database screening, finding 85% of the actives in the top 10% of the ranked database, on average.18 Based on its past performance, we believe that Glide XP is reasonably accurate in database screening and discriminating actives from inactives using estimated binding energies when docking to known sites. In this work, we did not know a priori where the actual binding site (or sites) might be. By docking with Glide XP the experimentally-identified actives and inactives in putative sites (several chosen with SiteMap), we sought to determine if that site was the actual binding site based on how well actives ranked relative to inactives in the virtually-screened database. If it was a high affinity binding site, there ought to be substantial enrichment when the database of compounds was docked against that site. Based on our previous work,18 we believed that an enrichment around eight-fold would be strong evidence that the investigated site is the true binding site for those inhibitors. In contrast, if enrichment is absent, then this was evidence against the site being a high affinity site.
2 Methods
2.1 Selection of Putative Binding Sites
The first step in our invesitgation was to identify all potential binding sites on the RNase H domain. We used SiteMap7, 8 to indicate where those sites may be. SiteMap placed a grid over the entire target protein. It assigned vertices that lie inside concavities, but not in the protein itself, as site points. Site points were clustered with other neighboring points to characterize a binding site. Van der Waals and electrostatic probes were placed at the sites to map out the hydrophobic and hydrophilic surfaces, locations where metal chelation could occur, and regions which might accommodate hydrogen bonds with a drug candidate. The SiteScore was calculated to measure how druggable a site might be. SiteScore was an empirical function consisting of a weighted sum of exposure/enclosure, contact, hydrophobic/hydrophilic, and hydrogen-bonding terms. The weights have been optimized on 538 proteins.8 A SiteScore greater than 1.0 has been correlated with a site that might be druggable; a score between 0.8 and 1.0 has generally indicated that a region might be “difficult” with regard to finding a drug-like compound that binds to it; and a score below 0.8 represented a site that was not druggable according to the knowledge-based metrics in SiteMap.8 SiteMap returned the top binding sites ranked based on their SiteScores. We performed SiteMap calculations on RT with metal cofactors in the active site of RNase H, on RT with those metals removed, and RT with the DNA:RNA substrate present.
2.2 In Silico Protein-Ligand Docking Simulation
Once binding sites were selected, we used the protein–ligand docking program Glide XP to predict how compounds may bind to RNase H.55 During the docking procedure, all conformations (rotamers of substituents about a core structure) of the ligand were generated and superimposed (clustered) about some central chemical group of the ligand. Glide XP generated a grid over the binding site on which the ligand will be placed. Based on the size of the ligand cluster, Glide XP eliminated all grid points that are too close or too far from the surface of the pocket. Ligands placed on grid points that are too close would overlap with receptor atoms; ligands placed on grid points that are too far would not make contact with the receptor surface. Also, Glide XP eliminated any grid points that directly overlap the protein. Removal of grid points based on their distance from the receptor eliminated over 90% of the grid points. This was followed by a rough sampling of orientations about each remaining grid point eliminating a further 90% of the remaining orientations. Using the final, accepted set of grid points and orientations, an exhaustive search was then carried out for each ligand conformation in the receptor pocket. The best few hundred poses of the ligand in the receptor pocket from this exhaustive search were minimized using a precomputed grid of van der Waals and electrostatic interactions.56, 57 A Monte Carlo seach of torsional minima and orientations of substituents on the core was performed for a select few poses to further minimize and refine the pose of the ligand in the pocket. The minimized poses were scored with GlideScore XP which is an expanded version of the empirical ChemScore.58 For the best poses, Glide XP docked explicit water molecules around the ligand and receptor pocket to assess desolvation penalties (such as removing waters from polar and nonpolar regions of the receptor to accommodate the ligand) and to calculate the solvation energies of exposed polar and charged groups on the ligand and receptor. Other contributions such as filling in a hydrophobic enclosure in the receptor with a ligand were also calculated. Salt bridges, π-cation interactions and other medicinal chemistry motifs have been incorporated in GlideScore XP as described in Ref. 55.
2.3 Libraries of Compounds
One of the central goals of this project was to find either natural-product or drug-like inhibitors of HIV RNase H. A collection of natural-product compounds was obtained from AnalytiCon Discovery (AnalytiCon Discovery GmbH, Hermannswerder Haus 17, Potsdam, Germany 14473). The AnalytiCon library consists of natural product compounds which possess many hydroxyl and carboxyl groups on carbon backbones. Examples of AnalytiCon compounds are shown in Fig. 1. There are two sublibraries: MEGx compounds which have >90% purity, and Natx which has >95% purity as determined by liquid chromatography/mass spectroscopy and by NMR spectroscopy. There were 2,319 compounds in this library with two-dimensional (2-D) representations. Without information about the three-dimensional (3-D) structure and chirality, we prepared each compound using LigPrep (Schrödinger, LLC) to generate 3-D representations and all possible enantiomers and protonation states for each compound. The library increased to 11,247 structures. The structure of the complex with the lowest energy amongst each compound’s 3-D structures was retained for comparison to the low-energy structures of the other compounds. For each potential binding site, high-throughput virtual screening with Glide XP required between two to three weeks dividing the library of 11,247 structures on eight Opteron 2354 and 2384 processors.
Figure 1.

Representative AnalytiCon compounds are shown with carbon in black and oxygen in red. Clockwise from top left, the compounds are NP-003686, NP-004204, NP-011987, and NP-005114. The abundance of hydroxyl groups is the reason why these compounds are very water soluble and not prone to aggregation.
Based on previous favorable results with hydrazones as inhibitors,15, 40–42 a library of hydrazone/hydrazine compounds were collected from Life Chemicals (Life Chemicals, 2477 Glenwood School Drive Suite 203, Burlington, ON, L7R 3R9, Canada) for testing. Examples of the Life Chemicals compounds are shown in Fig. 2. These compounds have >95% purity as measured by NMR spectroscopy. This library contains 5,544 structures in 2-D representations. For docking with Glide XP, 3-D structures had to be created from the 2-D representations. For each potential binding site, high-throughput virtual screening with Glide XP required between one to two weeks dividing the library of 8,199 structures on eight Opteron 2354 and 2384 processors. Less time was required for the hydrazone/hydrazine library than for the AnalytiCon library because the former comprised of compounds that were less flexible than the latter’s compounds.
Figure 2.

Representative Life Chemicals hydrazone and hydrazine compounds are shown with carbon in black, oxygen in red, sulfur in yellow, iodine in magenta, and bromine in brown. Clockwise from top left, the compounds are F0745-0032, F1092-0760, F1345-0373, and F1345-0193.
The inhibitory activity of the 5,444 hydrazone/hydrazine compounds and the 2,319 natural product compounds was determined using purified recombinant wild-type HIV-1 reverse transcriptase and a high throughput fluorescent assay for the specific measurement of RNase H activity. An 18-nucleotide 3′-flourescein-labeled RNA is duplexed to a complimentary 18-nucleotide 5′-Dabcyl-modified DNA strand. The duplex has very low fluorescent signal, but when RNase H hydrolizes the RNA from the duplex, the labeled fragment dissociates from the DNA resulting in a 50-fold gain in fluorescent signal. The lack of a gain in fluorescent signal in the presence of a particular compound indicates that the compound has inhibited RNase H in an unspecified manner.14 The possibility that aggregation of the compounds might occur has been raised in the literature.59 The AnalytiCon compounds contain a large ammount of hydroxyl functionality rendering them very water soluble. The hydra-zone/hydrazine compounds are less soluble, but we believed that aggregation of the actives was not a concern because we retested the best inhibitors in the presence of low amounts of non-ionic detergents and observed no impact on the inhibitory potency.
In order to maximize the identification of potential high affinity binders, we have chosen a high cut-off of ≥ 80% inhibition at the screening concentration of 10 μM. With this inhibition cut-off, the AnalytiCon 2,319 compound natural product library yielded 84 confirmed hits (3.6%). The Life Chemicals 5,444 compound hydrazone/hydrazine library yielded 338 confirmed inhibitors (6.2%). Compounds which have activities close to but below the 80% inhibition threshold degrade the enrichment signal because they may be scored as false positives whereas they can exhibit substantial inhibition. For the AnalytiCon library this is not an issue because the distribution of activities is close to bimodal. However, for the hydrazone/hydrazine compounds approximately 20% of the library exhibited moderate (between 40% and 80%) inhibition at a concentration of 10 μM. In order to minimize the false positive problem which arises when scoring the hydrazone/hydrazine library because the activity distribution is more continuous, we retained the 50 compounds with the lowest IC50 scores among the 338 actives for docking along with all the inactives. The IC50 scores ranged from 0.17 to 9.22 μM; the highest IC50 for the 50 compounds was 1.14 μM. (The weakly binding active inhibitors were not included in the list of docked compounds.) Had we also removed inactive compounds which showed moderate inhibition, the enrichment signal might have been stronger than what was observed. The library of known inactive AnalytiCon and hydrazone/hydrazine compounds are universal decoys according to the classification by Nicholls.60 The decoys are from libraries of commercially available compounds that share common motifs with the known actives. It should be noted that the decoys employed in our study were experimentally determined by us to be inactive compounds; that is, they showed less than 80% inhibition at 10 μM concentration. The close similarity of actives and inactives presents a challenge to computational enrichment studies.
To add to the diversity of the AnalytiCon and hydrazone/hydrazine libraries, we have included a set of drug-like60 decoy compounds to each set. There were 2,000 compounds with an average molecular weight of 380 Daltons.18 These libraries of decoys provided another challenge in the goal of distinguishing how well the binding sites have preferentially selected active compounds from the collection of inactives. If the binding site could not distinguish actives from inactives, these decoy compounds would have had comparable binding energies and would have prevented any enrichment at that site.
2.4 Receiver-Operating Characteristic Curves
High-throughput virtual screening was carried out with Glide XP using the library of compounds docking to sites indicated as druggable by SiteMap and to the active site with metal cofactors to the crystallographic coordinates for an HIV-1 RT structure deposited in the Protein Data Bank (PDB)61 (PDB accession code 3IG132). Based on a low resolution structure of RT with the DNA:RNA substrate in complex with the hydrazone, THBNH, which indicated that inhibitors may bind between the RNase H domain and the substrate, we also bound compounds at a SiteMap-determined druggable site around residue Q500 on p66 using the RT/substrate structure based on the crystallographic coordinates deposited in the PDB61 (accession code 1HYS62) For each library, using the lowest-binding-energy structure for each compound, we ranked, from lowest to highest binding energies, the compounds into a ranked database for each site. Using the list of active compounds determined by the fluorescent assay,14 we calculated receiver-operating characteristic (ROC) curves (enrichment curves) by determining the percentage of active compounds found within the top 10% of the ranked database. The area under the ROC curve was also calculated as another measure of enrichment.
2.5 Induced Fit Protocol for Docking Ligands with Substrate
One potential binding site was located between the RNase H domain and the DNA:RNA substrate. However, there was not enough space for compounds to bind between the two in the model we selected of RT with the DNA:RNA substrate (PDB accession code 1HYS). This was a model of the crystal structure of RT with DNA:RNA without any other ligand bound. We initially docked compounds at this site with reduced van der Waals radii (i.e. a softened receptor). The top ten compounds (based on binding energies) were selected to be used as a wedge between the DNA:RNA substrate and RT. Using full van der Waals radii with a docked compound in place, a conjugate gradient minimization of each entire complex was performed with the IMPACT package.63 The compounds were removed and the library of compounds was redocked to the new conformations of RT and the DNA:RNA substrate.
3 Results and Discussion
3.1 Prediction of Putative Binding Sites
The SiteMap calculation identified several potential, druggable binding sites on HIV RT without the DNA:RNA substrate present. Two sites were located in the vicinity of the RNase H domain. One site was on the substrate binding side of RT centered between p66 residue W406 and Q500 (“site 406” since residue 406 is at the center of the site) between the active site and the p51 domain. The other site was centered on residue Q507 (referred to as “site 507” for the central residue) on p66 on the opposite side from the substrate binding side of the RT and the RNase H domain. The right site of Figure 3 shows the location of site 507 on RT. Both of these sites consisted of residues that provide hydrogen bond donors or acceptors from either side chains or backbone and also consisted of neighboring patches of residues that can make hydrophobic interactions with a ligand. For site 507, the hydrogen bonding residues, either by side chains or backbones, are T403, E404, K431, E430, Q507, and W535 on p66, and K331 and L425 on p51. The hydrophobic interactions at site 507 are between the ligands and residues W401 and W535 on p66, and L422 and L425 on p51, and between the ligands and the base of the sidechains of E404 and Q507 on p66 and K331 on p51. These two sites, 406 and 507, were separated by a thin layer of protein (only a few Ångstroms in thickness) at the interface of p66 and p51. During docking, since there was no significant separation between site 406 and site 507, the docking grid encompassed both sites. Consequently, attempts to bind to site 406 resulted in ligands placed preferentially in site 507. In other words, the best binding energies were found at site 507 instead of site 406. In light of this, our docking calculations will focus on site 507 instead of site 406. SiteMap did not indicate that the active site around residue D498 (referred to as site 498) on p66 was a druggable site (the SiteScore is estimated to be below 0.5, significantly lower than the threshold of 0.8). This was due to the shallow-well geometry of the site. It might also have be due to the cofactor metals giving the site too much of a hydrophilic character.8 Nevertheless, inhibitors have been identified which bind to the active site cofactor metals.32, 34, 35 We will also explore the active site (site 498) as a potential binding site.
Figure 3.

Images are shown to point out where the binding sites explored in this study are located on RT. On the left, the complex of RT and the DNA:RNA substrate is shown with p66 in blue (“fingers”), red (“palm”), green (“thumb”), yellow (“connection”), and orange for the RNase H domain with the active site residues in red spheres. The p51 domain is in brown, and the DNA:RNA substrate (stick representation) in transparent gray. Site 500S is highlighted with the bound hydrazone inhibitor F1345-0193 shown in cyan spheres behind the transparent gray substrate and located at the intersection of the yellow, orange and brown domains. On the right, the opposite side is shown after a 180° rotation of the molecule on the left, showing the AnalytiCon compound NP-003686 (in cyan) bound to site 507 (with residue 431 represented in sticks for a better perspective on NP-003686) located at the intersection of the orange and yellow domains of p66 and the p51 brown domain. These representations were generated with VMD.70
Preliminary X-ray crystallographic results suggested that the compound trihydroxybenzoylnaphthyl hydrazone (THBNH) was bound to RT with the DNA:RNA substrate in place. We explored if the interface between the RNase H domain and the substrate could be defined as a druggable binding site with SiteMap. A large site centered around residue Q500 (referred to as “site 500S” for the central residue with the “S” to indicate the presence of the substrate) on p66 on the RNase H domain was predicted by SiteMap to be druggable with a favorable SiteScore at 1.04. This site was not a conventional protein or nucleic acid target for binding, but a combination of both where the binding site consisted of both protein and nucleic acid. Significantly, residue Q500 on p66 has been shown to bind to the nucleic acid template only one nucleotide base away from the scissile phosphate at the RNase H active site.62 Based on the experimental and SiteMap results, we have used this site at the interface of RNase H and substrate as a target for the libraries of compounds. The location of this site has been shown in the left side of Figure 3.
3.2 AnalytiCon Library Results
The results from the Glide XP high-throughput virtual screening of the AnalytiCon and decoy compounds to the sites 498, 500S and 507 indicated that the active compounds prefer binding to site 507 as shown in the distribution of GlideScore XP energies in Fig. 4. A histogram of the differences in binding energies for each active compound bound at sites 507 and 498 has been shown in Fig. 5. While most of the differences were negative indicating that more actives favored binding to site 507, several active compounds preferred to bind to the active site at 498. The top five compounds that preferentially bind to site 507 had an average −14.04 kcal/mol binding energy. The largest component of this binding energy was the hydrogen-bond interaction between the active inhibitor and the backbones of the residues in site 507 with an average energy of −6.93 kcal/mol and nine hydrogen bonds. The next largest component was a hydrophobic interaction which on average was −5.41 kcal/mol. This hydrophobic interaction was primarily between the actives and the following residues: L503 on p66, L425 on p51, and the base of the side chain of K424 on p51. The top 5 compounds that bind to the active site, site 498, had an average binding energy of −11.83 kcal/mol. The largest component was the hydrogen-bond interaction at −5.50 kcal/mol, but a strong electrostatic interaction was on average −4.19 kcal/mol due to inhibitor carboxylate groups chelating to the cofactor metals located in site 498. The active site was not as hydrophobic as site 507: the hydrophobic score at site 498 was small at −2.18 kcal/mol. The question that we address now was whether the composition of either site selectively favored actives over inactives.
Figure 4.

The distribution of the GlideScore XP5.0 binding energies for the 84 AnalytiCon active compounds are plotted relative to each other for the binding sites at 498, 500S, and 507. The solid red curve is the distribution for site 507; the dotted and dashed green curve, for site 498; and the dashed blue curve, for site 500S. Figure was generated with R.71
Figure 5.

The histogram of the difference in GlideScore XP5.0 binding energies at site 507 (“BE(507)”) and at site 498 (“BE(498)”). Bars with negative energy differences show actives that favor site 507; bars with positive energy differences show actives that favor site 498. Figure was generated with R.71
A method has been recently proposed by Fukunishi and Nakamura to determine the correct binding site by docking a random library of compounds to all possible binding sites on a protein. They show that the average docking score was the best when the random collection of compounds was bound to the known site.64 This approach is similar to our proposed method in that both attempted to identify the binding site by docking large libraries of compounds. However, they used libraries of compounds without prior identification of actives and inactives, whereas we have identified experimentally the actives and inactives and use this additional information in our computational enrichment studies. As reported below, having access to the additional experimental information concerning which compounds in the library are active is helpful in distinguishing competing binding sites. Based on the formalism of Fukunishi and Nakamura,64 we calculated the average energy of the AnalytiCon library of 2,319 compounds; we found that the averages were very close at −6.0±2.3, −5.9±2.4, and −5.6±2.1 kcal/mol for sites 507, 500S and 498, respectively. The standard deviations indicate that the differences between these averages are not significant. As it is not possible to distinguish binding sites based on these averages, in this case the construction of enrichment curves provides a better way to identify the most likely binding site for the AnalytiCon compounds.
Receiver-operating characteristic (ROC) curves (or enrichment curves) detailed how well these sites distinguish active from inactive AnalytiCon compounds. At site 498, 37% of the actives are found in the top 10% of the database as shown in Fig. 6 where the red curve was the ROC curve from the virtual screen and the blue curve was for comparison and showed what the ROC would look like if the actives were randomly distributed in the database (i.e., not preference for actives over inactives). This was an almost four-fold enrichment of actives in the top 10% of the database. The area under the ROC curve was 0.80 which shows that the enrichment was better than random (for which the area under the ROC curve would be 0.5). While this enrichment was significant, it was not as robust as the average eight-fold enrichment reported in Zhou et al.,18 which raised the question if this was the true binding site for the AnalytiCon inhibitors.
Figure 6.

The receiver-operating characteristic (ROC) curve in red is plotted showing what percentage of AnalytiCon active compounds is found in the ranked database of all compounds bound to site 498. The selectivity (Se) of finding active compounds within some threshold is plotted against one minus the specificity (1-Sp) which indicates the number of inactive compounds found within that threshold. The blue line indicates the ROC if the actives were randomly distributed in the database. The enrichment is 37% of the actives found in the top 10% of the screened database. The area under the ROC curve is 0.780. Figure was generated with R.71
The enrichment of actives when binding with Glide XP to site 507 was considerably more robust than to site 498: the level of enrichment was roughly eight-fold with 76% of the actives found in the top 10% of the database as shown in Fig. 7. This level of enrichment was consistent with the average level we reported in Zhou et al.18 We believe that this significant level of enrichment is achieved when the actives bind to a true active site. The eight-fold enrichment of the actives meaningfully reflects that site 507 was the main binding site for the AnalytiCon inhibitors. The shape of the ROC curve in Fig. 7 displayed a very strong, steep response in selecting the actives from the inactives. (A steep response was absent at site 498 as seen in Fig. 6). Both the selectivity and specificity were robust in distinguishing true positive actives in general from the true negative inactives. The area under the ROC curve for site 507 was 0.87 which is stronger than for site 498. The very favorable binding energies of actives and more robust distinction of actives from the rest of the database supported the conclusion that more of the AnalytiCon inhibitors preferentially were bound to site 507 than to site 498. The physicochemical composition of site 507 better differentiated between the AnalytiCon actives and inactives than site 498 supporting the suggestion that site 507 was the more likely binding site of the experimentally-determined actives. As shown in Fig. 3, this site was on the opposite side from the substrate binding region and the active site of RNase H (site 498).
Figure 7.

The ROC curve in red is plotted showing what percentage of AnalytiCon active compounds is found in the ranked database of all inactive compounds bound to site 507. The blue line indicates the ROC if the actives were randomly distributed in the database. Figure details can be found in the caption of Fig. 6. The enrichment is 76% of the actives found in the top 10% of the screened database. The area under the ROC curve is 0.824. Figure was generated with R.71
There is recent experimental support for our enrichment studies which suggest that site 507 is a true alternative binding site for inhibitors of RNase H. Fragment-based drug design targeting RT is being carried out in the Arnold lab. Crystals of RT are soaked in a cocktail of several compounds. Through X-ray crystallography, compounds which bind to RT have been identified. One of these compounds is a 2-(((2-(3,4-dihydroquinolin-1(2H)-yl)-2-oxoethyl)(methyl)amino)methyl)quinazolin-4(3H)-one (referred to as EN37) which binds at site 507 (the compound is centered on Q507). (A PDB file has been added as Supplementary Material.) We were able to redock with Glide XP EN37 to site 507 of RT to within 1.8Å RMSD from the X-ray orientation. The profile of the binding energy between this quinazolinone and site 507 has contributions involving hydrogen-bond interactions and also hydrophobic interactions similar to the AnalytiCon compounds which are the focus of the current study. An AnalytiCon active compound (NP-003686) is shown along with compound EN37 bound in site 507 in Figure 8. Both compounds overlap when bound in this site.
Figure 8.
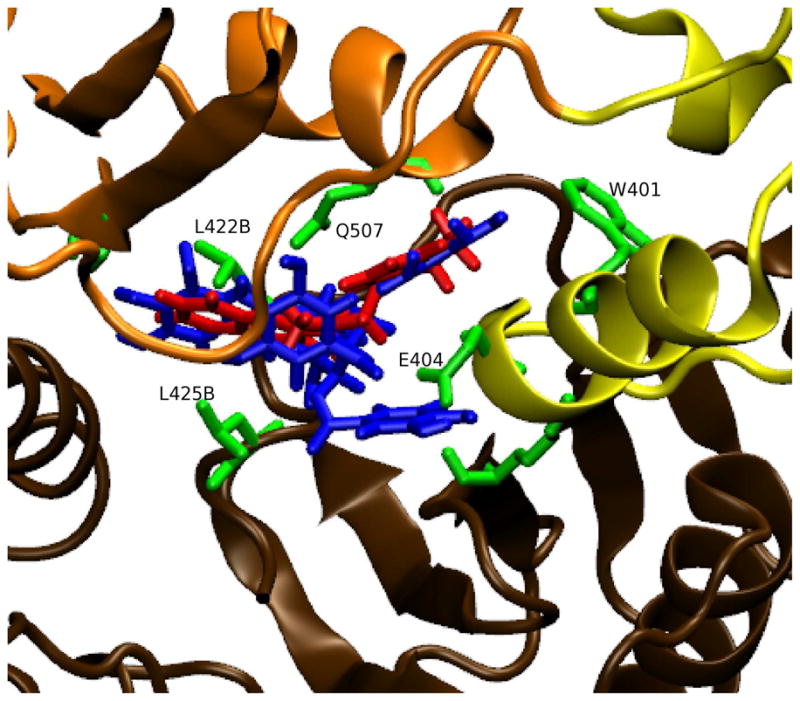
The binding orientations of AnalytiCon compound NP-003686 (in blue) and compound EN37 (in red) are shown superimposed in site 507. The RNase H domain of p66 is in orange, the connection region of p66 is in yellow, and p51 is in brown. In green are residues that interact hydrophobically with the compounds. The residue labels end in “B” if the residue belongs to p51. This representation was generated with VMD.70
The RNase H domain on p66 makes contact with p51 by a thin interface between the two. It was possible that the RNase H domain would pivot about this interface between p66 and p51. The AnalytiCon active inhibitors were large; when bound in site 507, they may have nudged the RNase H domain to a position where the active site might no longer be able to catalyze the removal of RNA from the DNA:RNA duplex. (A few of the inactives had comparable binding energies to the actives; it is possible these inactives might actually bind, but were not able to change allosterically the RNase H domain leading to inhibition.) We believe this site might be a suitable target for new inhibitors. The advantage of binding to site 507 is that it is unique to RT. The RNase H active site is similar to human RNase H1;44 therefore, inhibitors that bind to site 498 may interfere with human ribonuclease H and produce unwanted side effects.
An unconventional binding mode for RNase H inhibitors had been proposed based on limited crystallographic data. In this mode, the inhibitors would bind between the RNase H domain and the DNA:RNA duplex preventing the substrate’s access to the active site. SiteMap calculations supported the possibility that this region, site 500S, is druggable. We also docked the AnalytiCon library to site 500S. We found a six-fold enrichment of the AnalytiCon active compounds when binding to site 500S (see Fig. 9). The selectivity and specificity in the ROC curve for site 500S was not as robust as for site 507. While there was a steep rise in the ROC curve for site 500S, it was not sustained signifying that more false positives were encountered among the true positives of the active inhibitors. Nevertheless, there was some signal at site 500S. Did site 500S compete with site 507 for the same inhibitors as is potentially indicated in Fig. 4? A comparison of binding energies of the actives at site 507 with those at site 500S indicated that the compounds tend to prefer one site over the other based on the relative binding energies. The difference in energies for an inhibitor binding at each site was significant, between two to five kcal/mol.
Figure 9.

The ROC curve in red is plotted showing what percentage of AnalytiCon active compounds is found in the ranked database of all compounds bound to site 500S with the DNA:RNA substrate present. The blue line indicates the ROC if the actives were randomly distributed in the database. Figure details can be found in the caption of Fig. 6. The enrichment is 58% of the actives found in the top 10% of the screened database. The area under the ROC curve is 0.815. Figure was generated with R.71
3.3 Hydrazone/hydrazine Library Results
No enrichment was observed for the Life Chemical hydrazone and hydrazine compounds at sites 498 and 507 with Glide XP high-throughput virtual screening. The levels of enrichment of the 50 strong-binding actives was essentially no better than a random mixture of the actives in the database. The enrichment was absent; only 8% of the actives were found in the top 10% of the ranked database. The areas under the ROC curves ranged between 0.505 and 0.555, showing that the actives were essentially distributed randomly in the database. These null results, which were from a combination of experimental and virtual screenings, did not support the selective binding of active hydrazone and hydrazine compounds to sites 498 and 507.
Recently, preliminary X-ray-crystallographic evidence had been obtained suggesting that the hydrazone compound THBNH may bind between the RNase H domain and the duplex DNA:RNA substrate. We decided to explore the enrichment targeting this unconventional binding mode (a binding pocket that is a combination of protein and nucleic acid) for the library of the hydrazone and hydrazine compounds. Using the structure of 1HYS62 as our model of RT with the DNA:RNA substrate, we targeted the binding of the compounds to the site around residue 500 on p66 (site 500S) based on the crystal structure and on SiteMap predictions (see Fig. 3). The initial ROC curve in Fig. 10 did not show very much enrichment (only 15% of the actives were in the top 10% of the ranked database), but the density plot in Fig. 11 showed some signal of potentially useful enrichment with a shoulder peak in the actives’ curve between −9 to −6 kcal/mol. We suspected that the binding region at site 500S was not open enough in the model 1HYS for all compounds to fit properly. It seemed possible that the DNA:RNA substrate would be displaced partially from the RNase H domain by compounds binding in the vicinity of site 500S.
Figure 10.

The ROC curve in red is plotted showing what percentage of hydrazone/hydrazine active compounds is found in the ranked database of all compounds bound to site 500S (between RNase H and the DNA:RNA substrate). The blue line indicates the ROC if the actives were randomly distributed in the database. Figure details can be found in the caption of Fig. 6. The enrichment is 15% of the actives found in the top 10% of the screened database. The area under the ROC curve is 0.512. Figure was generated with R.71
Figure 11.

The distribution of GlideScore XP5.0 binding energies of the hydrazone/hydrazine active compounds (red solid curve) is shown relative to the distribution of database energies (blue dotted curve) when docking to site 500S. Notice the shoulder peak comprises of the actives with binding scores between −9 to −6 kcal/mol. Figure was generated with R.71
The induced fit docking protocol in this study started with ten active hydrazone or hydrazine compounds that successfully docked, using reduced van der Waals radii of the receptor, at site 500S (i.e. found in the shoulder peak of Fig. 11). Each of these ten compounds was used as a wedge to open up the space between the RNase H domain and the DNA:RNA duplex. A conjugate-gradient minimization was performed with the IMPACT package63 on each complex of the bound inhibitor compound, RT, and the substrate using full van der Waals radii. These minimizations created ten new configurations of RT with the DNA:RNA substrate. The entire hydrazone/hydrazine compound library was then docked to site 500S on each of these ten new configurations. As seen in the ROC curve in Fig. 12, the enrichment grew from 15% to 24%, better than two-fold enrichment at 10% of the ranked database, in the best of these ten cases. The area under the ROC curve was 0.574 which was still a weak signal but an improvement relative to what was observed at the other sites for the hydrazone/hydrazine compounds. While the presence of a weak signal at site 500S is an improvement over no signal, we are not as confident in these results based on our previous work with enrichment curves which suggests that a true enrichment should be on the order of eight-fold18 as we observe with the AnalytiCon actives at site 507. We asked whether this weak signal could be a weak indicator that site 500S was a binding site for the hydrazone/hydrazine active inhibitors; we compared the density plots of the energies before and after our induced fit procedure. The shoulder in the density plot of energies for the actives grew in magnitude without a shift to lower energies by the inactive compounds in the database, as shown in Fig. 13, which is clearly an improvement in what was shown in Fig. 11. On average, the inactive compounds shifted to less favorable energies while several of the actives shifted to more favorable energies. Another, more computationally costly, approach would be to use a dummy atom positioned between the substrate and the RNase H domain and to adjust the radius of the dummy atom to incrementally move the substrate away from RT. With appropriate increments in the radius of the dummy atom, we could obtain a range of displacements that would accommodate more ligands. The high-throughput screening calculation would grow depending on the number of increments in the dummy atom radius that we use. Nevertheless, the approach using a bound inhibitor as described in this paper was a simpler and more direct way to obtain a ligand-sized separation between substrate and RT. Our approach avoided having to repeat high-throughput virtual screening of the library on several dozen potential targets that were created with different increments.
Figure 12.

The ROC curve in red is plotted showing what percentage of hydrazone/hydrazine active compounds is found in the ranked database of all compounds bound to site 500S of the minimized RT-DNA:RNA complex. The blue line indicates the ROC if the actives were randomly distributed in the database. Figure details can be found in the caption of Fig. 6. The enrichment is 24% of the actives found in the top 10% of the screened database. The area under the ROC curve is 0.574. Figure was generated with R.71
Figure 13.

The distribution of GlideScore XP5.0 binding energies of the hydrazone/hydrazine active compounds (red solid curve) is shown relative to the distribution of database energies (blue dotted curve) when docking to site 500S of the minimized RT-DNA:RNA complex. Notice the shoulder peak comprises of the actives with binding scores between −9.5 to −6 kcal/mol. Figure was generated with R.71
The average GlideScore XP energy for the top 5 actives was −6.98 kcal/mol. The major component of that energy was the hydrophobic interaction at −5.51 kcal/mol on average. The compounds were positioned to form a hydrophobic interaction with RT and with base-pairs in the groove of the DNA:RNA substrate. The compounds were positioned between RT and the substrate between residues Y405 and W406 on p66 and between residues Q500 and Y501 on p66. Along with the evidence of THBNH bound to the complex of RT and substrate, there has been the evidence that mutations of Y501 result in resistance to inhibition by the hydrazone BBNH (N-(4-tert-butylbenzoyl)-2-hydroxy-1-naphthaldehyde hydrazone).41 A mutation at Y501 would clearly have an effect on the binding of the library of hydrazone and hydrazine compounds at the target site 500S described by the ROC curve in Figure 12. This has provided further support to enrichment results described in this section which indicate the possibility that site 500S with the bound substrate was a conceivable binding mode for compounds in the hydrazone/hydrazine library.
Our recent NMR studies of the interaction of the acylhydrazone inhibitor BHMP07 with an isolated HIV-1 RT RNase H domain fragment17 have provided compelling support for the site 500S binding. In these 1H-15N HSQC experiments, the inhibitor was bound to the isolated domain without substrate present. Several residues were perturbed, based on changes in chemical shifts, in the presence of the acylhydrazone inhibitor. These residues included D499 and A502 are adjacent to Q500.17 These residues are part of the primer grip of the RNase H domain and play a role in aligning the DNA:RNA substrate with the active site.62 An inhibitor like the hydrazones binding at Q500 would clearly disrupt the primer grip’s role in the activity of RNase H.
4 Conclusion
In this work, we have shown how combining experimental information concerning which compounds were active or inactive in large libraries with virtual screening through enrichment studies can provide valuable indications about the location of putative binding sites. Experimental high-throughput screening has been a valuable tool for drug discovery by identifying active compounds that inhibit an enzyme of interest, even when the binding target was not known. The collection of active inhibitors can be alligned for 3-D quantitative structure-activity relationships (QSAR) to identify new compounds which might have similar binding activities.65–68 Going further, knowing the location of the receptor pocket to which inhibitors bind can provide crucial information that can be used to guide structure-based design of new inhibitors. As was the current situation with RNase H, experimental information about where the actives bound to a target enzyme might not be known or might be ambiguous such as the case with certain NMR spectroscopy data or low resolution X-ray crystallography. Other sites beside the active site might be important. Programs like SiteMap7, 8 have attempted to identify binding sites based on geometry and physicochemical properties, but they also have identified multiple sites at a time that might or might not be the actual binding sites.1–9, 45, 69 Binding sites have possessed properties that differentiate between active inhibitors and inactive compounds. In this work we have combined experimental identification of actives and in silico high-throughput virtual screening into enrichment (ROC) curves to provide powerful clues to identifying true binding sites of the actives. For the AnalytiCon library of compounds, we have identified a pocket on the other side from the active site centered on residue Q507 on p66 with an eight-fold enrichment on par with our previous work that benchmarked enrichment calculations with known systems.18 We believe that inhibitors binding at site 507 may cause a conformational change at the interface between the RNase H domain and the p51 domain. This could conceivably change the orientation of the active site and affect its availability to act on the DNA:RNA substrate. For the hydrazone/hydrazine library, we have identified a new binding mode where inhibitors bind between RT and the DNA:RNA substrate at residue Q500 (site 500S) with the only positive signal in the ROC curve for any site on RNase H. With this information, it should be possible to develop structure-based design strategies that target these allosteric sites. These allosteric sites have an advantage as drug design targets in that these sites are specific to HIV-1 RT; hopefully compounds that target them will not interfere with human RNase H1.
Supplementary Material
Acknowledgments
This project has been supported in part by the National Institutes of Health grants AI073975, AI077424, and GM-30580. The calculations reported in this work have been performed at the BioMaPS High Performance Computing Center at Rutgers University funded in part by the NIH shared instrumentation grant no. 1 S10 RR022375.
Footnotes
The following supporting material has been provided with the manuscript:
- A PDB file containing the coordinates of the complex of fragment aaa bound at site 507 as shown in Figure 8 of the manuscript.
- An annotation of the residues which form the binding pocket for site 507 and site 500S
The information is available free of charge via the internet at http://pubs.acs.org.
References
- 1.Ruppert J, Welch W, Jain AN. Automatic identification and representation of protein binding sites for molecular docking. Protein Sci. 1997;6:524–533. doi: 10.1002/pro.5560060302. [DOI] [PMC free article] [PubMed] [Google Scholar]
- 2.Dennis S, Kortvelyesi T, Vajda S. Computational mapping identifies the binding sites of organic solvents on proteins. Proc Natl Acad Sci USA. 2002;99:4290–4295. doi: 10.1073/pnas.062398499. [DOI] [PMC free article] [PubMed] [Google Scholar]
- 3.Kortvelyesi T, Silberstein M, Dennis S, Vajda S. Improved mapping of protein binding sites. J Comput-Aided Mol Des. 17(17):173–186. doi: 10.1023/a:1025369923311. [DOI] [PubMed] [Google Scholar]
- 4.Nayal M, Honig B. On the nature of cavities on protein surfaces: application to the identification of drug-binding sites. Proteins: Struct Funct Bioinform. 2006;63:892–906. doi: 10.1002/prot.20897. [DOI] [PubMed] [Google Scholar]
- 5.Coleman RG, Salzberg AC, Cheng AC. Structure-based identification of small molecule binding sites using a free energy model. J Chem Inf Model. 2006;46:2631–2637. doi: 10.1021/ci600229z. [DOI] [PubMed] [Google Scholar]
- 6.Cheng AC, Coleman RG, Smyth KT, Cao Q, Soulard P, Caffrey DR, Salzberg AC, Huang ES. Structure-based maximal affinity model predicts small-molecule druggability. Nature Biotech. 2007;25:71–75. doi: 10.1038/nbt1273. [DOI] [PubMed] [Google Scholar]
- 7.Halgren T. New method for fast and accurate binding-site identification and analysis. Chem Biol Drug Des. 2007;69:146–148. doi: 10.1111/j.1747-0285.2007.00483.x. [DOI] [PubMed] [Google Scholar]
- 8.Halgren TA. Identifying and characterizing binding sites and assessing druggability. J Chem Inf Model. 2009;49:377–389. doi: 10.1021/ci800324m. [DOI] [PubMed] [Google Scholar]
- 9.Huang N, Jacobson MP. Binding-site assessment by virtual fragment screening. PLoS One. 2010;5:e10109. doi: 10.1371/journal.pone.0010109. [DOI] [PMC free article] [PubMed] [Google Scholar]
- 10.Klumpp K, Mirzadegan T. Recent progress in the design of small molecule inhibitors of HIV RNase H. Curr Pharmac Des. 2006;12:1909–1922. doi: 10.2174/138161206776873653. [DOI] [PubMed] [Google Scholar]
- 11.Jochmans D. Novel HIV-1 reverse transcriptase inhibitors. Virus Res. 2008;134:171–185. doi: 10.1016/j.virusres.2008.01.003. [DOI] [PubMed] [Google Scholar]
- 12.Yu F, Liu X, Zhan P, DeClercq E. Recent advances in the research of HIV-1 RNase H inhibitors. Mini-Rev Med Chem. 2008;8:1243–1251. doi: 10.2174/138955708786141052. [DOI] [PubMed] [Google Scholar]
- 13.Beilhartz GL, Götte M. HIV-1 ribonuclease H: structure, catalytic mechanism and inhibitors. Viruses. 2010;2:900–926. doi: 10.3390/v2040900. [DOI] [PMC free article] [PubMed] [Google Scholar]
- 14.Parniak MA, Min K, Budihas SR, Le Grice SFJ, Beutler JA. A fluorescence-based high-throughput screening assay for inhibitors of human immunodeficiency virus-1 reverse transcriptase-associated ribonuclease H activity. Anal Biochem. 2003;322:33–39. doi: 10.1016/j.ab.2003.06.001. [DOI] [PubMed] [Google Scholar]
- 15.Himmel DM, Sarafianos SG, Dharmasena S, Hossain MM, McCoy-Simandle K, Ilina T, Clark AD, Jr, Knight JL, Julias JG, Clark PK, Krogh-Jespersen K, Levy RM, Hughes SH, Parniak MA, Arnold E. HIV-1 reverse transcriptase structure with RNase H inhibitor dihydroxy benzoyl naphthyl hydrazone bound at novel site. ACS Chem Biol. 2006;1:702–712. doi: 10.1021/cb600303y. [DOI] [PMC free article] [PubMed] [Google Scholar]
- 16.Wendeler M, Lee HF, Bermingham A, Miller JT, Chertov O, Bona MK, Baichoo NS, Ehteshami M, Beutler J, O’Keefe BR, Götte M, Kvaratskhelia M, Le Grice S. Vinylogous ureas as a novel class of inhibitors of reverse transcriptase-associated ribonuclease H activity. ACS Chem Bio. 2008;3:635–644. doi: 10.1021/cb8001039. [DOI] [PMC free article] [PubMed] [Google Scholar]
- 17.Gong Q, Menon L, Ilina T, Miller LG, Ahn J, Parniak MA, Ishima R. Interaction of HIV-1 reverse transcriptase ribonuclease H with an acylhydrazone inhibitor. Chem Biol Drug Des. 2011;77:39–47. doi: 10.1111/j.1747-0285.2010.01052.x. [DOI] [PMC free article] [PubMed] [Google Scholar]
- 18.Zhou Z, Felts AK, Friesner RA, Levy RM. Comparative performance of several flexible docking programs and scoring functions: enrichment studies for a diverse set of pharmaceutically relevant targets. J Chem Inf Model. 2007;47:1599–1608. doi: 10.1021/ci7000346. [DOI] [PMC free article] [PubMed] [Google Scholar]
- 19.Mehellou Y, De Clercq E. Twenty-six years of anti-HIV drug discovery: where do we stand and where do we go? J Med Chem. 2010;53:521–538. doi: 10.1021/jm900492g. [DOI] [PubMed] [Google Scholar]
- 20.di Marzo Veronese F, Copeland TD, DeVico AL, Rahman R, Oroszlan S, Gallo RC, Sarngadharan MG. Characterization of highly immunogenic p66/p51 as reverse transcriptase of HTLV-III/LAV. Science. 1986;231:1289–1291. doi: 10.1126/science.2418504. [DOI] [PubMed] [Google Scholar]
- 21.Sarafianos SG, Marchand B, Das K, Himmel DM, Parniak MA, Hughes SH, Arnold E. Structure and function of HIV-1 reverse transcriptase: molecular mechanisms of polymerization and inhibition. J Mol Biol. 2009;385:693–713. doi: 10.1016/j.jmb.2008.10.071. [DOI] [PMC free article] [PubMed] [Google Scholar]
- 22.Tan CK, Civil R, Mian AM, So AG, Downey KM. Inhibition of the RNase H activity of HIV reverse transcriptase by azidothymidylate. Biochemistry. 1991;30:4831–4835. doi: 10.1021/bi00234a001. [DOI] [PubMed] [Google Scholar]
- 23.Zhan X, Tan C-K, Scott WA, Mian AM, Downey KM, So AG. Catalytically distinct conformations of the ribonuclease H of HIV-1 reverse transcriptase by substrate cleavage patterns and inhibition by azidothymidylate and N -ethylmaleimide. Biochemistry. 1994;33:1366–1372. doi: 10.1021/bi00172a012. [DOI] [PubMed] [Google Scholar]
- 24.Allen SJW, Krawczyk SH, McGee LR, Bischofberger N, Lulato AS, Cherrington JM. Inhibition of HIV-1 RNase H activity by nucleotide dimers and monomers. Antivir Chem Chemother. 1996;7:37–45. [Google Scholar]
- 25.Shaw-Reid CA, Munshi V, Graham P, Wolfe A, Witmer M, Danzeisen R, Olsen DB, Carroll SS, Embrey M, Wai JS, Miller MD, Cole JL, Hazuda DJ. Inhibition of HIV-1 ribonuclease H by a novel diketo acid, 4-[5-(bezoylamino)thien-2-yl]-2,4-dioxobutanoic acid. J Biol Chem. 2003;278:2777–2780. doi: 10.1074/jbc.C200621200. [DOI] [PubMed] [Google Scholar]
- 26.Shaw-Reid CA, Feuston B, Munshi V, Getty K, Krueger J, Hazuda DJ, Parniak MA, Miller MD, Lewis D. Dissecting the effects of DNA polymerase and ribonuclease H inhibitor combinations on HIV-1 reverse-transcriptase activities. Biochemistry. 2005;44:1595–1606. doi: 10.1021/bi0486740. [DOI] [PubMed] [Google Scholar]
- 27.Tramontano E, Esposito F, Badas R, Di Santo R, Costi R, La Colla PL. 6-[1-(4-Fluorophenyl)methyl-1H -pyrrol-2-yl)]-2,4-dioxo-5-hexenoic acid ethyl ester a novel diketo acid derivative which selectively inhibits the HIV-1 viral replication in cell culture and the ribonuclease H activity in vitro. Antiviral Res. 2005;65:117–124. doi: 10.1016/j.antiviral.2004.11.002. [DOI] [PubMed] [Google Scholar]
- 28.Hang JQ, Rajendran S, Yang Y, Li Y, In PWK, Overton H, Parkes KEB, Cammack N, Martin JA, Klumpp K. Activity of the isolated HIV RNase H domain and specific inhibition of N -hydroxyimides. Biochem Biphys Res Comm. 2004;317:321–329. doi: 10.1016/j.bbrc.2004.03.061. [DOI] [PubMed] [Google Scholar]
- 29.Budihas SR, Gorshkova I, Gaidamakov S, Wamiru A, Bona MK, Parniak MA, Crouch RJ, McMahon JB, Beutler JA, Le Grice SFJ. Selective inhibition of HIV-1 reverse transcriptase-associated ribonuclease H activity by hydroxylated tropolones. Nuc Acids Res. 2005;33:1249–1256. doi: 10.1093/nar/gki268. [DOI] [PMC free article] [PubMed] [Google Scholar]
- 30.Didierjean J, Isel C, Querré F, Mouscadet JF, Aubertin AM, Valnot JY, Piettre SR, Marquet R. Inhibition of human immunodificiency virus type 1 reverse transcriptase, RNase H, and integrase activities by hydroxytropolones. Antimicrob Agents Chemother. 2005;49:4884–4894. doi: 10.1128/AAC.49.12.4884-4894.2005. [DOI] [PMC free article] [PubMed] [Google Scholar]
- 31.Beilhartz GL, Wendeler M, Baichoo N, Rausch J, Le Grice S, Götte M. HIV-1 reverse transcriptase can simultaneously engage its DNA/RNA substrate at both DNA polymerase and RNase H active sites: implications for RNase H inhibition. J Mol Biol. 2009;388:462–474. doi: 10.1016/j.jmb.2009.03.025. [DOI] [PMC free article] [PubMed] [Google Scholar]
- 32.Himmel DM, Maegley KA, Pauly TA, Bauman JD, Das K, Dharia C, Clark AD, Jr, Ryan K, Hickey MJ, Love RA, Hughes SH, Bergqvist S, Arnold E. Structure of HIV-1 reverse transcriptase with the inhibitor β-thujaplicinol bound at the RNase H active site. Structure. 2009;17:1625–1635. doi: 10.1016/j.str.2009.09.016. [DOI] [PMC free article] [PubMed] [Google Scholar]
- 33.Billamboz M, Bailly F, Barreca ML, De Luca L, Mouscadet JF, Calmels C, Andréola ML, Witvrouw M, Christ F, Debyser Z, Cotelle P. Design, synthesis, and biological evaluation of a series of 2-hydroxyisoquinoline-1,3(2H, 4H)-diones as dual inhibitors of human immunodeficiency virus type 1 integrase and the reverse transcriptase RNase H domain. J Med Chem. 2008;51:7717–7730. doi: 10.1021/jm8007085. [DOI] [PubMed] [Google Scholar]
- 34.Kirschberg TA, Balakrishnan M, Squires NH, Barnes T, Brendza KM, Chen X, Eisenberg EJ, Jin W, Kutty N, Leavitt S, Liclican A, Liu Q, Liu X, Mak J, Perry JK, Wang M, Watkins WJ, Lansdon EB. RNase H active site inhibitors of human immunodeficiency virus type 1 reverse transcriptase: design, biochemical activity, and structural information. J Med Chem. 2009;52:5781–5784. doi: 10.1021/jm900597q. [DOI] [PubMed] [Google Scholar]
- 35.Su HP, Yan Y, Prasad GS, Smith RF, Daniels CL, Abeywickrema PD, Reid JC, Loughran HM, Kornienko M, Sharma S, Grobler JA, Xu B, Sardana V, Allison TJ, Williams PD, Darke PL, Hazuda DJ, Munshi S. Structural basis for the inhibition of RNase H activity of HIV-1 reverse transcriptase by RNase H active site-directed inhibitors. J Virology. 2010;84:7625–7633. doi: 10.1128/JVI.00353-10. [DOI] [PMC free article] [PubMed] [Google Scholar]
- 36.Loya S, Hizi A. The inhibition of human immunodeficiency virus type 1 reverse transcriptase by avarol and avarone derivatives. FEBS Lett. 1990;269:131–134. doi: 10.1016/0014-5793(90)81137-d. [DOI] [PubMed] [Google Scholar]
- 37.Loya S, Tal R, Kashman Y, Hizi A. Illimaquinone, a selective inhibitor of the RNase H activity of human immunodeficiency virus type 1 reverse transcriptase. Antimicrob Agents Chemother. 1990;34:2009–2012. doi: 10.1128/aac.34.10.2009. [DOI] [PMC free article] [PubMed] [Google Scholar]
- 38.Loya S, Hizi A. The interaction of illimaquinone, a selective inhibitor of the RNase H activity, with the reverse transcriptase of human immunodeficiency and murine leukemia retroviruses. J Biol Chem. 1993;268:9323–9328. [PubMed] [Google Scholar]
- 39.Min BS, Miyashiro H, Hattori M. Inhibitory effects of quinones on RNase H activity associated with HIV-1 reverse transcriptase. Phytother Res. 2002;16:S57–S62. doi: 10.1002/ptr.808. [DOI] [PubMed] [Google Scholar]
- 40.Borkow G, Fletcher RS, Barnard J, Arion D, Motakis D, Dmitrienko GI, Parniak MA. Inhibition of the ribonuclease H and DNA polymerase activities of HIV-1 reverse transcriptase by N -(4-tert-butylbenzoyl)-2-hydroxy-1-naphthaldehyde. Biochemistry. 1997;36:3179–3185. doi: 10.1021/bi9624696. [DOI] [PubMed] [Google Scholar]
- 41.Arion D, Sluis-Cremer N, Min KL, Abram ME, Fletcher RS, Parniak MA. Mutational analysis of Tyr-501 of HIV-1 reverse transcriptase. J Biol Chem. 2002;277:1370–1374. doi: 10.1074/jbc.M110254200. [DOI] [PubMed] [Google Scholar]
- 42.Sluis-Cremer N, Arion D, Parniak MA. Destabilization of the HIV-1 reverse transcriptase dimer upon interaction with N -acyl hydrazone inhibitors. Molec Pharmacol. 2002;62:398–405. doi: 10.1124/mol.62.2.398. [DOI] [PubMed] [Google Scholar]
- 43.Di Grandi M, Olson M, Prashad AS, Bebernitz G, Luckay A, Mullen S, Hu Y, Krishnamurthy G, Pitts K, O’Connell J. Small molecule inhibitors of HIV RT ribonuclease H. Biorg Med Chem Lett. 2010;20:398–402. doi: 10.1016/j.bmcl.2009.10.043. [DOI] [PubMed] [Google Scholar]
- 44.Nowotny M, Gaidamakov SA, Ghirland R, Cerritelli SM, Crouch RJ, Yang W. Structure of human RNase H1 complexed with an RNA/DNA hybrid: insight into HIV reverse transcription. Mol Cell. 2007;28:264–276. doi: 10.1016/j.molcel.2007.08.015. [DOI] [PubMed] [Google Scholar]
- 45.Henrich S, Salo-Ahen OMH, Huang B, Rippman FF, Cruciani G, Wade RC. Computationl approaches to identifying and characterizing protein binding sites for ligand design. J Molec Recogn. 2010;23:209–219. doi: 10.1002/jmr.984. [DOI] [PubMed] [Google Scholar]
- 46.Zweig MH, Campbell G. Receiver-operating characteristic (ROC) plots: a fundamental evaluation tool in clinical medicine. Clin Chem. 1993;39:561–577. [PubMed] [Google Scholar]
- 47.Triballeau N, Acher F, Brabet I, Pin JP, Bertrand HO. Virtual screening workflow development guided by the “receiver operating characteristic” curve approach. Application to high-throughput docking on metabotropic glutamate receptor subtype 4. J Med Chem. 2005;48:2534–2547. doi: 10.1021/jm049092j. [DOI] [PubMed] [Google Scholar]
- 48.Perola E, Walters WP, Charifson PS. A detailed comparison of current docking and scoring methods on systems of pharmaceutical relevance. Proteins: Struct Funct Bioinform. 2004;56:235–249. doi: 10.1002/prot.20088. [DOI] [PubMed] [Google Scholar]
- 49.Kontoyianni M, Sokol GS, McClellan LM. Evaluation of library ranking efficacy in virtual screening. J Comput Chem. 2005;26:11–22. doi: 10.1002/jcc.20141. [DOI] [PubMed] [Google Scholar]
- 50.Cummings MD, DesJarlais RL, Gibbs AC, Mohan V, Jaeger EP. Comparison of automated docking programs as virtual screening tools. J Med Chem. 2005;48:962–976. doi: 10.1021/jm049798d. [DOI] [PubMed] [Google Scholar]
- 51.Warren GL, Andrews CW, Capelli AM, Clarke BJL, Lambert MH, Lindvall M, Nevins N, Semus SF, Senger S, Tedesco G, Wall ID, Wool-ven JM, Peishoff CE, Head MS. A critical assessment of docking programs and scoring functions. J Med Chem. 2006;49:5912–5931. doi: 10.1021/jm050362n. [DOI] [PubMed] [Google Scholar]
- 52.Cross JB, Thompson DC, Rai BK, Baber JC, Fan KY, Hu Y, Humblet C. Comparison of several molecular docking programs: pose prediction and virtual screening accuracy. J Chem Inf Model. 2009;49:1455–1474. doi: 10.1021/ci900056c. [DOI] [PubMed] [Google Scholar]
- 53.Irwin JJ, Shoichet BK, Mysinger MM, Huang N, Colizzi F, Wassam P, Cao Y. Automated docking screens: a feasibility study. J Med Chem. 2009;52:5712–5720. doi: 10.1021/jm9006966. [DOI] [PMC free article] [PubMed] [Google Scholar]
- 54.Leach AR, Shoichet BK, Peishoff CE. Docking and scoring. J Med Chem. 2006;49:5851–5855. doi: 10.1021/jm060999m. [DOI] [PubMed] [Google Scholar]
- 55.Friesner RA, Murphy RB, Repasky MP, Frye LL, Greenwood JR, Halgren TA, Sanschagrin PC, Mainz DT. Extra precision Glide: docking and scoring incorporating a model of hydrophobic enclosure fro protein–ligand complexes. J Med Chem. 2006;49:6177–6196. doi: 10.1021/jm051256o. [DOI] [PubMed] [Google Scholar]
- 56.Jorgensen WL, Maxwell DS, Tirado-Rives J. Development and testing of the OPLS all-atom force field on conformational energetics and properties of organic liquids. J Am Chem Soc. 1996;118:11225–11236. [Google Scholar]
- 57.Kaminski GA, Friesner RA, Tirado-Rives J, Jorgensen WL. Evaluation and reparameterization of the OPLS-AA force field for proteins via comparison with accurate quantum chemical calculations on peptides. J Phys Chem B. 2001;105:6474–6487. [Google Scholar]
- 58.Eldridge MD, Murray CW, Auton TR, Paolini GV, Mee RP. Empirical scoring functions. 1. The development of a fast empirical scoring function to estimate the binding affinity of ligands in receptor complexes. J Comput-Aided Mol Des. 1997;11:425–445. doi: 10.1023/a:1007996124545. [DOI] [PubMed] [Google Scholar]
- 59.Feng BY, Simeonov A, Jadhav A, Babaoglu K, Inglese J, Shoichet BK, Austin CP. A high-throughput screen for aggregation-based inhibition in a large compound library. J Med Chem. 2007;50:2385–2390. doi: 10.1021/jm061317y. [DOI] [PubMed] [Google Scholar]
- 60.Nicholls A. What do we know and when do we know it? J Comput-Aided Mol Des. 2008;22:239–255. doi: 10.1007/s10822-008-9170-2. [DOI] [PMC free article] [PubMed] [Google Scholar]
- 61.Berman HM, Westbrook J, Feng Z, Gilliland G, Bhat TN, Weissig H, Shindyalov IN, Bourne PE. The Protein Data Bank. Nucleic Acids Res. 2000;28:235–242. doi: 10.1093/nar/28.1.235. [DOI] [PMC free article] [PubMed] [Google Scholar]
- 62.Sarafianos SG, Das K, Tantillo CDCA, Ding J, Whitcomb JM, Boyer PL, Hughes SH, Arnold E. Crystal structure of HIV-1 reverse transcriptase in complex with a polypurine tract RNA:DNA. EMBO J. 2001;20:1449–1461. doi: 10.1093/emboj/20.6.1449. [DOI] [PMC free article] [PubMed] [Google Scholar]
- 63.Banks JL, Beard HS, Cao Y, Cho AE, Damm W, Farid R, Felts AK, Halgren TA, Mainz DT, Maple JR, Murphy R, Philipp DM, Repasky MP, Zhang LY, Berne BJ, Friesner RA, Gallicchio E, Levy RM. Integrated modeling program, applied chemical theory (IMPACT) J Comput Chem. 2005;26:1752–1780. doi: 10.1002/jcc.20292. [DOI] [PMC free article] [PubMed] [Google Scholar]
- 64.Fukunishi Y, Nakamura H. Prediction of ligand-binding sites of proteins by molecular docking calculation for a random ligand library. Protein Sci. 2011;20:95–106. doi: 10.1002/pro.540. [DOI] [PMC free article] [PubMed] [Google Scholar]
- 65.Dixon SK, Smondyrev AM, Knoll EH, Rao SN, Shaw DE, Friesner RA. PHASE: a new engine for pharmacophore perception, 3D QSAR model development, and 3D database screening: 1. methodology and preliminary results. J Comput-Aided Mol Des. 2006;20:647–671. doi: 10.1007/s10822-006-9087-6. [DOI] [PubMed] [Google Scholar]
- 66.Johnson SR. The trouble with QSAR (or how I learned to stop worrying and embrace fallacy) J Chem Inf Model. 2008;48:25–26. doi: 10.1021/ci700332k. [DOI] [PubMed] [Google Scholar]
- 67.Manchester J, Czermiński R. Caution: popular “benchmark” data sets do not distinguish the merits of 3D QSAR methods. J Chem Inf Model. 2009;49:1449–1454. doi: 10.1021/ci9000508. [DOI] [PubMed] [Google Scholar]
- 68.Leach AR, Gillet VJ, Lewis RA, Taylor R. Three-dimensional pharmacophore methods in drug discovery. J Med Chem. 2010;53:539–558. doi: 10.1021/jm900817u. [DOI] [PubMed] [Google Scholar]
- 69.Seco J, Luque J, Barril X. Binding site detection and druggability index from first principles. J Med Chem. 2009;52:2363–2371. doi: 10.1021/jm801385d. [DOI] [PubMed] [Google Scholar]
- 70.Humphrey W, Dalke A, Schulten K. VMD-Visual Molecular Dynamics. J Molec Graphics. 1996;14:33–38. doi: 10.1016/0263-7855(96)00018-5. [DOI] [PubMed] [Google Scholar]
- 71.R: A Language and Environment for Statistical Computing, version 2.11.1. R Foundation for Statistical Computing; Vienna, Austria: 2010. [Google Scholar]
Associated Data
This section collects any data citations, data availability statements, or supplementary materials included in this article.