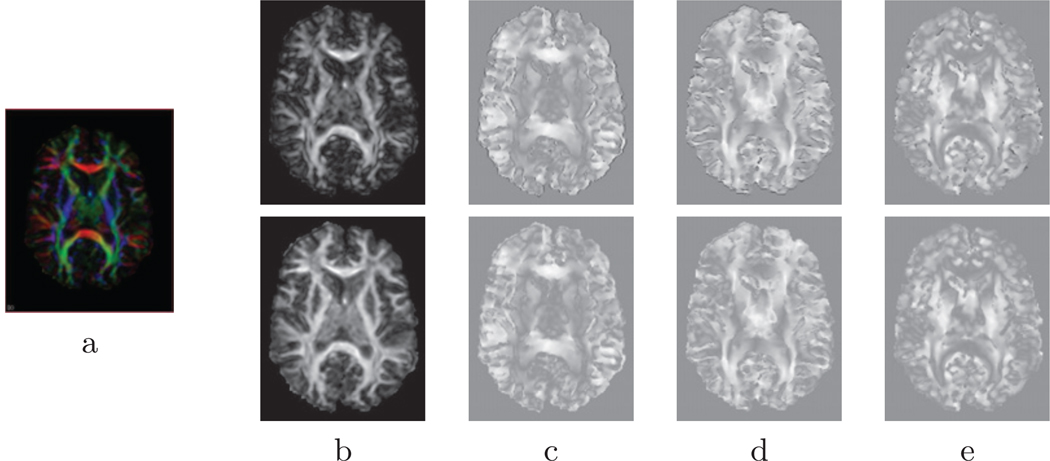
Figure 2.
Example data set depicting diffusion type and connectivity functions for single (top) and overlapping tracts (bottom): a) original image color map, b) dT, dO, c) sT, sO in the X direction, d) sT, sO in the Y direction, e) sT, sO in the Z direction. The diffusion functions are defined in [0, 1], whereas the connectivity functions are defined in [−1, 1]. Although the functions for single and overlapping tracts appear very similar, there are some subtle differences: dT is darker in regions of crossing (e.g. the junction between ATR, IFO and CCF), and the single tract connectivity maps sT appear sharper because they include more negative values (it is more likely to find similar directions when using first and second eigenvectors, as in sO).

