Abstract
Previously, we devised a novel strategy for in vivo 13C MRS using [2-13C]glucose infusion and low-power proton decoupling, and proposed that this strategy could be used to acquire 13C MR spectra from the frontal lobe of the human brain. Here, we demonstrate, for the first time, in vivo 13C MRS of human frontal lobe acquired at 3 T. Because the primary metabolites of [2-13C]glucose can be decoupled using very-low-radiofrequency power, we used a volume coil for proton decoupling in this study. The homogeneous B1 field of the volume coil was found to significantly enhance the decoupling efficiency of the stochastic decoupling sequence. Detailed specific absorption rates inside the human head were analyzed using the finite difference time domain method to ensure experimental safety. In vivo 13C spectra from the occipital and frontal lobes of the human brain were obtained. At a decoupling power of 30 W (time-averaged power, 2.45 W), the spectra from the occipital lobe showed well-resolved spectral resolution and excellent signal-to-noise ratio. Although frontal lobe 13C spectra were affected by local B0 field inhomogeneity, we demonstrated that the spectral quality could be improved using post-acquisition data processing. In particular, we showed that the frontal lobe glutamine C5 at 178.5 ppm and aspartate C4 at 178.3 ppm could be spectrally resolved with effective proton decoupling and B0 field correction. Because of its large spatial coverage, volume coil decoupling provides the potential to acquire 13C MRS from more than one brain region simultaneously.
Keywords: MRS, carbon-13, human brain, stochastic decoupling
INTRODUCTION
One very powerful method for studying human brain metabolism is proton-decoupled 13C spectroscopy (1–8). In human brain 13C spectroscopy studies, carbon-13 (13C)-enriched substances are infused into human subjects and proton-decoupled 13C spectra are acquired using either direct 13C excitation (1,2) or proton–carbon polarization transfer techniques (3,4). Enriched substances, such as [1-13C]glucose (1–5), [2-13C]acetate (6) and [2-13C]glucose (7,8), have been used for intravenous or oral infusion protocols. The most commonly used substance is [1-13C]glucose. Alkanyl carbons of major brain metabolites are often detected in the 20–60 ppm range. However, one of the technical difficulties associated with alkanyl carbons is the large 1H–13C scalar coupling (1JCH = 125–145 Hz). To obtain effective decoupling, the radiofrequency (RF) field strength of the decoupling pulses (γB2) must be much greater than 1JCH. Because chemical shift dispersion is proportional to the static magnetic field strength, and because the γB2 required for broad-band decoupling increases linearly with γB0, the RF power for broad-band decoupling increases as a function of (γB0)2. To ensure patient safety during RF exposure, the US Food and Drug Administration and the International Electrotechnical Commission defined safety guidelines measured with average and local specific absorption ratios (SARs) (9,10). To achieve necessary RF efficiency with acceptable RF power deposition, surface coil or half-volume transceiver coils (11) have been used for proton decoupling. As a result, most in vivo 13C spectroscopy studies of human brain have been acquired from the occipital lobe region, whereas proton decoupling for studying the frontal lobe may cause safety concerns because of poor perfusion of the eyes.
Although proton surface coils provide higher efficiency and sensitivity, their inhomogeneous B1 field is a well-known technical issue. Under the inhomogeneous B1 field, the spins within the region of interest do not experience the same decoupling RF field that degrades decoupling efficiency. Composite decoupling sequences, such as WALTZ-4 or WALTZ-16, are generally designed for high-resolution NMR spectroscopy with larger γB2 (≥1 kHz) and fast repetition of decoupling pulse cycles, and may therefore not perform well with very weak coupling fields. Furthermore, the region of interest needs to be close to the surface of half-volume coils, which does not allow the performance of multiregion spectroscopy experiments (e.g. acquiring two spectra in one study, one from the occipital lobe and another from the frontal lobe).
Volume coil decoupling has been used previously for human brain 13C spectroscopy studies at 1.5 T (12) and 3 T (13,14). In the 1.5 T study, an unshielded birdcage coil was used and the decoupling power was approximately 150 W. For RF power to remain within safety guidelines, the acquisition time was only 85 ms, which significantly limited the spectral resolution. A shielded birdcage coil was used in the 3 T studies, and a decoupling power of 70 W was applied with a relatively short acquisition time of 135 ms. Because proton decoupling was applied for alkanyl carbons, further reductions in decoupling power were limited.
We developed a novel strategy for in vivo cerebral 13C MRS using [2-13C]glucose infusion and detection of its primary metabolites in the carboxyl/amide region (15,16). We found that proton decoupling for the carboxyl/amide region requires very low RF power. The 13C resonances of glutamate, glutamine, γ-aminobutyric acid (GABA), aspartate and N-acetylaspartate (NAA) from the carboxylic/amide spectral region were detected. Because the carboxylic/amide carbons are only coupled to protons via very weak, long-range, 1H–13C scalar couplings, these couplings can be effectively decoupled using very low RF power with half-volume coils (15,16). An additional advantage of this approach is that the resonances of major brain metabolites do not overlap with the 13C signal from the carboxylic carbons of the subcutaneous lipids (centered at 172 ppm).
In this study, we conducted 13C spectroscopy in human brain using volume coil decoupling at 3 T. Before the in vivo study, numerical simulations under our experimental conditions were first applied to evaluate the average and local SARs inside the human head with volume coil decoupling. The reliability of the simulation method was also validated with phantom experimental measurements. Following the numerical simulation, the efficiency of volume coil decoupling was evaluated on a phantom that provided the spectrum features of carboxylic/amide carbons from glutamine and aspartate. Finally, 13C spectroscopy in the occipital and frontal lobes was performed with volume coil decoupling. As a result of the weak coupling for carboxylic/amide carbons and the uniform B1 field of the volume coil, a decoupling power of 30 W was found to be adequate. This decoupling power was much less than the power predicted from the result using surface coil decoupling. Preliminary results from this study were presented at the 16th and 17th Annual Meetings of the International Society of Magnetic Resonance in Medicine (17–19).
EXPERIMENTAL DETAILS
Hardware
In vivo 13C MRS experiments were performed on a GE 3 T Excite clinical scanner (GE Healthcare, Milwaukee, WI, USA). A homebuilt RF coil system was used that consisted of a single-turn 13C coil and a short, unshielded quadrature, and high-pass birdcage coil. The 12-leg birdcage coil was constructed using copper tape on the outside surface of a clear acrylic tube with an outside diameter of 26.7 cm. The width of the legs and end-rings was 2.54 cm and the inner length was 12.7 cm. The 13C coil for the occipital lobe was the same as that used in the previous human study (16). The frontal lobe 13C coil was a rectangular loop made with copper tape, 1.00 cm wide, mounted on a piece of plastic tube material (outside diameter, 20.3 cm). The inner width and length of the coil were 5 and 9 cm, respectively. A proton blocking tank circuit was inserted at the midpoint of the 13C loop. A stand-alone proton decoupler was used to provide stochastic RF pulses for nuclear Overhauser effect (NOE) and proton decoupling. Details regarding system configuration, stochastic pulses and RF power calibration have been described previously (16).
Numerical analysis of SAR
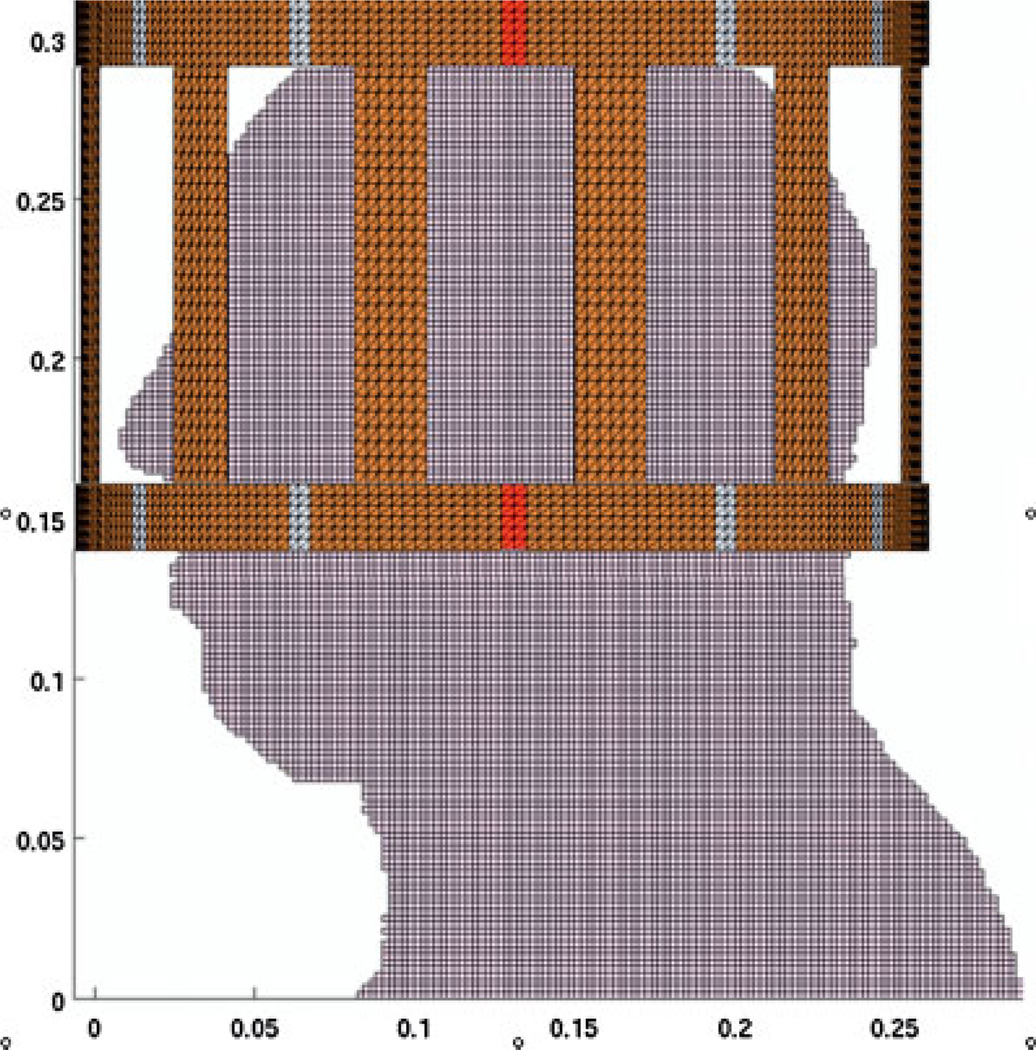
Average and local SARs inside the human head were simulated under our experimental conditions using a custom-designed finite difference in time domain/finite element method (FDTD/FEM) program developed in-house (20,21). In FEM, the birdcage coil was modeled according to the actual dimensions with unstructured tetrahedral meshes. The rest of the space and the human head (based on the National Library of Medicine’s Visual Man Project) were modeled using the FDTD method with a 2 × 2 × 2 mm3 spatial resolution. Eighteen different bones and tissues and their electrical properties at 128 MHz were assigned (22). A sagittal view of the computer model is shown in Fig. 1, where the proton coil is centered for the occipital lobe. For the frontal lobe study, the proton coil was shifted about 2 cm superiorly for better coverage. Two voltage sources were applied and the coil was driven in quadrature. The circularly polarized component of the B1 field and electric fields were calculated at 128 MHz. Local SAR was computed by averaging the absorbed electric power within a volume of 1 g mass around the center of each cell. The results of and local SAR distributions were normalized to 1 W of absorbed RF power inside the head model with 100% duty cycle. Using the normalized results, the intensity and local SAR at different power levels and duty cycles were computed. In the calculation of average SAR, a concept of effective mass (16) was used that contained the top 90% of total electric energy absorbed inside the head model. For the head model used, the effective masses were 3.5 and 3.0 kg when the proton coil was centered for the occipital and frontal lobes, respectively. Average SAR was calculated by taking 90% of the total energy absorbed inside the human model for each case and dividing it by the corresponding effective mass.
Figure 1.
A sagittal view of the computer model of the human head and the short birdcage coil for the finite difference in time domain/finite element method (FDTD/FEM) simulations. The coil was modeled with unstructured tetrahedral meshes in FEM. The rest of the space and the human head were modeled using the FDTD method. The coil in this figure was positioned for the occipital lobe study. It was 2 cm higher in the frontal lobe simulation.
Experimental validation of numerical simulation
Although RF power deposition inside a three-dimensional human head model has been simulated previously (23–26), most of the simulations have not been validated experimentally. A recent phantom study has shown the agreement between the measured SAR using MRI phase maps and the calculated SAR using commercial software (XFDTD, Remcom, State College, PA, USA) (27). To validate the simulation software developed in-house, we performed a comparison study of numerical calculations and experimental measurements of the RF power deposition inside three salty phantoms on a 4.7 T scanner.
A shielded, 12-rung, linear, high-pass birdcage coil was used (coil length, 16 cm; coil diameter, 14.0 cm; shield diameter, 17.8 cm). The coil was tuned to 200.6 MHz. The unloaded phantom was a small sphere (diameter, 3.5 cm) filled with distilled water only. Three salty phantoms were prepared using spheres (diameter, 10.1 cm) filled with 25, 50 and 75 mm NaCl solution, respectively. The time-averaged RF power deposition inside each phantom was measured using the method defined by the National Electrical Manufacturers Association (28) or the International Electrotechnical Commission (10). All power levels were measured at 180° flip angle with a rectangular pulse of 2 ms at the coil center.
The same FDTD/FEM was applied to build the coil and phantom models. The coil was tuned to 200.6 MHz by adjusting end-ring capacitances for each loading phantom. The conductivities of the three salty numerical phantoms at 200 MHz were 0.29, 0.59 and 0.84 S/m, respectively (29). The calculated intensity at the center of the phantoms was normalized to 5.87 µT (180° flip angle with a rectangular pulse of 2 ms). The averaged RF power in each phantom was computed by integrating the electrical power from all cells inside the phantom space under normalized conditions.
Phantom and in vivo 13C spectroscopy
The efficiency of volume coil decoupling was tested on a phantom. Because the resonances of glutamine C5 and C1 are 0.2 ppm apart from the aspartate C4 and C1 peaks, respectively, they are most susceptible to imperfect decoupling. To mimic this chemical environment, we prepared a phantom using a 3 L bottle filled with distilled water and 6 g NaCl. A 7 cm sphere filled with 200 mm glutamine and 200 mm aspartate salt (pH 7.0) inside the 3 L bottle. Natural abundance 13C phantom spectra (nominal flip angle, 45°; TR = 4 s; number of data, 2048; NS = 64) were acquired at different decoupling power levels.
The methods of recruitment of human subjects, glucose infusion, acquisition of proton images for head position and acquisition of 13C MR spectra were identical to our previous study (16). A bilevel stochastic waveform was used for NOE and proton decoupling. The repetition unit of the stochastic noise was 1.2 ms. The RF power absorbed by the human head was 1.0 W for NOE and 30 W for proton decoupling, which corresponds to an average power deposition of 2.45 W (30 × 0.05 + 1 × 0.95). The proton carrier frequency for decoupling was centered at the water signal. All in vivo spectra were processed with zero fill of 16 K, Lorentzian broadening (LB) of −2.0 Hz and Gaussian broadening (GB) of 0.3.
Static magnetic field shimming was performed using the fast automatic shimming technique by mapping along projections (FASTMAP) method (30) implemented on the GE 3.0 T scanner which has high-order shims of the second-order spherical harmonics. A cubical voxel of 5 × 5 × 5 cm3 was selected to perform high-order shim in the occipital lobe. After the FASTMAP shim, the typical water linewidth from the 125 cm3 cubical voxel was 7–8 Hz in the occipital lobe. In the frontal lobe experiments, high-order shimming was performed on a smaller cubical voxel of 64 or 91 cm3, which produced a water linewidth of ~10 or ~12 Hz, respectively. Cube size selection was dependent on the size of the frontal lobe. The substantial line broadening in the frontal lobe was caused by the susceptibility effect from the nasal cavity, frontal and sphenoid sinus (31,32). Because the scanner was equipped with second-order shim coils only, shim conditions in the frontal lobe were limited.
RESULTS
SAR simulation analysis
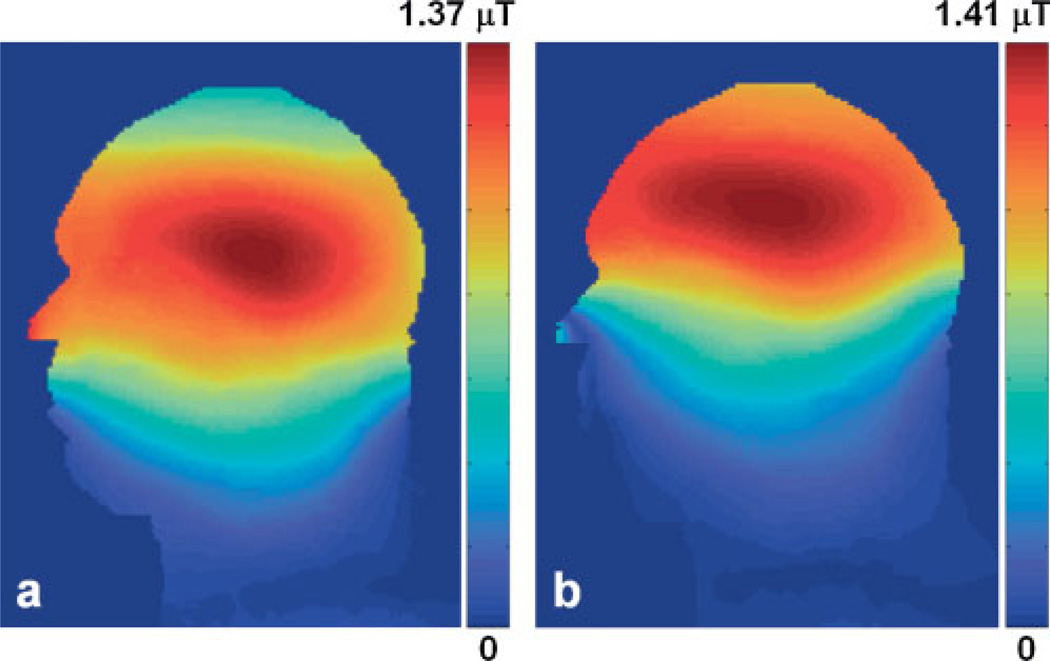
Figure 2 shows the sagittal view of the normalized field distribution in the unit of µT for both the occipital (Fig. 2a) and frontal (Fig. 2b) lobes. Compared with the field of the half-volume coil (16), the short-volume coil provided a uniform field in the transverse plane, and the space covered by the volume coil size was sufficiently large to cover the frontal and occipital lobe regions. The short coil length reduced additional coil loading from the tissue outside of the region of interest. As a result, the decoupling efficiency and spectral signal-to-noise ratio (SNR) were considerably improved.
Figure 2.
The normalized field distribution in the mid-sagittal plane of the head model with the short birdcage coil positioned for the occipital lobe study (a) and the frontal lobe study (b). Because the coil was centered differently in the two situations, the pattern was shifted accordingly.
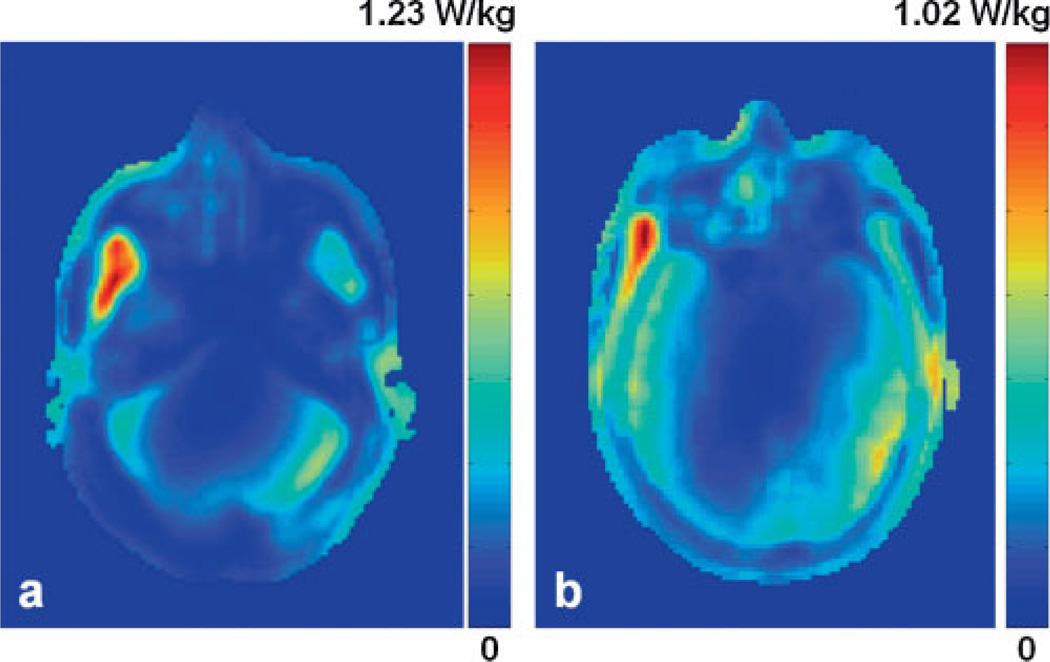
Figure 3a shows the normalized local SAR distribution in an axial slice for the occipital lobe simulation. This plot contains the maximum local SAR of 1.23 W/kg under normalized conditions (i.e. 1 W of deposited power). A logarithm scale in dB was used. In the frontal lobe, the maximum local SAR was 1.02 W/kg for 1 W of deposited power (Fig. 3b). In the occipital lobe simulation, the maximum local SAR was found within the temporal muscle, which has higher conductivity than the rest of the tissues; in the frontal lobe simulation, the maximum local SAR was observed in the skin and facial muscles near the nose and inferior to the eye, which was primarily caused by the repositioning of the proton coil, where the lower end-ring of the coil was shifted closer to the nose and eye.
Figure 3.
Normalized local specific absorption ratio (SAR) distribution in the plane that contains the maximum local SAR of 1.23 W/kg in the occipital lobe study (a) and 1.02 W/kg in the frontal lobe study (b). The plot is given in dB scale.
In our in vivo experiments, the maximum RF power delivered to the human head was 30 W for decoupling and 1.0 W for NOE. With the 5% duty cycle for proton decoupling, the maximum local SAR was 3.0 W/kg [1.23 × (30 × 0.05 + 1.0 × 0.95)] in the occipital lobe experiment, and 2.5 W/kg [1.02 × (30 × 0.05 + 1.0 × 0.95)] in the frontal lobe experiment. In estimating the average SAR, 90% of the deposited power and an effective mass were used. The average SAR was 0.63 W/kg {[0.90 × (30 × 0.05 + 1.0 × 0.95)]/3.5} for the occipital lobe experiment, and 0.74 W/kg {[0.90 × (30 × 0.05 + 1.0 × 0.95)]/3.0} for the frontal lobe experiment. These local and average SAR values are substantially below the safety guidelines established by the US Food and Drug Administration (8 W/kg for local SAR, 3 W/kg for average SAR) and International Electrotechnical Commission (10 W/kg for local SAR and 3.2 W/kg for average SAR).
Experimental validation of numerical simulations
The calculated and experimentally measured average power levels deposited inside the three different salt phantoms are shown in Table 1. The power levels given in Table 1 are those required to produce a 180° flip angle with a rectangular pulse of 2 ms. The simulated results are in good agreement with the experimentally measured data. Indeed, the sample with the highest NaCl concentration (0.84 S/m) is closest to the conductivity of brain tissue in the 100–200 MHz range (33,34). Therefore, we believe that our numerical simulation is a valid method for evaluating SAR inside the human head.
Table 1.
Material properties of the phantoms and the calculated and measured radiofrequency (RF) power deposition in the phantoms.
| Salt phantom number | 1 | 2 | 3 |
|---|---|---|---|
| NaCl concentration (mm) | 25 | 50 | 75 |
| Conductivity (S/m) | 0.29 | 0.57 | 0.84 |
| Measured power (W) | 2.3 | 4.5 | 6.6 |
| Simulated power (W) | 2.2 | 4.4 | 6.6 |
Decoupling evaluations in vitro
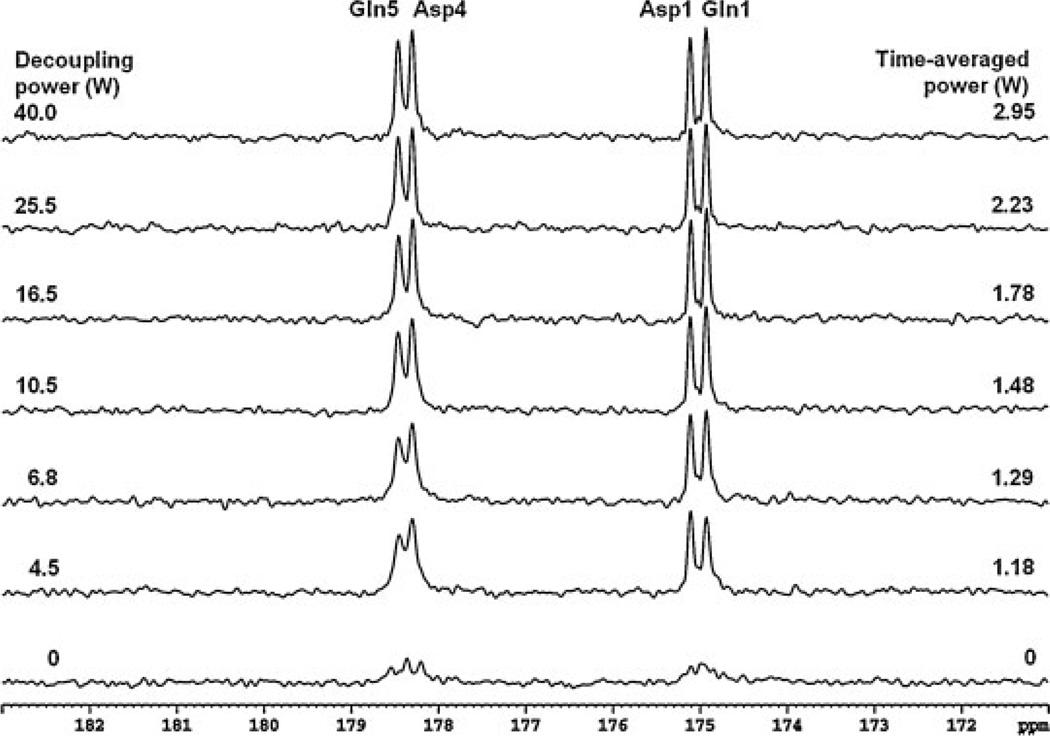
Figure 4 shows the natural abundance 13C spectra from the phantom containing 200 mm glutamine and 200 mm aspartate with stochastic decoupling at a decoupling power ranging from 0 to 40 W. Each spectrum was acquired with TR = 4 s, NS = 64 and an acquisition time of 4.5 min. The free induction decay data were zero-filled to 16 K and apodized with LB = 1.0 Hz. Spectra contained resonances of glutamine C5 (178.5 ppm) and C1 (174.9 ppm), as well as aspartate C4 (178.3 ppm) and C1 (175.0 ppm). As the decoupling power was reduced, the resonances with chemical shifts 0.2 ppm apart were still resolved, even at a very low decoupling power of 45 W (equivalent to a time-averaged power of 1.18 W). An undecoupled spectrum is shown at the bottom of Fig. 4; all resonances became indiscernible, indicating that low-power decoupling was needed to achieve the necessary spectral resolution in the carboxylic/amide region at 3 T. The resonances of glutamine C5 and C1 were more sensitive to decoupling power reduction, as indicated by the broader linewidth and lower signal height when the power was reduced. This is caused by the fact that glutamine protons have a much larger spectral span than aspartate protons (16). The phantom results demonstrated that the decoupling power for carboxylic/amide carbons can be reduced significantly (30 W or below) compared with the decoupling power for alkanyl carbons (70 W or higher).
Figure 4.
Phantom 13C spectra (Lorentzian broadening, 1.0 Hz) of glutamine and aspartate decoupled using stochastic waveform with a unit repetition time of 1.2 ms. The decoupling power and time-averaged power are shown for each spectrum. An undecoupled spectrum is shown at the bottom. Asp, aspartate; Gln, glutamine.
In vivo 13C spectra with [2-13C]glucose infusion
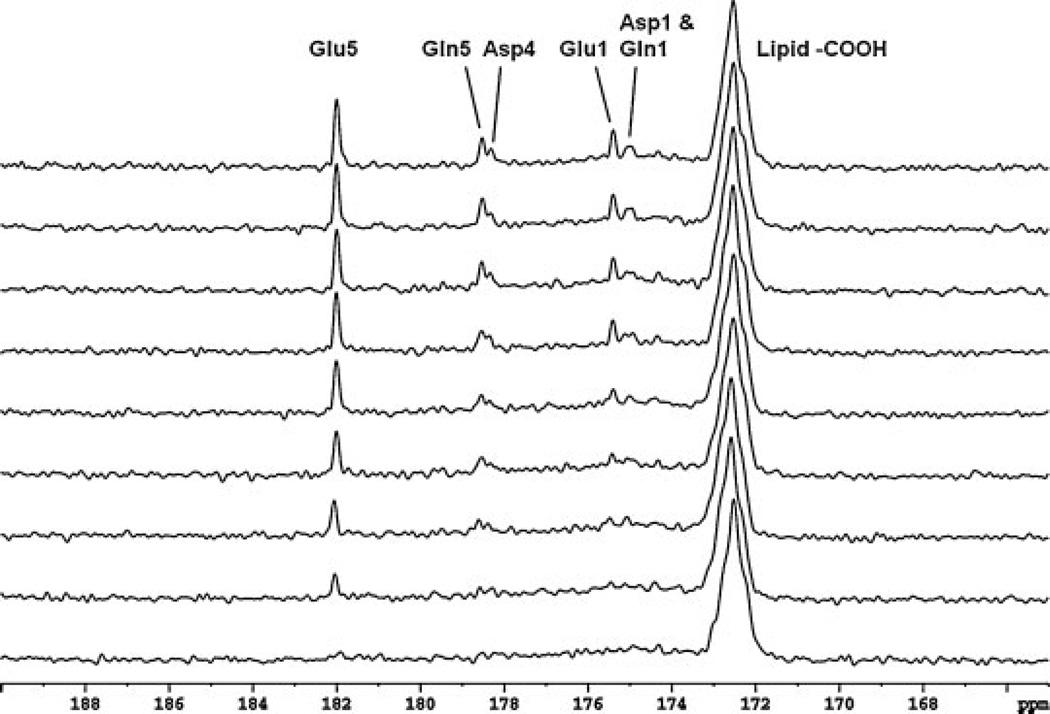
The time course spectra of glutamate, glutamine, aspartate and NAA turnover, obtained from the occipital lobe of human brain with intravenously infused [2-13C]glucose, are shown in Fig. 5. The time-averaged decoupling power was 2.45 W. Each spectrum was acquired in 8.5 min with NS = 128. In the spectra, 13C-labeled glutamate C5 (182.0 ppm) and C1 (175.4 ppm), glutamine C5 (178.5 ppm) and C1 (174.9 ppm), aspartate C4 (178.3 ppm) and C1 (175.0 ppm), and NAA C5 (174.3 ppm) are shown. Glutamine C5 and aspartate C4 were spectrally resolved. The spectral characteristics from the occipital lobe using 30 W volume coil decoupling were in excellent agreement with the spectra from the same region obtained using the half-volume coil at 15 W (16). The signal of natural abundance lipid carboxylic carbons at 172.5 ppm was also enhanced by the low-power decoupling, as demonstrated previously (16).
Figure 5.
Time course spectra of glutamate (Glu), glutamine (Gln) and aspartate (Asp) turnover detected in the occipital lobe during intravenous infusion of [2-13C]glucose. Lorentzian–Gaussian transformation (Lorentzian broadening, −2.0 Hz; Gaussian broadening, 0.3) was applied. The decoupling power was 30 W (time-averaged decoupling power, 2.45 W). Each spectrum corresponds to an 8.5 min signal averaging with NS = 128. Glu C5 (182.0 ppm) and C1 (175.4 ppm), Gln C5 (178.5 ppm) and C1 (174.9 ppm), Asp C4 (178.3 ppm) and C1 (175.0 ppm) were detected. No baseline corrections were made.
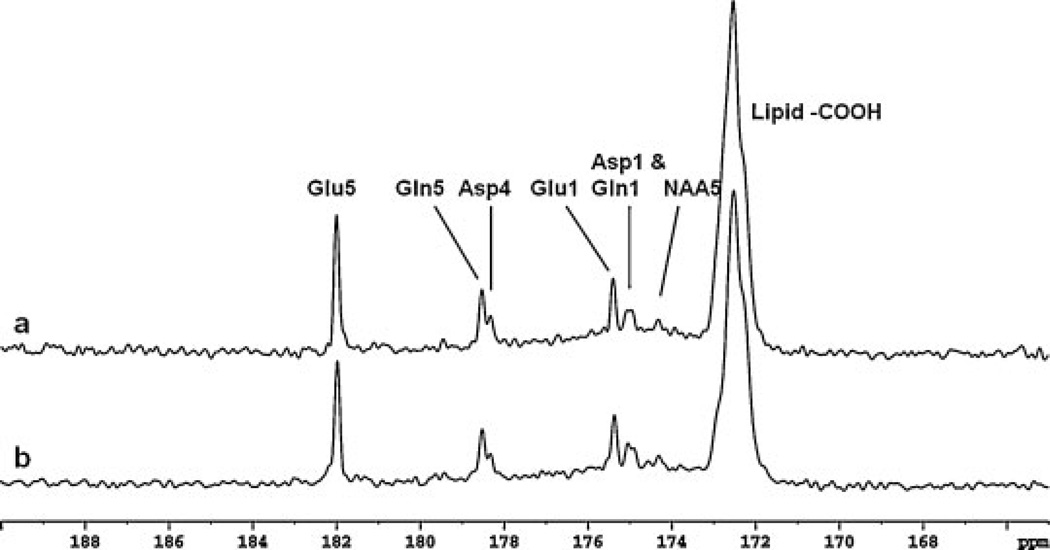
Spectra from the occipital lobe of two subjects accumulated in 25.5 min at the end of infusion are shown in Fig. 6. The spectrum in Fig. 6a is the sum of the last two spectra in Fig. 5 from 56 to 84 min after the infusion started. The spectrum in Fig. 6b is a 25.5 min spectrum from a different subject accumulated from 101 to 127 min after the infusion started. The extended infusion time for the spectrum in Fig. 6b was caused by a urination break. The consistency of the two spectra with our previous results obtained using quadrature surface coils (16) demonstrates that the occipital lobe studies are highly reproducible.
Figure 6.
Spectra obtained from the occipital lobe of two healthy volunteers (a and b). Each spectrum is summed from the last 25.5 min of data acquisition with NS = 384 scans, Lorentzian broadening, −2.0 Hz; Gaussian broadening, 0.3. In addition to Glu C5 and C1, Gln C5 and C1, and Asp C4 and C1, NAA C5 (174.3 ppm) was detected. Asp, aspartate; Gln, glutamine; Glu, glutamate; NAA, N-acetylaspartate.
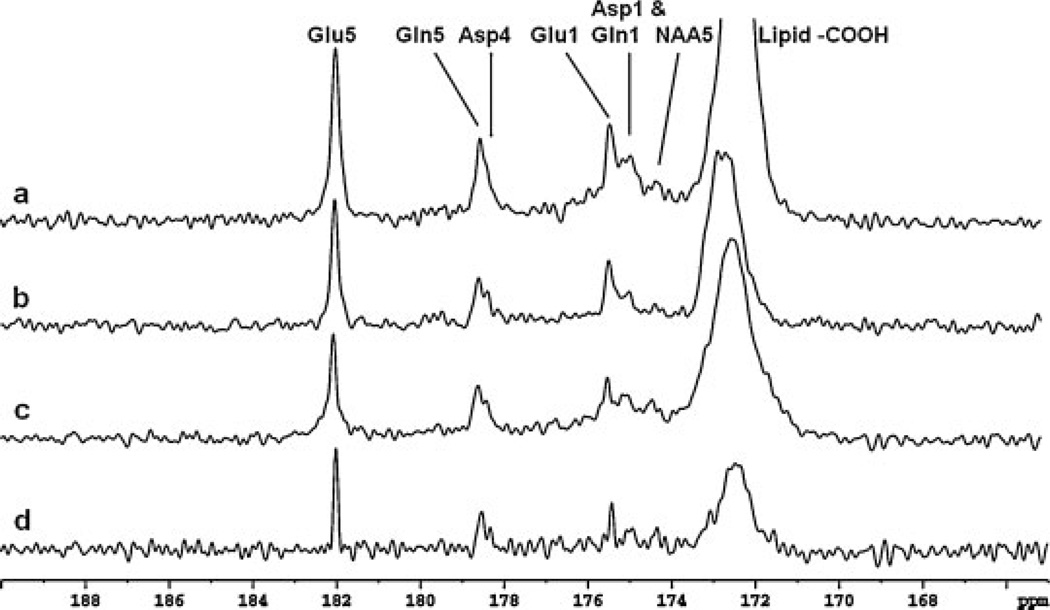
Figure 7 shows frontal lobe 13C spectra in the carboxylic/amide region from three subjects at the steady state of glucose infusion. All spectra were acquired using volume coil decoupling at a time-averaged power of 2.45 W (LB = −2.0 Hz, GB = 0.3, NS = 384). The spectra in Figs. 7a–c were acquired during the 74th to 101st, 80th to 110th, and 67th to 97th minute intervals, respectively, after the initiation of intravenous [2-13C]glucose infusion. Similar to the occipital lobe spectra, the resonances of glutamate C5 (182.0 ppm) and C1 (175.4 ppm), glutamine C5 (178.5 ppm) and C1 (174.9 ppm), aspartate C4 (178.3 ppm) and C1 (175.0 ppm), and NAA C5 (174.3 ppm) were all observed. The glutamine C5 and aspartate C4 peaks are more resolved in the spectra in Figs. 7b and 7c than in the spectrum in Fig. 7a. Because of the stronger distortion of the static magnetic field in the frontal lobe region, the spectral resolution of the frontal lobe spectra was reduced compared with that of the occipital lobe spectra. Figure 7 clearly shows that the frontal lobe 13C spectra in the carboxylic/amide region are very similar to those acquired from the occipital lobe (Figs. 5 and 6). In particular, the 13C frontal lobe signal centered at 178.4 ppm contains two peaks originating from glutamine C5 (178.5 ppm) and aspartate C4 (178.3 ppm). With poor correction of B0 field inhomogeneity and/or insufficient proton decoupling (Fig. 4), this signal could easily be misinterpreted to be a single peak.
Figure 7.
Spectra obtained from the frontal lobe of three healthy volunteers (a, b and c). Each spectrum was summed from the last 25.5 min of data acquisition with NS = 384, Lorentzian broadening (LB) = −2.0 Hz and Gaussian broadening (GB) = 0.3. Spectrum (c) was reprocessed using spectral deconvolution. The deconvolved spectrum is shown in (d) (LB = −2.0 Hz, GB = 0.3). Compared with the spectrum in (c), improved lineshape (represented by the lineshape of Glu C5) and spectral resolution (represented by the peak separation of Gln C5 and Asp C4) were observed. Asp, aspartate; Gln, glutamine; Glu, glutamate; NAA, N-acetylaspartate.
DISCUSSION
Previously, we have compared the B1 field efficiency of the quadrature surface coil and the volume coil using a numerical simulation method (19). Under normalized conditions (1 W of absorbed RF power inside the human head model), the intensity of the volume coil is approximately 50% of that of the quadrature surface coil at the same location centered inside the spectral voxel. Theoretically, four times the RF power is needed for the volume coil to generate the same field intensity as produced by the quadrature surface coil. However, the volume coil provides more uniformed decoupling throughout the active coil volume, which translates into enhanced decoupling efficiency; the actual increase in the required decoupling power should be substantially less than fourfold. As shown in the present study, the peak power of the volume coil (30 W) was only twice that used with quadrature surface coil decoupling (15 W). Because of the uniform decoupling, the SNR of the glutamate C5 peak in the occipital lobe spectrum with volume coil decoupling was essentially the same as that acquired with quadrature surface coil decoupling (16). This result demonstrates that the lesser RF field efficiency of the volume coil can be partially compensated for by its uniform B1 field distribution, and that the same quality of proton-decoupled 13C spectra can be obtained.
The frontal lobe is involved in memory, emotion and higher mental functions. Most psychiatric disorders are believed to be related to dysfunction in the frontal lobe. Frontal lobe MRS, however, has traditionally been quite challenging because of several technical hurdles. The space inferior to the 13C coil (below the frontal lobe) is largely occupied by the frontal sinus, nasal cavity and sphenoid sinus. The inhomogeneous B0 field in the frontal lobe region thus creates significant line broadening and SNR reduction, a negative effect which has been studied using numerical simulations and experimental field mapping (31,32). In these studies, B0 field histograms were used to evaluate the frequency shift and lineshape distortion caused by the susceptibility effect. The resonance frequency at the orbital frontal area could be up to 2–3 ppm higher than that in the dorsolateral and superior frontal areas. For the brain region close to the orbital frontal area, the field histogram shows an asymmetric line broadening in the downfield direction. In the present study, this downfield line broadening was observed in the frontal lobe spectra, as clearly evidenced by the glutamate C5 singlet resonance (Fig. 7). Although the FASTMAP technique can measure first- and second-order field inhomogeneity, the distortion from the strong third (or higher) order components remains problematic because of the lack of higher order shim coils in the clinical scanner. The shimming results were also limited by the available second-order shim current strength.
One of the most commonly used methods for correcting lineshape distortion caused by the susceptibility effect is time domain deconvolution, performed using an NMR reference signal (35–37). A singlet peak with relatively high intensity is preferred for the reference signal. In proton spectroscopy, a water signal is often used as a reference. In conventional 13C spectroscopy, however, it is difficult to select an internal reference because of the nearby chemical shifts of the metabolic peaks and contamination from lipid signals. Another approach – using self-deconvolution without a reference (38) – requires the prior knowledge of all resonances in the spectrum. Therefore, because the residual of the lipid signal is not well defined, self-deconvolution cannot be easily applied in 13C spectroscopy. Fortunately, the 13C spectra acquired in the carboxylic/amide carbon region (as shown in Figs. 5–7) have an advantage, in that the glutamate C5 peak at 182.0 ppm is a singlet, well separated from other peaks, and has a relatively high signal intensity. Thus, it can be used as an internal reference for deconvolution in order to restore lineshape and enhance spectral resolution. The data of this peak in the frequency domain can be clearly cut out and then transformed back into the time domain by Fourier transformation. The curve of its amplitude mode then serves as an internal reference for lineshape deconvolution. One frontal lobe spectrum (see Fig. 7c) was reprocessed with the deconvolution; the deconvolved spectrum is displayed in Fig. 7d with the same Lorentzian–Gaussian transformation parameters (LB = −2.0Hz, GB = 0.3). In the deconvolved spectrum, the broad base of the glutamate C5 peak was significantly reduced, and a narrower, more symmetric lineshape was obtained. In the deconvolved spectra shown in Fig. 7d, the two partially overlapping peaks of glutamine C5 and aspartate C4 (see Fig. 7c) become more resolved.
Many brain disorders present spatially extensive abnormalities in the metabolism of glutamate and other amino acids. As a result, many important clinical and functional discoveries have been made using the same surface-coil localization method as in the current study (39–42). A better defined volume can be obtained by adding proton-based localization with proton-to-carbon polarization transfer schemes to localize a relatively large spectroscopy voxel (5). The primitive second channel on our 3 T scanner prevented us from implementing such a localization method. We would like to emphasize that, as lipids do not interfere with metabolites in the carboxylic/amide region, alternative localization methods (for example, methods based on the sensitivity heterogeneity of receive coils) can be used to localize an arbitrarily shaped region of interest. Work in this direction is currently in progress.
In summary, the present study has shown that the short-volume coil can be safely used for proton decoupling in acquiring 13C spectra of carboxylic/amide carbons in both human frontal and occipital lobes with [2-13C]glucose infusion. Because of the weak coupling between carboxylic/amide carbons and remote protons, 30 W was sufficient for volume coil decoupling. Spectra with high SNR and resolution were consistently obtained from the occipital lobe region. The quality of the frontal lobe spectra was comparatively limited by the lack of high-order, room temperature shim coils. The deconvolution technique was applied to the frontal lobe spectra, which improved the lineshape and spectral resolution. The potential application for volume coil decoupling is to acquire two localized 13C spectra in the same human brain with dynamic shimming. Because most psychiatric disorders are related to dysfunction in the frontal lobe, the simultaneous acquisition of localized 13C spectra, one in the frontal lobe and one in the occipital lobe, would provide a direct comparison of the dysfunctional (frontal) and normal (occipital) regions of the brain in the same subject.
Acknowledgements
The authors are grateful to Ms Renee Hill for technological assistance in patient handling, safety supervision and acquisition of clinical MRI scans. The authors also thank Ms Ioline Henter for editing the manuscript.
This work was supported by the Intramural Research Program of the National Institute of Mental Health, National Institutes of Health (NIMH-NIH).
Abbreviations used
- FASTMAP
fast automatic shimming technique by mapping along projections
- FDTD
finite difference in time domain
- FEM
finite element method
- GABA
γ-aminobutyric acid
- GB
Gaussian broadening
- LB
Lorentzian broadening
- NAA
N-acetylaspartate
- NOE
nuclear Overhauser effect
- RF
radiofrequency
- SAR
specific absorption ratio
- SNR
signal-to-noise ratio
Footnotes
The authors have no conflict of interest to disclose, financial or otherwise.
REFERENCES
- 1.Beckmann N, Turkalj I, Seelig J, Keller U. 13C NMR for the assessment of human brain glucose metabolism in vivo. Biochemistry. 1991;30:6362–6366. doi: 10.1021/bi00240a002. [DOI] [PubMed] [Google Scholar]
- 2.Gruetter R, Novotny EJ, Boulware SD, Mason GF, Rothman DL, Shulman GI, Prichard JW, Shulman RG. Localized 13C NMR spectroscopy in the human brain of amino acid labeling from D-[1-13C]glucose. J Neurochem. 1994;63:1377–1385. doi: 10.1046/j.1471-4159.1994.63041377.x. [DOI] [PubMed] [Google Scholar]
- 3.Gruetter R, Adriany G, Merkle H, Andersen PM. Broadband decoupled, 1H-localized 13C MRS of the human brain at 4 Tesla. Magn Reson Med. 1996;36:659–664. doi: 10.1002/mrm.1910360503. [DOI] [PubMed] [Google Scholar]
- 4.Gruetter R, Seaquist ER, Kim S, Ugurbil K. Localized in vivo 13C-NMR of glutamate metabolism in the human brain: initial results at 4 Tesla. Dev Neurosci. 1998;20:380–388. doi: 10.1159/000017334. [DOI] [PubMed] [Google Scholar]
- 5.Shen J, Petersen KF, Behar KL, Brown P, Nixon TW, Mason GF, Petroff OAC, Shulman GI, Shulman RG, Rothman DL. Determination of the rate of the glutamate/glutamine cycle in the human brain by in vivo13C NMR. Proc Natl Acad Sci USA. 1999;96:8235–8240. doi: 10.1073/pnas.96.14.8235. [DOI] [PMC free article] [PubMed] [Google Scholar]
- 6.Lebon V, Petersen K, Cline GW, Shen J, Mason GF, Dufour S, Behar KL, Shulman GI, Rothman DL. Astroglial contribution to brain energy metabolism in humans revealed by 13C nuclear magnetic resonance spectroscopy: elucidation of the dominant pathway for neurotransmitter glutamate repletion and measurement of astrocytic oxidative metabolism. J Neurosci. 2002;22:1523–1531. doi: 10.1523/JNEUROSCI.22-05-01523.2002. [DOI] [PMC free article] [PubMed] [Google Scholar]
- 7.Mason GF, Petersen KF, de Graaf RA, Shulman GI, Rothman DL. Measurements of the anaplerotic rate in the human cerebral cortex using 13C magnetic resonance spectroscopy and [1-13C] and [2-13C]glucose. J Neurochem. 2007;100:73–86. doi: 10.1111/j.1471-4159.2006.04200.x. [DOI] [PMC free article] [PubMed] [Google Scholar]
- 8.Mason GF, Petersen KF, Shen J, Behar KL, Petroff OAC, Shulman GI, Rothman DL. Measurement of the rate of pyruvate carboxylase in human brain by 13C NMR. Proceedings of the 8th Annual Meeting of the International Society of Magnetic Resonance in Medicine; Danver, CO, USA. 2000. p. 912. [Google Scholar]
- 9.USA: Center for Devices and Radiological Health, Food and Drug Administration; 2003. Criteria for significant risk investigations of magnetic resonance diagnostic devices. http://www.fda.gov/cdrh/ode/guidance/793.html. [Google Scholar]
- 10.International Electrotechnical Commission. International Standard, Medical Equipment – Part 2: Particular Requirements for the Safety of Magnetic Resonance Equipment for Medical Diagnosis. 2nd revision. Vol. 601. Geneva: International Electrotechnical Commission; 2002. pp. 2–33. [Google Scholar]
- 11.Adriany G, Gruetter R. A half-volume coil for efficient proton decoupling in human at 4 Tesla. J Magn Reson. 1997;125:178–184. doi: 10.1006/jmre.1997.1113. [DOI] [PubMed] [Google Scholar]
- 12.Barker PB, Golay X, Artemov D, Ouwerkerk R, Smith MA, Shaka AJ. Broadband proton decoupling for in vivo brain spectroscopy in humans. Magn Reson Med. 2001;45:226–232. doi: 10.1002/1522-2594(200102)45:2<226::aid-mrm1031>3.0.co;2-z. [DOI] [PubMed] [Google Scholar]
- 13.Klomp DWJ, Renema WKJ, van der Graaf M, de Galan BE, Kentgens APM, Heerschap A. Sensitivity-enhanced 13C MR spectroscopy of the human brain at 3 Tesla. Magn Reson Med. 2006;55:271–278. doi: 10.1002/mrm.20745. [DOI] [PubMed] [Google Scholar]
- 14.Klomp DWJ, Kentgens APM, Heerschap A. Polarization transfer for sensitivity-enhanced MRS using a single radio frequency transmit channel. NMR Biomed. 2008;21:444–452. doi: 10.1002/nbm.1208. [DOI] [PubMed] [Google Scholar]
- 15.Li S, Yang J, Shen J. Novel strategy for cerebral 13C MRS using very low RF power for proton decoupling. Magn Reson Med. 2007;57:265–271. doi: 10.1002/mrm.21148. [DOI] [PubMed] [Google Scholar]
- 16.Li S, Zhang Y, Wang S, Yang J, Ferraris Araneta M, Farris A, Johnson C, Fox S, Innis R, Shen J. In vivo 13C magnetic resonance spectroscopy of human brain on a clinical 3 T scanner using [2-13C]glucose infusion and low-power stochastic decoupling. Magn Reson Med. 2009;62:565–573. doi: 10.1002/mrm.22044. [DOI] [PMC free article] [PubMed] [Google Scholar]
- 17.Li S, Wang S, Shen J. Safety evaluation for 1H decoupled 13C spectroscopy at 3 T in human frontal lobe: SAR analysis using numerical simulations. Proceedings of the 16th Annual Meeting of the International Society of Magnetic Resonance in Medicine; Toronto, Canada. 2008. p. 783. [Google Scholar]
- 18.Li S, Wang S, Shen J. How reliable are computer simulations for RF power deposition? An experimental verification of numerical simulations. Proceedings of the 17th Annual Meeting of the International Society of Magnetic Resonance in Medicine; Hawaii, USA. 2009. p. 3053. [Google Scholar]
- 19.Li S, Zhang Y, Wang S, Ferraris Araneta M, Johnson C, Innis R, Shen J. In vivo 13C MRS of human brain at 3 T using stochastic decoupling with a proton volume coil. Proceedings of the 17th Annual Meeting of the International Society of Magnetic Resonance in Medicine; Hawaii, USA. 2009. p. 2368. [Google Scholar]
- 20.Wang S, Duyn JH. Time-domain finite-difference/finite-element hybrid simulations of radio frequency coils in magnetic resonance imaging. Phys Med Biol. 2008;53:2677–2692. doi: 10.1088/0031-9155/53/10/016. [DOI] [PubMed] [Google Scholar]
- 21.Wang S, Duyn JH. Three-dimensional automatic mesh generation for hybrid electromagnetic simulations. IEEE Antennas Propagation Mag. 2009;51:71–85. [Google Scholar]
- 22.Gabriel C. Technical Report, Brooks Air Force AL/OE-TR-1996-0037. Brooks Air Force Base, TX: US Air Force Research Laboratory; 1996. Compilation of the dielectric properties of body tissues at RF and microwave frequencies. [Google Scholar]
- 23.Collins CM, Smith MB. Signal-to-noise ratio and absorbed power as functions of main magnetic field strength, and definition of ‘90°’ RF pulse for the head in the birdcage coil. Magn Reson Med. 2001;45:684–691. doi: 10.1002/mrm.1091. [DOI] [PubMed] [Google Scholar]
- 24.Collins CM, Liu W, Wang J, Gruetter R, Vaughan JT, Ugurbil K, Smith MB. Temperature and SAR calculations for a human head within volume and surface coils at 64 and 300 MHz. J Magn Reson Imag. 2004;19:650–656. doi: 10.1002/jmri.20041. [DOI] [PubMed] [Google Scholar]
- 25.Nguyen UD, Brown JS, Chang IA, Krycia J, Mirotznik MS. Numerical evaluation of heating of the human head due to magnetic resonance imaging. IEEE Trans Biomed Eng. 2004;51:1301–1309. doi: 10.1109/TBME.2004.827559. [DOI] [PubMed] [Google Scholar]
- 26.Wang Z, Lin JC, Mao W, Liu W, Smith MB, Collins CM. SAR and temperature: simulations and comparison to regulatory limits for MRI. J Magn Reson Imag. 2008;26:437–441. doi: 10.1002/jmri.20977. [DOI] [PMC free article] [PubMed] [Google Scholar]
- 27.Oh S, Webb AG, Neuberger T, Park B, Collins CM. Experimental and numerical assessment of MRI-induced temperature change and SAR distributions in phantoms and in vivo. Magn Reson Med. 2010;63:218–223. doi: 10.1002/mrm.22174. [DOI] [PMC free article] [PubMed] [Google Scholar]
- 28.Rosslyn, VA: NEMA; 1993. National Electrical Manufacturers Association (NEMA) standards publication No. 8-1993 (R2000) [Google Scholar]
- 29.Schwan HP. Electrical properties of tissue and cell suspension. Adv Biol Med Phys. 1957;(5):147–209. doi: 10.1016/b978-1-4832-3111-2.50008-0. [DOI] [PubMed] [Google Scholar]
- 30.Gruetter R. Automatic, localized in vivo adjustment of all first- and second-order shim coils. Magn Reson Med. 1993;29:804–811. doi: 10.1002/mrm.1910290613. [DOI] [PubMed] [Google Scholar]
- 31.Li S, Williams GD, Frisk TA, Arnold BW, Smith MB. A computer simulation of the static magnetic field distribution in the human head. Magn Reson Med. 1995;34:268–275. doi: 10.1002/mrm.1910340219. [DOI] [PubMed] [Google Scholar]
- 32.Li S, Dardzinski BJ, Collins CM, Yang QX, Smith MB. Three-dimensional mapping of the static magnetic field inside the human head. Magn Reson Med. 1996;36:705–714. doi: 10.1002/mrm.1910360509. [DOI] [PubMed] [Google Scholar]
- 33.Gabriel C, Gabriel S, Corthout E. The dielectric properties of biological tissues: I. Literature survey. Phys Med Biol. 1996;41:2231–2249. doi: 10.1088/0031-9155/41/11/001. [DOI] [PubMed] [Google Scholar]
- 34.Gabriel S, Lau RW, Gabriel C. The dielectric properties of biological tissues: II. Measurements in the frequency range 10Hz to 20GHz. Phys Med Biol. 1996;41:2251–2269. doi: 10.1088/0031-9155/41/11/002. [DOI] [PubMed] [Google Scholar]
- 35.Metz KR, Lam MM, Webb AG. Reference deconvolution: a simple and effective method for resolution enhancement in nuclear magnetic resonance spectroscopy. Concepts Magn Reson. 1999;12:21–42. [Google Scholar]
- 36.De Graaf AA, van Dijk JE, Bovee WMMJ. QUALITYL quantification improvement by converting lineshapes to the lorentzian type. Magn Reson Med. 1990;13:343–357. doi: 10.1002/mrm.1910130302. [DOI] [PubMed] [Google Scholar]
- 37.Bartha R, Drost DJ, Menon RS, Williamson PC. Spectroscopic lineshape correction by QUESS: combined QUALITY deconvolution and eddy current correction. Magn Reson Med. 2000;44:641–645. doi: 10.1002/1522-2594(200010)44:4<641::aid-mrm19>3.0.co;2-g. [DOI] [PubMed] [Google Scholar]
- 38.Maudsley AA. Spectral lineshape determination by selfdeconvolution. J Magn Reson (B) 1995;106:47–57. doi: 10.1006/jmrb.1995.1007. [DOI] [PubMed] [Google Scholar]
- 39.Bluml S, Moreno-Torres A, Shic F, Nguy CH, Ross BD. Tricarboxylic acid cycle of glia in the in vivo human brain. NMR Biomed. 2002;15:1–5. doi: 10.1002/nbm.725. [DOI] [PubMed] [Google Scholar]
- 40.Lin AP, Shic F, Enriquez C, Ross BD. Reduced glutamate neurotransmission in patients with Alzheimer’s disease – an in vivo 13C magnetic resonance spectroscopy study. MAGMA. 2003;16:29–42. doi: 10.1007/s10334-003-0004-x. [DOI] [PubMed] [Google Scholar]
- 41.Chhina N, Kuestermann E, Halliday J, Simpson LJ, Macdonald IA, Bachelard HS, Morris PG. Measurement of human tricarboxylic acid cycle rates during visual activation by 13C magnetic resonance spectroscopy. J Neurosci Res. 2001;66:737–746. doi: 10.1002/jnr.10053. [DOI] [PubMed] [Google Scholar]
- 42.Gropman AL, Sailasuta N, Harris KC, Abulseoud O, Ross BD. Ornithine transcarbamylase deficiency with persistent abnormality in cerebral glutamate metabolism in adults. Radiology. 2009;252:833–841. doi: 10.1148/radiol.2523081878. [DOI] [PMC free article] [PubMed] [Google Scholar]


