

The authors propose that prokaryotic metabolism is fundamentally constrained by the cytoplasmic membrane surface area available for protein expression, and show that this constraint can explain previously puzzling physiological phenomena, including respiro-fermentation.
Keywords: constraint-based modeling, flux balance analysis, membrane occupancy, overflow metabolism, respiro-fermentation
Abstract
The simultaneous utilization of efficient respiration and inefficient fermentation even in the presence of abundant oxygen is a puzzling phenomenon commonly observed in bacteria, yeasts, and cancer cells. Despite extensive research, the biochemical basis for this phenomenon remains obscure. We hypothesize that the outcome of a competition for membrane space between glucose transporters and respiratory chain (which we refer to as economics of membrane occupancy) proteins influences respiration and fermentation. By incorporating a sole constraint based on this concept in the genome-scale metabolic model of Escherichia coli, we were able to simulate respiro-fermentation. Further analysis of the impact of this constraint revealed differential utilization of the cytochromes and faster glucose uptake under anaerobic conditions than under aerobic conditions. Based on these simulations, we propose that bacterial cells manage the composition of their cytoplasmic membrane to maintain optimal ATP production by switching between oxidative and substrate-level phosphorylation. These results suggest that the membrane occupancy constraint may be a fundamental governing constraint of cellular metabolism and physiology, and establishes a direct link between cell morphology and physiology.
Introduction
Many heterotrophs can produce ATP through both respiratory and fermentative pathways, allowing them to survive with or without oxygen. Since the molar ATP yield (molar ATP yield: mole of ATP produced/mole of substrate consumed) from respiration is about 15-fold higher than that from fermentation, ATP production via respiration is more efficient. Surprisingly, at high catabolic rate, many facultative aerobic organisms employ fermentative pathways simultaneously with respiration, even in the presence of abundant oxygen to produce ATP (Pfeiffer et al, 2001; Vemuri et al, 2006, 2007; Veit et al, 2007; MacLean, 2008; Molenaar et al, 2009). This leads to an observable tradeoff between the ATP yield and the catabolic rate (Pfeiffer et al, 2001; Vemuri et al, 2006). This respiro-fermentation physiology is commonly observed in microorganisms, including Escherichia coli, Bacillus subtilis, Saccharomyces cerevisiae (Molenaar et al, 2009), as well as cancer cells (Vander Heiden et al, 2009). Despite extensive research, the biochemical basis for this phenomenon remains obscure.
One influential theory attributed the utilization of the fermentative pathways to a hypothetical limitation on the respiratory capacity (Sonnleitner and Kappeli, 1986; Majewski and Domach, 1990). This theory suggests that as the respiratory pathway becomes saturated at high substrate influx, the organism may choose to satisfy its ATP demand by fermenting additional substrates, a strategy that offers a fitness advantage at the cost of lowering the ATP yield (Majewski and Domach, 1990; Varma and Palsson, 1994; Pfeiffer et al, 2001). However, overexpressing the genes encoding for the rate-limiting enzymes did not increase the respiratory capacity (Cupp and McAlister-Henn, 1991; Repetto and Tzagoloff, 1991). Furthermore, it is puzzling why the respiratory capacity varies with different substrates. Despite this caveat, metabolic models (Palsson, 2000) such as the flux balance analysis (FBA) (Varma and Palsson, 1994; Edwards et al, 2001; Feist et al, 2007) commonly adopt the ‘respiratory capacity limitation’ theory through the introduction of an empirically measured cap on maximal oxygen uptake rate (OUR) (Figure 1A and B). In addition to respiration, the tricarboxylic acid (TCA) cycle is actively downregulated in E. coli, B. subtilis, and S. cerevisiae during respiro-fermentation (Vemuri et al, 2006, 2007; Sonenshein, 2007); this implies that the OURs of these organisms at higher catabolic rates are perhaps regulated to be lower than their respective maximal OURs, possibly reflecting an unexplained evolutionary advantage for lowered respiration (Molenaar et al, 2009).
Figure 1.

The effects of the uptake and membrane occupancy constraints on the solution space. (A) Solution space of an unconstrained E. coli model. (B) Yield predicted by FBA. (C) Yield predicted by FBAME. (D) Energy production pathway predicted by FBA. (E) Energy production pathway predicted by FBAME. The color in panels (A–C) indicates the growth yield. The color in panels (D, E) indicates the predicted energy production pathway—red for fermentation, blue for respiration through Cyo, and green for respiration through Cyd-II. In panels (B, C),  indicates the solution with optimal growth yield, and
  indicates the solution with optimal growth rate. The shape of the solution space is different between FBA and FBAME; the utilization of Cyd-II is predicted by FBAME, but never predicted by FBA.
Challenging the conventional assumption that aerobic respiration is always preferred over fermentation (Majewski and Domach, 1990; Varma and Palsson, 1994), a recent theory (Schuster et al, 2008) proposed that while the cellular metabolism maximizes the ATP yield in nutrient-poor environments, it maximizes the catabolic rate and the rate of energy dissipation in nutrient-rich environments. The biochemical basis for this switch in metabolic objective is the prohibitively expensive synthesis costs of respiratory enzymes, particularly during high catabolic rate (Pfeiffer and Bonhoeffer, 2004; Molenaar et al, 2009). This line of reasoning leads to the conclusion that pure fermentation be accompanied with high growth rate. Yet, rapidly growing facultative aerobes also respire. Furthermore, if the catabolic rate is indeed maximized during unlimited growth, it is unclear why the maximum substrate uptake is slower under aerobic condition than anaerobic conditions (Portnoy et al, 2008). Another theory proposed that the tradeoff between ATP yield and catabolic rate is dependent on the fraction of intracellular volume occupied by respiratory enzymes and glycolytic enzymes, respectively (Vazquez et al, 2008). While the FBA with ‘molecular crowding constraint’ (FBAwMC) (Beg et al, 2007; Vazquez et al, 2008) can predict acetate production to a certain extent, it could not predict the experimentally observed changes in growth rate and yield (Supplementary information). Furthermore, FBAwMC cannot predict the production of acetate if the electron transport chain enzymes—membrane-bound enzymes that consumes little intracellular volume—are removed from its formulation (Supplementary information). Despite these shortcomings, these theories highlight that the rate of metabolic processes must be accounted for in addition to the metabolic stoichiometry in understanding respiro-fermentative metabolism.
Finally, these aforementioned theories assume that the observed tradeoff between the ATP yield and the catabolic rate is solely caused by the utilization of fermentative pathways. However, experimental evidence (Supplementary information) suggests that the efficiency of the respiratory pathway itself may be compromised due to the utilization of less-efficient dehydrogenases and cytochromes. Given that there exists a thermodynamic tradeoff between the turnover rate and the energetic efficiency of an enzyme (Meyer and Jones, 1973; Waddell et al, 1997; Pfeiffer and Bonhoeffer, 2002), less-efficient enzymes may be preferred for their increased turnover rate. Based on these observations, we propose a simple, alternative explanation of the respiro-fermentation phenomenon by considering membrane occupancy, which provides a mechanistic explanation to all the observed physiological changes during the transition from respiratory to respiro-fermentative metabolism.
Results
Prokaryotic membrane economics
The lipid membrane is an essential feature of all cells, and hosts various transmembrane proteins such as metabolite transporters and the respiratory enzymes. To maintain membrane integrity, the protein-to-lipid ratio must be kept below a critical level (Molenaar et al, 2009), therefore, only a fraction of the membrane area is available for protein expression. At higher catabolic rates, the prokaryotic cytoplasmic membrane can become saturated with transmembrane proteins. When this happens, all transmembrane proteins must ‘compete’ for the fixed membrane area available for protein expression (see Materials and methods). Such a constraint on transmembrane protein expression may have significant physiological consequences in prokaryotes, such as E. coli, at higher catabolic rates. First, since both substrate transporters and respiratory enzymes are localized on the cytoplasmic membrane in prokaryotes, increased substrate uptake rates necessitates a decrease in the respiratory rate. This decrease in the respiratory rate, forces prokaryotes to process the additional substrate through the fermentative pathways, which are not catalyzed by transmembrane proteins, for continued ATP production. Furthermore, since the membrane requirement of an enzyme is inversely related to its turnover rate (see Materials and methods), the faster, but inefficient respiratory enzymes (such as Cyd-I and Cyd-II in E. coli) might be preferred over the slower and efficient enzymes (such as Cyo in E. coli), leading to an altered respiratory stoichiometry at higher catabolic rates. Finally, the absence of the respiratory enzymes under anaerobic conditions releases transmembrane space, which can be occupied by glucose transporters, resulting in faster glucose uptake rate (GUR) of E. coli.
Unlike the empirically derived uptake constraints used in FBA (Varma and Palsson, 1994; Edwards et al, 2001; Feist et al, 2007), our proposed theory of cytoplasmic membrane economics is mechanistic in nature, and is extensively supported by experimental evidences. For example, the overexpression of a non-respiratory membrane protein (YidC) in E. coli decreased the expression of succinate dehydrogenase and cytochrome oxidases as well as the oxygen consumption rate by >50%; similarly, the overexpression of membrane proteins (YidC, YedZ, and LepI) alone was capable of inducing aerobic fermentation in the form of acetate production (Wagner et al, 2007). Finally, E. coli lacking cytochrome oxidase genes could be adaptively evolved to obtain the same growth rate and GUR under aerobic conditions as under anaerobic conditions (Portnoy et al, 2008), corroborating our proposed theory of a competition for membrane availability between the substrate uptake and respiratory enzymes.
To study the physiological effects of cytoplasmic membrane constraint, we define the fraction of the available membrane required for a reaction to achieve the reaction rate of 1 mmol/gdw/h as the ‘relative membrane cost’ of the reaction. Based on the theoretical and experimental evidence discussed above, we propose that prokaryotic organisms manage the expression of transmembrane proteins economically so that the fitness is maximized while maintaining membrane integrity (see Materials and methods).
Modeling E. coli physiology
To illustrate that the ‘membrane economics’ theory could satisfactorily explain the physiological changes associated with the respiro-fermentation phenomenon in E. coli, we modified the genome-scale metabolic model of E. coli (Feist et al, 2007) to include the cytoplasmic membrane constraint. In E. coli, the cytoplasmic membrane is shared by a host of proteins, many of which are not directly involved in ATP production. As a simplification, our model assumes that only the expression of the glucose transporter and the three cytochromes (Cyo, Cyd-I, Cyd-II) are constrained by the availability of the cytoplasmic membrane. The relative membrane costs of the glucose transporter and the three terminal cytochrome oxidases (Cyo, Cyd-I, Cyd-II) were calculated from the growth data of various cytochrome-knockout strains (see Materials and methods). The three oxidases have varying turnover rates and energetic efficiency defined in terms of the proton translocation stoichiometry and the associated ATP yield (Bekker et al, 2009). Since the ‘relative membrane cost’ of an enzyme is inversely related to its turnover rate, the fast and inefficient Cyd-II (Bekker et al, 2009) has a much lower cost than the slow and highly efficient Cyo. The relative cost of the moderately efficient Cyd-I is similar to that of Cyo under fully aerobic conditions; however, this cost becomes much less than that of Cyo under microaerobic (here, a microaerobic environment is defined as an environment where the oxygen concentration is <0.01 mM) conditions due to Cyd-I's high affinity for oxygen (Tseng et al, 1996; Bekker et al, 2009).
Aerobic physiology in nutrient-excess and nutrient-limiting environments
Simulating the metabolism using the conventional FBA in nutrient-rich environment requires imposing artificial constraints on certain uptake fluxes, such as glucose and OURs, in order to get meaningful output (Figure 1B). This requirement arises because FBA does not account for the tradeoff between catabolic rate and ATP yield—the growth rate increases unboundedly with the catabolic rate (when glucose is the sole carbon source, the GUR is a representation of the overall catabolic rate) in an unconstrained FBA model (Figure 1A). Constraining the occupancy of glucose transporters or the cytochrome oxidases on the cytoplasmic membrane, in an otherwise unconstrained FBA model, substantially decreases the solution space (Figure 1C). As a result, an ‘optimal solution’ can be found along the line of optimality without any constraints on fluxes (Figure 1C). Using ‘relative membrane costs’ calculated from experimental data, the new modeling framework—FBA with membrane economics (FBAME)—predicted that wild-type E. coli has a GUR of 10.7 mmol/gdw/h, an OUR of 15.8 mmol/gdw/h, and a specific growth rate of 0.69 per hour during aerobic growth with excess glucose. FBAME also predicted that under the same growth condition, an E. coli knockout strain with no cytochromes has a GUR of 18 mmol/gdw/h and growth rate of 0.42. These values agree very well with the observed experimental values for E. coli grown in batch cultures (Vemuri et al, 2006; Portnoy et al, 2008), which supports our argument that the higher GUR of E. coli during anaerobiosis than under aerobic conditions is due to the absence of the respiratory enzymes.
We also simulated the aerobic growth of E. coli in glucose-limited chemostat using both conventional FBA and FBAME. FBAME successfully predicted the growth rate and yield changes with respect to increasing GUR (Figure 2A and B), as well as the aerobic production of acetate (Figure 2C) and concomitant repression of oxygen uptake (Figure 2D). On the other hand, traditional FBA significantly overestimated the growth rate and yield at higher GURs (this overestimation cannot be explained by varying the growth-associated maintenance energy parameter; Figure 2A), and failed to predict the reduction in oxygen uptake at higher GURs (Figure 2). Furthermore, FBAME predicted the selective expression of Cyo and Cyd-II at lower uptake rates (Figures 1E and 3A and B) as well as the reduction of the TCA cycle activities at higher uptake rates (Figure 3C and D). The predictions from FBAME are in excellent agreement with the gene expression data from glucose-limited chemostat (Figure 3), and the utilization of Cyd-II explains the subtle decrease in respiratory efficiency observed in experiments (Supplementary information). Given the simplicity of the constraint we imposed, our model predictions agree surprisingly well with experimental observations, lending strong credibility to the membrane economics hypothesis.
Figure 2.
The predicted yield (A), growth rate (B), acetate production rate (C), and oxygen production rate (D) as a function of the GUR. Asterisk indicates experimental measurements obtained by Vemuri et al (2006). The lines refer to the predictions of the FBAME (red solid), FBA with low GAM (blue dashed), and FBA with high GAM (green dash-dot). Source data is available for this figure at www.nature.com/msb.

Figure 3.
Comparison between FBAME predictions and experimentally measured gene expressions of Cyo (A, E), Cyd-II (B, F), succinate dehydrogenase (C, G), and succinyl-CoA synthetase (D, H). In panels (A, B), relative expression is the portion of the available membrane (total=1) used by a protein; this value is directly related to the abundance of the protein on the membrane. Symbols are used in panels (E–H) to distinguish the gene expressions of different subunits (panel (E): star=cyoA, diamond=cyoB, circle=cyoC, triangle=cyoD; panel (F): star=appB, diamond=appC, circle=appY; panel (G): star=sdhC, diamond=sdhD; and panel (H): star=suchC, diamond=sucD). Gene expression data was obtained from NCBI GEO using the accession number GSE4366. Source data is available for this figure at www.nature.com/msb.

Selective expression of cytochromes and activation of fermentation pathways
Having validated the concept of membrane occupancy, we studied the coordination of glucose transport with cytochrome oxidase activity, mediated by Cyo, Cyd-I, or Cyd-II at low, medium, or high rate of glucose uptake under aerobic or microaerobic conditions. FBAME indicates that E. coli regulates the expression of cytochrome oxidases based on the availability of glucose and oxygen. Under aerobic conditions, at lower GURs (<3.2 mmol/gdw/h), the high cost of the efficient Cyo is not penalized because the membrane is not completely saturated—the glucose transporters share the membrane with the Cyo without competition (Figures 3A and 4A). Consequently, both growth rate and yield increase with GUR (Figure 2A and B). As the GUR increases beyond a certain critical level (3.2 mmol/gdw/h), the membrane becomes saturated and any further increase in the GUR requires more glucose transporter proteins to be expressed at the expense of the cytochrome oxidases in the membrane. Thus, at medium GURs (3.2–8 mmol/gdw/h), the low-cost Cyd-II replaces the costly Cyo (Figures 3A and B and 4B) at the expense of respiratory efficiency, leading to an increase in growth rate but a decrease in growth yield (Figure 2A and B). Once the GUR surpasses a second critical level (8 mmol/gdw/h), the membrane is occupied predominantly by Cyd-II. Further increase in the GUR necessitates some Cyd-II be replaced by the glucose transporters (Figure 4C), decreasing the rate of respiration (Figure 2D). As a result, a portion of the glucose is metabolized through the fermentative pathways (Figures 2C and 4C), leading to a significant loss in energetic efficiency and biomass yield (Figure 2A). Nonetheless, during this phase, the growth rate continues to increase (Figure 2B). Maximal growth rate is reached when the ATP gain from increased GUR can no longer offset the ATP loss from the efficiency reduction (Figures 1C and 2B).
Figure 4.

The E. coli cytoplasmic membrane occupancy by glucose transporters (brown), Cyo (blue), Cyd-I (red), and Cyd-II (green) under aerobic low GUR (A), aerobic medium GUR (B), aerobic high GUR (C), and microaerobic conditions (D). In this figure, the spheres represent the membrane enzymes, and the gray line underneath the spheres represents the cytoplasmic membrane. The arrows represent the metabolic flow.
Expression of Cyd-I under microaerobic growth conditions
Under aerobic conditions, FBAME predicts that Cyd-I is not used because its membrane cost is similar to that of Cyo but it has a much lower energetic efficiency. However, under microaerobic conditions, the membrane cost is inversely related to oxygen affinity of the enzymes (Equation 6), making Cyd-I the preferred cytochrome (Figure 4D; Supplementary information) due to its high oxygen affinity (Puustinen et al, 1991; Govantes et al, 2000; Bekker et al, 2009). Conventional FBA cannot predict E. coli's preference for Cyd-I under microaerobic conditions because it cannot take oxygen affinity into account.
The transcriptional regulation of Cyo and Cyd-I expression is achieved in E. coli through ArcA. ArcA represses the expression of Cyo and induces Cyd-I (Tseng et al, 1996). As such, in ArcA knockout strains, Cyo is expressed instead of Cyd-I. Since Cyo is more costly than Cyd-I under microaerobic conditions, this would lead to a decrease in glucose transporter expression. Indeed, a decrease in GUR is indeed observed in ArcA knockout strains grown under microaerobic condition (Nikel et al, 2009).
Discussion
How crowded is the cytoplasmic membrane?
Despite the high degree of consistency between our model prediction and experimental observations (Figures 2 and 3; Supplementary Figure 3), as well as various indirect evidence (Wagner et al, 2007), the ‘coverage’ (fraction occupied by proteins) of the cytoplasmic membrane has not been directly confirmed by targeted membrane studies. However, Phillips and Milo (2009) have estimated that glucose transporters take up >4% of E. coli membrane area. Assuming 50% of the membrane is composed of lipids (Molenaar et al, 2009), glucose transporters alone occupy >8% of the membrane area available for protein expression. Similar estimates suggest that at the highest OUR (18 mmol/gdw/h), about 15% of E. coli's cytoplasmic proteins are cytochromes while under microaerobic conditions, about 11% (Supplementary information). Furthermore, estimates based on simulated ATP requirement suggest that about 13% of cytoplasmic proteins are ATP synthase during optimal aerobic growth (Supplementary information; B Palsson, personal communication). These estimates suggest an extremely crowded cytoplasmic membrane where various enzymes compete for the available membrane area (Phillips and Milo, 2009). In the future, the measurements of the membrane saturation level and the abundance of various membrane enzymes may serve as a direct confirmation of our hypothesis, and may be useful for the acquisition of more accurate model parameters.
Linking physiology and morphology in bacteria
Our simulations are consistent with the hypothesis that E. coli's regulatory program has evolved to ensure the efficient utilization of the finite cytoplasmic membrane. The size of E. coli's specific cytoplasmic membrane available for transmembrane protein expression is directly related to its surface area to volume (S/V) ratio (see Materials and methods), which is greatly affected by the cell morphology; thus, this model allows for the first time, the ability to analyze the relation between morphology and physiology of this organism. For a rod-shaped cell, the S/V ratio is very sensitive to the change in its radius, but insensitive to the change in its length. Throughout the growth phase, the rod-shaped E. coli grows primarily by elongation (Begg and Donachie, 1985), thus ensures that the same regulatory program remains useful through the growth process despite the necessary morphological changes during binary fission. During energy starvation, E. coli becomes spherical and much smaller (Lange and Hengge-Aronis, 1991); the resultant increase in the S/V ratio allows E. coli to scavenge for multiple nutrient sources simultaneously using different transporters without sacrificing efficiency.
Morphological control of S/V ratio may be a common strategy in bacteria to obtain the desired rate of respiration. For example, Geobacter sulfurreducens is perhaps capable of obtaining much higher rate of respiration from acetate than Rhodoferax ferrireducens, a similar iron-reducer (Esteve-Nunez et al, 2005; Risso et al, 2009; Zhuang et al, 2011) due to its smaller size and the resultant high S/V ratio. The free energy-starved Dehalococcoides spp. may have evolved its disk shape in order to maximize the dechlorination rate given the low thermodynamic efficiency associated with the dechlorination process (Jayachandran et al, 2004).
Membrane constraints in eukaryotic cells
Given the generic nature of the constraint we proposed, it is only rational that economics of membrane occupancy also be applicable to eukaryotic metabolism since eukaryotes also exhibit aerobic fermentation. Eukaryotes are generally larger than prokaryotes. While the increase in volume accommodates the greater level of complexity, the downside is that it leads to a significant reduction in S/V ratio. Therefore, it is plausible that one reason for compartmentalization of eukaryotic metabolism is to increase the membrane availability. We believe that the concept of competition to occupy transmembrane space by different proteins is also prevalent in eukaryotes as well, although the competing proteins, nature of competition, and the direct outcome of the competition are far more complex and warrant further investigation. Two independent observations substantiate this idea. The first is a positive correlation between respiration and the mitochondrial membrane area in yeast (Visser et al, 1995) and higher organisms (Bicudo and Zerbinatti, 1995). The second is the implication that glucose uptake in yeast may be limited by the cytoplasmic membrane area (Phillips and Milo, 2009).
In eukaryotes, glucose transporters are located on the cytoplasmic membrane and the cytochromes are located on the mitochondrial membrane. Once transported, glucose is oxidized to pyruvate. The subsequent fate of pyruvate is dependent on whether it is transported into the mitochondria or converted to ethanol (yeast) or lactate (mammals). Analogous to the competition between glucose transporters and cytochromes for space on the cytosolic membrane in prokaryotes, it is reasonable to argue that cytochromes compete with pyruvate transporter for space on the mitochondrial membrane in eukaryotes. We hypothesize that the outcome of this competition has a large role in controlling respiration and fermentation. Clearly, additional studies are required to determine whether the membrane economics theory alone is sufficient to explain the respiro-fermentation phenomenon in eukaryotes.
Concluding remarks
Although it has long been suggested that cellular evolution are governed by non-adjustable mechanistic constraints (Palsson, 2000; Papin et al, 2005; Novak et al, 2006), to date, most metabolic models rely on empirically derived parameters such as glucose and OUR. We showed that complex phenomena, such as the respiro-fermentation in bacteria, could be described by a simple mechanistic constraint on membrane enzyme occupancy. Furthermore, we showed that this simple morphological constraint dictates the regulation of E. coli's metabolism, thus establishing a direct link between cell morphology and physiology. Finally, we hypothesize that this mechanism might be a critical factor governing eukaryotic metabolism and the evolution of mitochondria. Further efforts to elucidate such fundamental cellular constraints as well as the underlying design principles could significantly improve our understanding of the regulation and evolution of metabolism.
Materials and methods
Membrane cost of metabolic reactions
The rate of a metabolic reaction (or flux) when the substrate is present in excess can be described by:
Here, vi is the rate of the ith metabolic reaction, kcat,i is the turnover rate of the enzyme catalyzing this reaction, and [Ei] is the concentration of this enzyme. From Equation (1), we can derive that the enzymatic concentration (Ei*) required for the ith reaction to achieve a rate of 1 mmol/gdw/h:
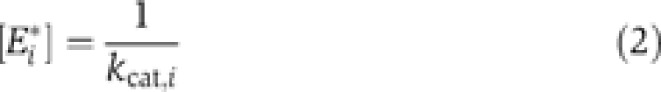 |
Many metabolic reactions are catalyzed by membrane-bound enzymes (e.g. transporters, cytochromes). For these reactions, we define the specific membrane area (surface area/biomass) required for a particular reaction to achieve the reaction rate of 1 mmol/gdw/h as the membrane cost of the reaction. This membrane cost is directly related to the membrane area consumed per enzyme (mi) and the turnover rate of the enzyme:
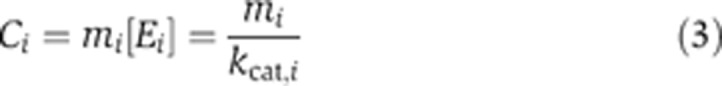 |
It has been found that the intracellular concentration of most metabolites is much higher than the Ks values of the enzymes (Bennett et al, 2009). Therefore, kcat,i for most membrane-bound enzymes vi can perhaps be assumed to be independent of the substrate concentrations. However, vi of cytochrome oxidases and glucose transporter are exceptions because oxygen and glucose are extracellular. For these enzymes, the apparent kcat,iapp can be related to the metabolite concentration using the following Michaelis–Menten expression:
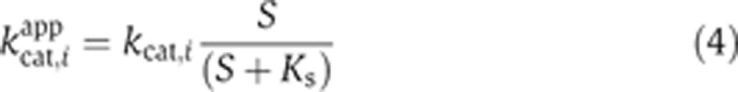 |
For the reactions catalyzed by these enzymes, Equation (3) becomes:
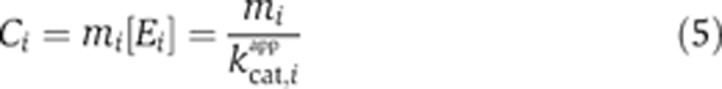 |
It follows from Equations 4 and 5 that for these reactions:
 |
Membrane economics for prokaryotes
For a given physiological state, the surface area to volume ratio (RS/V) and the intracellular density (D) of a prokaryotic cell remain relatively constant; the specific membrane area (Mcyt, area/gdw biomass) of the cytoplasmic membrane can be estimated by:
 |
To maintain membrane integrity, a large portion of the cytoplasmic membrane must be composed of lipids (Equation 6); therefore, only the remaining fraction (favailable) of the specific membrane area is available for the expression of membrane proteins. In other words, the total membrane cost incurred at the cytoplasmic membrane must be less than or equal to the cytoplasmic membrane budget (Bcyt):
 |
Where the cytoplasmic membrane budget (Bcyt) is given by:
While it is difficult to measure/determine the cytoplasmic membrane budget and the membrane cost of transmembrane enzymes, the relative membrane cost of these enzymes can be determined from growth physiology of knockout strains. The relative membrane cost is defined as the fraction of the specific membrane area required for a particular reaction to achieve the reaction rate of 1 mmol/gdw/h, this is mathematically described by:
 |
From Equations 5 and 7, we can derive relative form of the cytoplasmic membrane constraint, where only the relative membrane costs Ci* are unknown:
 |
Calculating the relative membrane costs in E. coli
As a simplification, our model assumes that only the expression of the glucose transporter and the three cytochromes (Cyo, Cyd-I, and Cyd-II) are constrained by the availability of the cytoplasmic membrane. The relative membrane costs of these enzymes were calculated from the growth data of various cytochrome-knockout strains. Because the membrane occupancy constraint is the only constraint where the cost parameters appears in our model, this constraint must be binding (viCi=1) for us to acquire unique cost parameters. During batch growth, cell's metabolism is not expected to be limited by the rate of glucose uptake as glucose concentrations are high. Under these conditions, the binding requirement (viCi=1) is automatically satisfied—since the membrane occupancy constraint is the only active/limiting constraint, and hence, must be binding. However, during glucose-limited chemostat growth, the metabolism of the cell can be limited by either the GUR or the membrane occupancy constraint. If metabolism of the cell is limited by GUR (e.g. under conditions where the glucose feed rate is very low), then the membrane may be unsaturated. Therefore, in order to satisfy this requirement, we have chosen data generated from experimental conditions where the membrane is likely to be saturated; in other words, we have implicitly assumed that the membrane occupancy constraint is binding throughout the parameter estimation process. The details of the parameter estimation process and more information on the membrane constraint binding requirement are in the Supplementary information.
The inferred relative cytoplasmic membrane costs under aerobic conditions are:
- C*GUR:
0.0556 gdw·h/mmol
- CCyo*:
0.0658 gdw·h/mmol
- CCyd-I*:
0.0427 gdw·h/mmol
- CCyd-II*:
0.0128 gdw·h/mmol
The FBAME model of E. coli can be found in the BioModels Database (accession number: MODEL1105030000) as well as the Supplementary information. The COBRA version can be accessed at http://www.labs.chem-eng.utoronto.ca/mahadevan/the-lab/downloads/.
Simulation of the aerobic growth of cytochrome-knockout strain
Portnoy et al (2008) has reported that an E. coli strain with Cyo, Cyd-I, and Cyd-II genes deleted is able to grow under aerobic conditions, with a GUR of 20 mmol/gdw/h and a growth rate of 0.42. They also found that under aerobic conditions, the expression of the PFL gene is half of the corresponding expression under anaerobic condition. Using FBAME, we simulated the growth of this knockout strain by shutting off the Cyo, Cyd-I, and Cyd-II reactions, and constraining the PFL flux to half of its predicted anaerobic value.
Supplementary Material
Supplementary Information, Supplementary Figures S1–6
Requires MATLAB and COBRA TOOLBOX
Generated using COBRA TOOLBOX and libSBML.
Acknowledgments
KZ and RM acknowledge support by the Office of Science (BER), US Department of Energy, Cooperative Agreement No. DE-FC02-02ER63446 and Grant No. DE-FG02-07ER64367, Genome Canada as well as Natural Sciences and Engineering Research Council of Canada, Ontario Ministry of Research and Innovation, Canada Foundation for Innovation and University of Toronto Open Fellowship. GNV acknowledges support from Carl Tryggers Foundation and Kristina Stenborg Foundation. We also thank Adam Feist, Vassily Portnoy, Bernhard Palsson, and the anonymous reviewers for their comments on the paper.
Author contributions: KZ designed the study and developed the membrane economics constraint, performed simulations, interpreted data, and wrote the paper; RM conceived of the study, interpreted the data, and wrote the paper; GV interpreted the data and wrote the paper. All authors read and approved the final manuscript.
Footnotes
The authors declare that they have no conflict of interest.
References
- Beg QK, Vazquez A, Ernst J, de Menezes M, Bar-Joseph Z, Barabási A, Oltvai ZN (2007) Intracellular crowding defines the mode and sequence of substrate uptake by Escherichia coli and constrains its metabolic activity. Proc Natl Acad Sci USA 104: 12663–12668 [DOI] [PMC free article] [PubMed] [Google Scholar]
- Begg KJ, Donachie WD (1985) Cell shape and division in Escherichia coli: experiments with shape and division mutants. J Bacteriol 163: 615–622 [DOI] [PMC free article] [PubMed] [Google Scholar]
- Bekker M, de Vries S, Ter Beek A, Hellingwerf KJ, de Mattos MJ (2009) Respiration of Escherichia coli can be fully uncoupled via the nonelectrogenic terminal cytochrome bd-II oxidase. J Bacteriol 191: 5510–5517 [DOI] [PMC free article] [PubMed] [Google Scholar]
- Bennett BD, Kimball EH, Gao M, Osterhout R, Van Dien S, Rabinowitz JD (2009) Absolute metabolite concentrations and implied enzyme active site occupancy in Escherichia coli. Nat Chem Biol 5: 593–599 [DOI] [PMC free article] [PubMed] [Google Scholar]
- Bicudo JE, Zerbinatti CV (1995) Physiological constraints in the aerobic performance of hummingbirds. Braz J Med Biol Res 28: 1139–1145 [PubMed] [Google Scholar]
- Cupp JR, McAlister-Henn L (1991) NAD(+)-dependent isocitrate dehydrogenase. Cloning, nucleotide sequence, and disruption of the IDH2 gene from Saccharomyces cerevisiae. J Biol Chem 266: 22199–22205 [PubMed] [Google Scholar]
- Edwards JS, Ibarra RU, Palsson BO (2001) In silico predictions of Escherichia coli metabolic capabilities are consistent with experimental data. Nat Biotechnol 19: 125–130 [DOI] [PubMed] [Google Scholar]
- Esteve-Nunez A, Rothermich M, Sharma M, Lovley D (2005) Growth of Geobacter sulfurreducens under nutrient-limiting conditions in continuous culture. Environ Microbiol 7: 641–648 [DOI] [PubMed] [Google Scholar]
- Feist AM, Henry CS, Reed JL, Krummenacker M, Joyce AR, Karp PD, Broadbelt LJ, Hatzimanikatis V, Palsson BO (2007) A genome-scale metabolic reconstruction for Escherichia coli K-12 MG1655 that accounts for 1260 ORFs and thermodynamic information. Mol Syst Biol 3: 121. [DOI] [PMC free article] [PubMed] [Google Scholar]
- Govantes F, Orjalo AV, Gunsalus RP (2000) Interplay between three global regulatory proteins mediates oxygen regulation of the Escherichia coli cytochrome d oxidase (cydAB) operon. Mol Microbiol 38: 1061–1073 [DOI] [PubMed] [Google Scholar]
- Jayachandran G, Gorisch H, Adrian L (2004) Studies on hydrogenase activity and chlorobenzene respiration in Dehalococcoides sp. strain CBDB1. Arch Microbiol 182: 498–504 [DOI] [PubMed] [Google Scholar]
- Lange R, Hengge-Aronis R (1991) Growth phase-regulated expression of bolA and morphology of stationary-phase Escherichia coli cells are controlled by the novel sigma factor sigma S. J Bacteriol 173: 4474–4481 [DOI] [PMC free article] [PubMed] [Google Scholar]
- MacLean RC (2008) The tragedy of the commons in microbial populations: insights from theoretical, comparative and experimental studies. Heredity 100: 471–477 [PubMed] [Google Scholar]
- Majewski RA, Domach MM (1990) Simple constrained-optimization view of acetate overflow in E. coli. Biotechnol Bioeng 35: 732–738 [DOI] [PubMed] [Google Scholar]
- Meyer DJ, Jones CW (1973) Oxidative phosphorylation in bacteria which contain different cytochrome oxidases. Eur J Biochem 36: 144–151 [DOI] [PubMed] [Google Scholar]
- Molenaar D, van Berlo R, de Ridder D, Teusink B (2009) Shifts in growth strategies reflect tradeoffs in cellular economics. Mol Syst Biol 5: 323. [DOI] [PMC free article] [PubMed] [Google Scholar]
- Nikel P, Zhu J, San K, Mendez BS, Bennet GN (2009) Metabolic flux analysis of Escherichia coli creB and arcA mutants reveals shared control of carbon catabolism under microaerobic growth conditions. J Bacteriol 191: 5538–5548 [DOI] [PMC free article] [PubMed] [Google Scholar]
- Novak M, Pfeiffer T, Lenski RE, Sauer U, Bonhoeffer S (2006) Experimental tests for an evolutionary trade-off between growth rate and yield in E. coli. Am Nat 168: 242–251 [DOI] [PubMed] [Google Scholar]
- Palsson B (2000) The challenges of in silico biology. Nat Biotechnol 18: 1147–1150 [DOI] [PubMed] [Google Scholar]
- Papin JA, Hunter T, Palsson BO, Subramaniam S (2005) Reconstruction of cellular signalling networks and analysis of their properties. Nat Rev Mol Cell Biol 6: 99–111 [DOI] [PubMed] [Google Scholar]
- Pfeiffer T, Bonhoeffer S (2002) Evolutionary consequences of tradeoffs between yield and rate of ATP production. Z Phys Chem 216: 51–63 [Google Scholar]
- Pfeiffer T, Bonhoeffer S (2004) Evolution of cross—feeding in microbial populations. Am Nat 163: E126–E136 [DOI] [PubMed] [Google Scholar]
- Pfeiffer T, Schuster S, Bonhoeffer S (2001) Cooperation and competition in the evolution of ATP-producing pathways. Science 292: 504–507 [DOI] [PubMed] [Google Scholar]
- Phillips R, Milo R (2009) A feeling for the numbers in biology. PNAS 106: 21465–21471 [DOI] [PMC free article] [PubMed] [Google Scholar]
- Portnoy VA, Herrgård M, Palsson B (2008) Aerobic fermentation of D-glucose by an evolved cytochrome oxidase-deficient Escherichia coli strain. Appl Environ Microbiol 74: 7561–7569 [DOI] [PMC free article] [PubMed] [Google Scholar]
- Puustinen A, Finel M, Haltia T, Gennis RB, Wikstrom M (1991) Properties of the two terminal oxidases of Escherichia coli. Biochemistry 30: 3936–3942 [DOI] [PubMed] [Google Scholar]
- Repetto B, Tzagoloff A (1991) In vivo assembly of yeast mitochondrial alpha-ketoglutarate dehydrogenase complex. Mol Cell Biol 11: 3931–3939 [DOI] [PMC free article] [PubMed] [Google Scholar]
- Risso C, Sun J, Zhuang K, Mahadevan R, DeBoy R, Ismail W, Shrivastava S, Huot H, Kothari S, Daugherty S, Bui O, Schilling CH, Lovley DR, Methe BA (2009) Genome-scale comparison and constraint-based metabolic reconstruction of the facultative anaerobic Fe(III)-reducer Rhodoferax ferrireducens. BMC Genomics 10: 447. [DOI] [PMC free article] [PubMed] [Google Scholar]
- Schuster S, Pfeiffer T, Fell DA (2008) Is maximization of molar yield in metabolic networks favoured by evolution? J Theor Biol 252: 497–504 [DOI] [PubMed] [Google Scholar]
- Sonenshein AL (2007) Control of key metabolic intersections in Bacillus subtilis. Nat Rev Microbiol 5: 917–927 [DOI] [PubMed] [Google Scholar]
- Sonnleitner B, Kappeli O (1986) Growth of Saccharomyces cerevisiae is controlled by its limited respiratory capacity: formulation and verification of a hypothesis. Biotechnol Bioeng 28: 927–937 [DOI] [PubMed] [Google Scholar]
- Tseng CP, Albrecht J, Gunsalus RP (1996) Effect of microaerophilic cell growth conditions on expression of the aerobic (cyoABCDE and cydAB) and anaerobic (narGHJI, frdABCD, and dmsABC) respiratory pathway genes in Escherichia coli. J Bacteriol 178: 1094–1098 [DOI] [PMC free article] [PubMed] [Google Scholar]
- Vander Heiden MG, Cantley LC, Thompson CB (2009) Understanding the Warburg effect: the metabolic requirements of cell proliferation. Science 324: 1029–1033 [DOI] [PMC free article] [PubMed] [Google Scholar]
- Varma A, Palsson BO (1994) Stoichiometric flux balance models quantitatively predict growth and metabolic by-product secretion in wild-type Escherichia coli W3110. Appl Environ Microbiol 60: 3724–3731 [DOI] [PMC free article] [PubMed] [Google Scholar]
- Vazquez A, Beg QK, Demenezes MA, Ernst J, Bar-Joseph Z, Barabasi AL, Boros LG, Oltvai ZN (2008) Impact of the solvent capacity constraint on E. coli metabolism. BMC Syst Biol 2: 7. [DOI] [PMC free article] [PubMed] [Google Scholar]
- Veit A, Polen T, Wendisch VF (2007) Global gene expression analysis of glucose overflow metabolism in Escherichia coli and reduction of aerobic acetate formation. Appl Microbiol Biotechnol 74: 406–421 [DOI] [PubMed] [Google Scholar]
- Vemuri GN, Altman E, Sangurdekar DP, Khodursky AB, Eiteman MA (2006) Overflow metabolism in Escherichia coli during steady-state growth: transcriptional regulation and effect of the redox ratio. Appl Environ Microbiol 72: 3653–3661 [DOI] [PMC free article] [PubMed] [Google Scholar]
- Vemuri GN, Eiteman MA, McEwen JE, Olsson L, Nielsen J (2007) Increasing NADH oxidation reduces overflow metabolism in Saccharomyces cerevisiae. Proc Natl Acad Sci USA 104: 2402–2407 [DOI] [PMC free article] [PubMed] [Google Scholar]
- Waddell TG, Repovic P, Meléndez-Hevia E, Heinrich R, Montero F (1997) Optimization of glycolysis: a new look at the efficiency of energy coupling. Biochem Educ 25: 204–205 [Google Scholar]
- Wagner S, Baars L, Ytterberg AJ, Klussmeier A, Wagner CS, Nord O, Nygren PA, van Wijk K, de Gier J (2007) Consequences of membrane protein overexpression in Escherichia coli. Mol Cell Proteomics 6: 1527–1550 [DOI] [PubMed] [Google Scholar]
- Visser W, Spronsen E, Nanninga N, Pronk J, Kuenen JG, Dijken JP (1995) Effects of growth conditions on mitochondrial morphology in Saccharomyces cerevisiae. Antonie van Leeuwenhoek 67: 243–253 [DOI] [PubMed] [Google Scholar]
- Zhuang K, Izallalen M, Mouser P, Richter H, Risso C, Mahadevan R, Lovley DR (2011) Genome-scale dynamic modeling of the competition between Rhodoferax and Geobacter in anoxic subsurface environments. ISME J 5: 305–316 [DOI] [PMC free article] [PubMed] [Google Scholar]
Associated Data
This section collects any data citations, data availability statements, or supplementary materials included in this article.
Supplementary Materials
Supplementary Information, Supplementary Figures S1–6
Requires MATLAB and COBRA TOOLBOX
Generated using COBRA TOOLBOX and libSBML.