

Abstract
The transcriptome and proteome change dynamically as cells respond to environmental stress; however, prior proteomic studies reported poor correlation between mRNA and protein, rendering their relationships unclear. To address this, we combined high mass accuracy mass spectrometry with isobaric tagging to quantify dynamic changes in ∼2500 Saccharomyces cerevisiae proteins, in biological triplicate and with paired mRNA samples, as cells acclimated to high osmolarity. Surprisingly, while transcript induction correlated extremely well with protein increase, transcript reduction produced little to no change in the corresponding proteins. We constructed a mathematical model of dynamic protein changes and propose that the lack of protein reduction is explained by cell-division arrest, while transcript reduction supports redistribution of translational machinery. Furthermore, the transient ‘burst’ of mRNA induction after stress serves to accelerate change in the corresponding protein levels. We identified several classes of post-transcriptional regulation, but show that most of the variance in protein changes is explained by mRNA. Our results present a picture of the coordinated physiological responses at the levels of mRNA, protein, protein-synthetic capacity, and cellular growth.
Keywords: dynamics, modeling, proteomics, stress, transcriptomics
Introduction
Yeast cells remodel a large fraction of their transcriptome to acclimate to the new conditions following environmental shock. Such stressful conditions trigger a common expression program called the environmental stress response (ESR), which includes increased expression of stress-defense genes and reduced expression of protein-synthesis and growth-related messages (Gasch et al, 2000; Causton et al, 2001) that are synthesized at high levels during active growth (Lipson et al, 2009). Increased abundance of stress-defense genes is important for surviving subsequent stressful insults (Berry and Gasch, 2008), while the role of transcript reduction in the ESR is less clear. It has been observed that the abundance of stress-reduced transcripts correlates with growth rate under some (Jorgensen et al, 2002, 2004; Regenberg et al, 2006; Brauer et al, 2008) but not all (Gasch et al, 2000, 2001) conditions, leading to the hypothesis that transcript reduction contributes to resource conservation during stress defense. However, the precise function of mRNA reduction during environmental transition remains enigmatic.
Stress responses have been extensively studied at the transcript level because mRNA measurement is robust and broadly accessible, while protein analysis is considerably less well developed. This technology gap has prompted the assumption that changing transcripts mediate proportional protein alterations; however, most recent proteomic studies report poor correlation. For example, many studies comparing absolute abundance (Gygi et al, 1999; Ideker et al, 2001a; Ghaemmaghami et al, 2003; Greenbaum et al, 2003; Washburn et al, 2003) or abundance changes (Ideker et al, 2001a; Griffin et al, 2002; Li et al, 2003; Washburn et al, 2003; de Godoy et al, 2008; Soufi et al, 2009; Fournier et al, 2010) of protein versus mRNA reported only modest correlation between the two. Several smaller investigations cited higher agreement (R2∼0.7), but these were limited to a few hundred mRNA–protein pairs (Futcher et al, 1999; Lu et al, 2007). Many of these studies did not collect mRNA from the same cells from which proteins were measured, and all but a few (Li et al, 2003; Picotti et al, 2009; Soufi et al, 2009; Fournier et al, 2010) neglected temporal changes or did not perform biological replicates. Hence, the true relationship between mRNA and protein levels remains an open question.
To understand the dynamic relationship between transcript and protein, we developed a strategy for large-scale, multiplexed quantitation by way of isobaric tags and high mass accuracy mass spectrometry (<5 p.p.m.) (Figure 1A). This platform allowed for the expedient collection of time-course data (response to 0.7 M sodium chloride (NaCl) at six time points over 4 h) at the protein level (two technical replicates of each biological sample in ∼5 days instrument analysis). In contrast to metabolic labeling approaches (Jiang and English, 2002; Ong et al, 2002), which permit up to three-way sample comparisons and require specific growth conditions, this multiplexed method enables practical acquisition of biological data over many samples and in any conditions. Here, we reveal the quantitative and temporal relationships between changes in mRNA and protein levels in cells acclimating to a sudden change in osmolarity.
Figure 1.

Experimental workflow and mass spectrometry identification summary. (A) Yeast cells were grown to mid-log phase and exposed to 0.7 M NaCl; culture volumes were removed at 30, 60, 90, 120, and 240 min after stress, as well as from unstressed cells (0 min), for microarray and quantitative MS proteomic analysis. Each proteomic sample was lysed, followed by protein extraction and enzyme digestion. Peptides were labeled with isobaric TMT and mixed in equal rations. The labeled mix was then subjected to an orthogonal first-dimension separation: SCX. Fractions were subsequently analyzed on an LTQ Orbitrap Velos mass spectrometer coupled with nano-RP HPLC. Biological replicates were performed in triplicate. Spectra were analyzed with in-house developed software. (B) Peptide and protein identifications across the three biological replicates (BR) are outlined in the above table with the overlap depicted in the Venn diagrams. Of the protein identifications, 60% overlap was observed across all biological replicates. On average, 81.5% of all identifications were quantifiable with an overlap of 55% across all biological replicates. Numbers in each colored circle represent the correspondingly colored sector in the Venn diagrams.
Results
We followed the response of actively growing Saccharomyces cerevisiae to an osmotic shock of 0.7 M NaCl. This dose of salt provides a robust physiological response but results in high viability and eventual resumption of cell growth. Samples were collected before and at 30, 60, 90, 120, and 240 min after NaCl treatment (measuring the peak transcript changes that occurs at or after 30 min (Berry and Gasch, 2008)), in biological triplicate time courses that captured cells acclimated to both environments and their transition between states. After lysing cells harvested from each time point, we digested the proteins with trypsin, generating peptides to be labeled with one of the six isobaric tags. Tagged samples were then pooled and fractionated via strong-cation exchange (SCX) for LC–MS/MS analysis on an LTQ Orbitrap Velos mass spectrometer (Figure 1). Performing our experiment in biological triplicate generated a total of 454 755 peptide–spectral matches (PSMs), 35 828 unique peptides, and 2965 proteins (1% false discovery rate (FDR); see Materials and methods). We wrote custom software, TagQuant (Wenger et al, 2011), to extract reporter ion intensities and exclude tandem mass spectra containing interference resulting from cofragmentation of multiple precursors. Removal of precursors having ⩾25% interference greatly improved quantitative accuracy, precision, and dynamic range. To obtain maximal noise reduction across all time courses and biological replicates, we used PSMs of unambiguous provenance and required at least two unique peptides per protein. This approach is much more conservative than most proteomic analyses but provides maximal accuracy in peptide quantitation. Following this conservative analysis, we confidently measured the relative abundances of 35 000 unique peptides mapping to 2451 proteins with 60% overlap across biological replicates (Figure 1B). Of the 1814 proteins quantified in at least biological duplicate, 780 (43%) showed statistically significant changes in abundance (5% FDR, modified t-test (Storey and Tibshirani, 2003; Smyth, 2004)). Quantitative western blotting validated these large-scale results for several selected proteins (Supplementary Figure S1).
Relationships between changing mRNA and proteins
We next generated time-course transcriptome data from the same biological samples and compared maximal changes in mRNA with changes in corresponding protein abundance during NaCl acclimation (Figure 2). For transcripts that increase in abundance, the log–log linear correlation between mRNA change and protein change was significantly higher than previously reported (R2=0.77), indicating that on a global scale nearly 80% of the variance in changing protein abundance is explained by increases in mRNA (Figure 2B and C). Variation in this correlation revealed that some groups of functionally related genes showed even higher agreement while others were unrelated (Supplementary Figure S2; Supplementary Table S1). This result expands on previous studies demonstrating that the correlation between mRNA and protein abundance varies by gene functional group (Washburn et al, 2003). Many of the proteins with the largest changes in abundance function in processes known to be important for NaCl survival, including glycerol and trehalose metabolism and stress defense (Supplementary Figure S3).
Figure 2.

Correlation between mRNA and protein changes. (A) The average log2 changes in mRNA (left) and protein (right) are shown for each gene, represented as rows, and time point shown as columns within each time course (triangles). Red and green colors indicate increased and decreased abundance, respectively, according to the key. The figure shows all transcripts whose change was statistically significant (FDR <0.05) and whose corresponding proteins were measured in triplicate, amounting to 408 transcripts that increased and 702 transcripts that decreased in abundance. (B) Regression of the maximum average log2 changes in mRNA and protein for transcript–protein pairs shown in (A), where red indicates increased and green represents reduced transcripts. (C) R2-values (shaded according to the key in the center) were calculated as in (B) except that they compared mRNA with protein at each denoted time point for increased (left) and reduced (right) transcripts. Comparisons with the highest correlations are highlighted with asterisks. (D) Average log2 change over time for all mRNAs (solid lines) and corresponding proteins (dashed lines).
In stark contrast to the high correlation between protein abundance and increased mRNAs, the poor correlation between protein changes and transcripts that decrease in abundance (R2=0.09; Figure 2B and C) reflects the overall lack of protein reduction over time. Although the decreased abundance of some proteins was statistically significant, the magnitude of change was far less than that of the mRNA (e.g. ∼1.1-fold reduction of ribosomal proteins (RPs) compared with 1.5- to 2-fold reduction of transcripts). Quantitative western blotting validated the lack of protein reduction (Supplementary Figure S1), and furthermore the proteomic results did not suffer from technical inability to measure protein reduction (Supplementary Figure S4). Importantly, the observation was true irrespective of protein abundance or half-life as measured under standard conditions (Supplementary Figure S5). The lack of reduction over this time frame is predicted for long-lived proteins; however, this was not expected for the many proteins with short half-lives (Belle et al, 2006). While the measured changes in mRNA abundance may be influenced by untranslated mRNAs, prior evidence suggests that the majority of most transcripts are associated with ribosomes (Arava et al, 2003), indicating that our measurements largely reflect the translated pool of mRNAs in the cell. Regardless, we conclude that the NaCl-activated reduction in transcript abundance serves another role besides mediating changes in protein abundance.
Dynamic modeling suggests alternate roles of transcript reduction
We devised a mass-action kinetic model to describe dynamic protein changes, in which protein abundance is a function of new synthesis and of disappearance through degradation and cell division. To calculate translation rates for each protein, we used global measurements of basal protein abundances and protein half-lives as reported by Ghaemmaghami et al (2003) and Belle et al (2006), respectively, along with our own measurements of mRNA and growth rate changes (see Materials and methods). Using this model, we predicted changes in protein abundance based on observed changes in mRNA levels. The model's successful performance in both training and test data sets (Supplementary Appendix) allowed us to use it to test various hypotheses through simulations.
Since cell growth was arrested for ∼45 min after NaCl addition before resuming at roughly half the initial rate (Supplementary Figure S6), we first used the model to test the effect of cell-division arrest. The model suggested that the transient growth arrest maintained protein levels despite transcript reduction. As expected, when the model assumed a constant growth rate, it predicted an ∼1.5-fold decrease for virtually all proteins from reduced transcripts (Figure 3, blue trace).
Figure 3.

Distribution of protein levels predicted from model simulations. Distribution of the minimum log2 change over time (i.e. greatest log2 reduction) for transcripts (red) that decreased in abundance, corresponding protein changes as measured (orange) or calculated using the original model (green), corresponding protein changes calculated under the assumption of a constant growth rate (blue), and protein changes calculated with the original model but predicted from mRNAs simulated without reduction during the time course (purple). Analysis is for 579 triplicated mRNA–protein pairs from the training set for which mRNA was reduced with statistical significance (FDR<0.05).
We next tested the consequences of transcript reduction. We reasoned that, if reduced transcript abundance is critical for reducing synthesis of these proteins, then simulating transcripts without a decrease in abundance would lead to increased protein levels during growth arrest. Surprisingly, however, the model predicted little increase in protein abundance in the absence of transcript reduction; most proteins were calculated with only ∼1.2-fold weaker reduction than that predicted from measured mRNA levels (Figure 3, purple trace). Indeed, polysome analysis showed that the maximal reduction in translation initiation (represented by the increase in monosome versus polysome complexes) peaked at 5 min after NaCl exposure (Figure 4A), whereas transcript reduction did not occur until 30 min after treatment. These results strongly suggest that the translational repression, well known to occur during the NaCl response (Uesono and Toh, 2002; Melamed et al, 2008; Warringer et al, 2010), is independent of transcript reduction and is counteracted by transient cell-division arrest, such that corresponding protein levels do not change appreciably.
Figure 4.

Translational profiles in wild-type and dot6Δtod6Δ cells responding to NaCl. Polysome profiles were measured as described in Materials and methods for (A) wild-type cells and (B) a mutant lacking the Dot6p/Tod6p transcriptional repressors. Absorbance at 260 nm across collected fractions is shown at 0, 5, 30, 45, and 90 min after NaCl treatment, relative to the starting baseline; 40S, 60S, and 80S monosome (M), and polysome (P) peaks are indicated. The monosome/polysome (M/P) ratio was calculated based on the trapezoidal area under the curve. Relative abundance of (C) ARX1 or (D) HSP104 transcript in polysome fractions was measured in wild-type (left) and dot6Δtod6Δ cells (right) before and at 30 min after NaCl treatment. Relative mRNA abundance was measured compared with a doped control mRNA and normalized to baseline abundance measured in the trough between the 2 and 3 polysome peaks (see Materials and methods). Plots are representative of biological duplicates.
Although the reduced levels of these transcripts did not influence abundance of the encoded proteins, it may be critical for proper protein levels in the cellular system if translational capacity is limited. To explore this, we characterized the aspects of the NaCl response in a mutant lacking the transcriptional repressors Dot6p and Tod6p (Lippman and Broach, 2009; Zhu et al, 2009). In the absence of stress, the dot6Δtod6Δ mutant grew indistinguishably from wild-type cells (Supplementary Figure S6C) and displayed similar polysome profiles (Figure 4B). However, in response to NaCl treatment, the mutant failed to properly repress ∼250 genes in the yeast ESR (Supplementary Dataset S3). Over 90% of these genes (P=10−66, hypergeometric distribution) contain upstream Dot6p/Tod6p binding elements (GATGAG; Hughes et al, 2008; Zhu et al, 2009), consistent with direct repression by the proteins. The mutant also resumed growth at a slower rate after NaCl treatment (Supplementary Figure S6C), and showed delayed resumption of normal translation profiles (Figure 4B), indicating a specific defect in acclimating to the stress.
We followed the polysome association of transcripts encoded by Dot6pTod6p targets, focusing on ARX1 (Figure 4). In unstressed wild-type cells, ARX1 transcript was associated with polysomes, as expected (Arava et al, 2003). We observed an ∼7-fold reduction in ARX1 levels 30 min after NaCl treatment—most of the remaining transcript was found in the monosome peak, suggesting reduced or stalled translation initiation. In contrast, the mutant showed only a 2-fold reduction in ARX1 levels at 30 min after shock. As in wild-type cells, there was a substantial increase in monosome-bound ARX1 mRNA after NaCl exposure, reflecting regulated translation initiation. Surprisingly, however, a large fraction of the remaining mRNA was associated with polysomes at 30 min. We obtained virtually the same result for another Dot6p/Tod6p target, NOP2, which also showed a repression defect in the mutant (data not shown). In contrast, polysome profiles were indistinguishable at induced transcript HSP104 (Figure 4D), although our analysis would miss subtle differences. Unfortunately, we were unable to quantify changes in the corresponding proteins using several available antibodies. Nonetheless, these results show that, although the mutant dramatically reduced global translation initiation immediately after stress, failure to repress high-abundance transcripts led to their continued polysome association as translation was resuming.
mRNA dynamics affect protein acclimation time
Seventy-four percent of transcripts with increased abundance after NaCl treatment showed a transient ‘burst’ of change before acclimating to final levels (Figures 2D and 5A), consistent with prior studies (Gasch et al, 2000). The majority peaked at 30 min, coincident with the maximal reduction in reduced transcripts. In contrast, only 15% of proteins showed transient change, while most gradually adjusted to final levels. As expected, there was a delay between mRNA changes and protein adjustments; however, we observed a wide range of protein acclimation times, even for those encoded by transcripts peaking at 30 min.
Figure 5.

Transient mRNA changes produce faster protein changes. (A) Representative changes in mRNA (solid) and protein (dashed) for two pairs with and without transient mRNA induction. (B) In all, 127 transcripts whose increase in abundance peaked at 30 min were binned based on the magnitude of transient burst (see Materials and methods). The percentage with the indicated acclimation times is shown by quartile. (C) Average log2 change of measured mRNA, simulated mRNA without the transient burst, and corresponding calculations of protein change, for GPD1. (D) Percentage of proteins shown in (B) with different acclimation times, for proteins measured (‘M’) or calculated (‘C’) from original or simulated (‘S’) mRNAs.
We found that the degree of transient mRNA induction largely determines the time to protein acclimation. Transcripts with the greatest ‘overshoot,’ compared with their final, steady-state level, produced proteins that acclimated quicker than average (P=8.5 × 10⁻⁷ for top quartile, t-test), whereas transcripts without the transient burst led to delayed protein acclimation (P=2 × 10⁻³ for bottom quartile; Figure 5A and B). Our mathematical model confirmed these results—simulated transcripts lacking the transient induction burst produced slower protein changes (Figure 5C) that were predicted to acclimate 53 min later on average than proteins from transiently altered mRNAs (Figure 5D). This confirms our original hypothesis (Gasch et al, 2000) that gene expression dynamics follow a second-order process in which the transient burst serves as a ‘loading dose’ to accelerate protein change before mRNA adjusts to ‘maintenance’ levels at the new growth state. Transcripts with the largest transient increase were enriched for those in the yeast ESR (P=6 × 10⁻⁸); however, we found no relationship between the degree of transience and the importance of the protein for NaCl survival (see Supplementary Figure S3).
Pervasive post-transcriptional regulation
We next sought to define the impact of post-transcriptional regulation (PTR). We identified five distinct protein classes, together implicating >40% the proteome as affected by PTR (Supplementary Table S2). The first class contained 85 proteins (11% of 791 significantly altered proteins) whose abundance changed in the absence of significant mRNA changes. Another 70 (9%) changed in the opposite direction of their mRNAs—this group was enriched for protein folding chaperones (FDR=0.035), which are known to be regulated at the level of mRNA export (Saavedra et al, 1996). A further 34 proteins changed with greater magnitude than their underlying mRNAs in at least two replicate time courses, unlike most other proteins whose abundance change was well below the mRNA change. This group was enriched for transcripts that are translationally upregulated in response to stress (P=0.016) (Law et al, 2005; Melamed et al, 2008; Halbeisen and Gerber, 2009) and includes several genes encoding signaling proteins.
Capitalizing on biological replicate analysis and the precision of our measurements, we identified a fourth mode of regulation—post-transcriptional noise reduction that buffered protein change against variation in mRNA levels (Figure 6A and B). We identified 138 proteins (24%) whose biological variability was below the corresponding mRNAs (95th confidence level, see Materials and methods). These were heavily enriched for several functional categories, including stress-defense proteins, translation factors, and RPs (Supplementary Table S3). Indeed, several RPs are regulated through protein degradation in proportion to subunit stoichiometry (Warner et al, 1985; Tsay et al, 1988), a mode that likely extends to most if not all RPs. Newman et al (2006) previously showed that RPs and translational regulators display low cell-to-cell variation within actively growing yeast cultures, likely due to PTR rather than tight transcriptional control. In contrast to that study, which found high within-culture ‘noise’ for stress-defense proteins, our results reveal that these proteins are targeted for noise reduction under the stressful conditions used here (P=4 × 10⁻⁵, hypergeometric distribution). Thus, the level of ‘noise’ in protein abundance is condition specific. Our conservative estimates indicate that post-transcriptional noise reduction affects at least a quarter of yeast proteins. The prevalence of this mode of regulation raises major implications for gene expression studies, as it may dampen the effects of transcript variation observed within and across individuals.
Figure 6.

Influence of PTR. (A, B) Average log2 changes in each replicate time course for 77 transcripts with increased (red) and 61 transcripts with decreased (green) abundance (A) and corresponding proteins (B) subject to noise reduction. (C) Fraction of variation in protein change explained by mRNA change for significantly changing proteins without mRNA changes, with opposing mRNA changes, with changes greater than mRNA, with noise reduction, and in the GO ‘stress response’ category as example of very high correlation.
Discussion
Our results highlight the importance of quantitative, dynamic, and replicated measurements in understanding the true relationship between changing mRNA and protein. The high mass accuracy mass spectrometry used here in combination with isobaric tags allowed us to make a number of observations: (1) The magnitude of transcript induction is significantly more predictive of changes in protein level than previously thought, at least during the response to NaCl. (2) Transcript reduction did not reduce levels of the corresponding proteins; this result has not been reported before and the breadth of the effect came as a surprise. (3) The temporal relationship between transcript and protein changes is not linear but rather determined by a more complicated function. (4) There is evidence for pervasive PTR, even though the magnitude of that PTR is small. The biological implications of these observations are discussed below.
The correlation between increased transcripts and their encoded proteins during NaCl acclimation is significantly higher than previously measured, due not only to increased measurement precision but also to dynamic considerations that allowed comparison of the appropriate time points. The high protein–mRNA correlation for increased transcripts confirms that the purpose of transcript elevation is to modulate protein abundance. Although we find evidence for pervasive PTR, most of the variance in observed protein increase remains explained by mRNA changes (Figure 6C). Notably, however, nearly 20% of all changing proteins do not correlate with underlying mRNA changes. Thus, while increases in mRNA are a good predictor of protein change under the conditions studied here, the absence of mRNA induction is not necessarily conclusive.
In stark contrast, transcript reduction did not alter protein levels under these conditions. This result has not been widely reported previously, although analysis of available data sets generally shows fewer and smaller changes in reduced proteins compared with those increasing in abundance, across several different environmental comparisons (Blomberg, 1995; Ideker et al, 2001b; Griffin et al, 2002; Li et al, 2003; Washburn et al, 2003; Picotti et al, 2009; Soufi et al, 2009; Fournier et al, 2010). However, Fournier et al (2010) observed a decrease in RPs after rapamycin treatment that was significantly delayed (∼6 h) compared with the reduction in RP transcripts. In that case, the late protein decrease may be due to ribosome consumption through ribophagy (Kraft et al, 2008), rather than translational repression. The lack of RP reduction soon after rapamycin-dependent transcript reduction is therefore consistent with our results, and suggests that the lack of correlation between transcript reduction and protein abundance may be common to other stress conditions. This raises major implications for the interpretation of transcriptomic data, since reduced mRNA abundance is often used to infer protein reduction and dispensability.
Reduced levels of abundant transcripts, particularly those affecting ribosome biogenesis, has been proposed to reduce the costly synthesis of encoded proteins in proportion to growth demand (Waldron and Lacroute, 1975; Kief and Warner, 1981; Nomura, 1999; Jorgensen et al, 2002, 2004; Rudra and Warner, 2004; Regenberg et al, 2006; Brauer et al, 2008). Indeed, our mathematical modeling revealed that changes in growth rate explain the lack of protein change, not just for long-lived RPs but for all proteins from reduced transcripts. However, our results strongly suggest that transcript reduction is not the driving force behind decreased protein synthesis. Reduced translation initiation (inferred from the increased monosome:polysome ratio) occurs much before transcripts drop in abundance (Figure 4B; Uesono and Toh, 2002). We also observed that final levels of most RP transcripts were at or above unstressed levels, even though division occurred at half the initial rate. This observation underscores the discordance between RP transcript abundance and growth rate during osmotic stress.
Instead, the reduced abundance of these transcripts may serve to redirect translational capacity to newly made mRNAs. The timing of transcript reduction occurs when translation profiles begin to recover as cells resume growth and coincides with maximal levels of increasing transcripts. The temporal relationship between increasing and decreasing transcripts holds across many environmental shocks, even though the kinetics of transcript change is not well correlated with the duration of cell-division arrest during these transitions (Gasch et al, 2000, 2001). We suggest that the coordination of transcript reduction with transcript induction avoids competition for translational machinery, simply through the temporary removal of high-abundance transcripts when translation is resuming.
In this model, cells may be limited for translation factors, particularly initiation factors that regulate translation in response to stress (Proud, 2007; Gandin et al, 2008; Park et al, 2011), but another possibility is competition for translating ribosomes. Nearly 90% of ribosomes in growing cells are actively translating proteins (Warner, 1999; Arava et al, 2003; von der Haar, 2008), leaving little capacity to synthesize new proteins during adversity. Under this scenario, the level of transcript reduction might be tuned to ribosome demand at increased mRNAs. A simple calculation (Figure 7) based on the number of ribosome per cellular transcript (Arava et al, 2003), transcript counts per cell (Lipson et al, 2009), and our own measurements of mRNA fold-change suggests that at 30 min after NaCl treatment, the fraction of ribosomes available solely due to transcript reduction (24±5% of translating ribosomes) is approximately the estimated maximum needed to translate the increased transcripts (32±6% translating ribosomes). Although our estimate does not capture known translational regulation at specific transcripts (Uesono and Toh, 2002; Law et al, 2005; Melamed et al, 2008; Halbeisen and Gerber, 2009; Warringer et al, 2010), it supports the hypothesis that transient transcript reduction is linked to translational capacity. Our polysome analysis is consistent with this model, since failure to repress transcripts in the dot6Δtod6Δ mutant led to continued polysome association of aberrantly abundant mRNAs. These results support a recent theoretical study by Scott et al (2010), suggesting that the relationship between continuous growth rate and nutrient quality in Escherichia coli is due to ribosome allocation.
Figure 7.
Estimated fraction of translating ribosomes made available due to transcript reduction. The fraction of 171 000 translating ribosomes before stress that becomes available due solely to transcript reduction (blue bars) was estimated as described in Materials and methods. The estimated maximum fraction of those ribosomes needed to translate new transcripts at each time point (gray bars) was based on the increase in mRNA abundance at that time and assumed 100% ribosome loading to pre-stress levels at each time point. Each bar represents the average and s.d. over the three biological replicates of measured mRNA abundance changes. Source data is available for this figure at www.nature.com/msb.

Our model is also consistent with the observed dynamics of gene expression change. Through direct observations and mathematical modeling, we demonstrate that the transient burst in transcript abundance serves to accelerate protein change. It is likely not a coincidence that this response peaks as resuming translational machinery is available to new transcripts. The mRNA response follows a second-order dynamic system, resulting in a pulse of gene expression change before cells acclimate. This pulse is likely due in part to the interplay between transient alterations in transcription and mRNA stability during stress response and acclimation (Garcia-Martinez et al, 2007; Shalem et al, 2008; Molin et al, 2009). In addition, feed-forward signaling loops can also produce pulse-like responses (Mangan and Alon, 2003; Alon, 2007; Kaplan et al, 2008), and such signaling motifs likely contribute here as well (Gasch, 2002a). The outcome of transient transcript changes is rapid alteration in protein changes, with larger mRNA pulses producing faster protein acclimation. More broadly, the complex relationships between these processes highlight the importance of considering dynamic observations in the study of living systems.
Materials and methods
Cell growth and RNA preparation
Strain BY4741 was grown >7 generations to an optical density (OD600) ∼0.3 at 30°C in YPD medium. A sample of unstressed cells was removed as the ‘time 0’ reference and pre-warmed medium was added for a final concentration of 0.7 M NaCl. Samples were removed at 30, 60, 90, 120, and 240 min after addition of NaCl (the culture was diluted 1:1 with fresh medium after the 120-min collection to maintain log-phase growth). The majority of transcript changes peak at or after 30 min (Berry and Gasch, 2008; data not shown). At each time point, one sample was recovered for microarray analysis and another was recovered for proteomic analysis by 3 min room temperature spin at 3500 r.p.m. after which time the cells were flash frozen in liquid nitrogen and maintained at −80°C until use.
The dot6Δtod6Δ mutant was constructed by replacing TOD6 with the hygromycin-MX cassette in the BY4741-dot6Δ∷KANMX strain (Open Biosytems), through homologous recombination. Both deletions were verified by diagnostic PCRs.
Proteomic lysis and digestion
Cells were lysed by three passages through the French press at 4°C in 3 ml of lysis buffer consisting of 50 mM Tris pH 8, 4 M urea, 75 mM NaCl, 1 mM DTT, complete mini EDTA-free protease inhibitor (Roche Diagnostics, Indianapolis, IN), and phosSTOP phosphatase inhibitor (Roche Diagnostics). The lysate was centrifuged at 14 000 r.p.m. for 10 min. Cysteine residues were reduced and alkylated by incubating lysate with 3 mM DTT (final concentration) for 45 min at 37°C followed by incubation in 15 mM IAA for 1 h at room temperature in the dark. The alkylation reaction was capped by incubating the reaction with DTT for 15 min at room temperature. Proteins from each time point were digested overnight at 37°C after the addition of 1 mM CaCl2, 50 mM Tris (to decrease urea to 1 M) and adjusting to pH 8 at an enzyme:substrate ratio of 1:50 of trypsin (Promega, Madison, WI). Each digest was quenched by the addition of TFA to a final concentration of 0.5% (pH ⩽2), desalted via solid phase extraction on a 50-mg tC18 SepPak cartridge (Waters, Milford, MA), and the eluent was lyophilized.
TMT labeling
Each TMT (Tandem Mass Tag) was resuspended in 41 μl of pure ACN. Lyophilized peptides were resuspended in 18 MΩ H2O to a final concentration of 5 μl/μl, with the addition of 200 mM TEAB bringing the final volume of 132.5 μl. Resuspended peptides were mixed with each respective tag as follows: 30 min, TMT126; 60 min, TMT127; 90 min, TMT128; 120 min, TMT129; 0 min, TMT130; 240 min, TMT131. Each reaction was allowed to incubate at room temperature with intermittent mixing for 1 h. Tagging was quenched with the addition of 8 μl 5% hydroxylamine for 15 min. The differentially labeled TMT samples were pooled in equal amounts and dried down.
Fractionation
Labeled peptides were fractionated using SCX chromatography as described previously (Swaney et al, 2010). Each TMT 6-plex peptide mixture was resuspended in 500 μl of SCX buffer A (5 mM KH2PO4, 30% ACN, pH 2.65) and loaded onto a polysulfoethyl apartamide column (9.4 × 200 mm2, Poly LC, Columbia, MD) connected to a Surveyor LC quaternary pump (Thermo Electron, San Jose, CA) running at 3.0 ml/min. Peptides were detected via a PDA detector (Thermo Electron). A total of 16 fractions were collected in 3 min intervals over the course of the SCX gradient. The following gradient was used: 2 min of isocratic buffer A, followed by a linear gradient of 0–10% buffer B (5 mM KH2PO4, 30% ACN, 350 mM KCl, pH 2.65) from 5 to 35 min. Buffer B was ramped up to 100% over the next 6 min. Then, a 7-min transition from buffer B to 100% C (50 mM KH2PO4, 500 mM KCl, pH 8) and buffer D (18 MΩ water) were used to wash the column. Each fraction was lyophilized and desalted on 50 mg tC18 SepPak cartridges. Desalted eluants were lyophilized and stored at −80°C.
LC–MS/MS
SCX fractions were resuspended in 30 μl of 0.2% formic acid. A Waters nanoAquity HPLC and auto-sampler was used to load samples onto an 8-cm, 75 μm i.d. pre-column packed with 5 μm C18 particles, and separated across a 25-cm, 50 μm i.d. analytical column packed with 5 μm C18 particles. Samples were loaded onto the pre-column in 98% A (0.2% formic acid in water), 2% B (0.2% formic acid in CAN). Buffer B was increased to 5% over the first 3 min of the separation followed by an increase in B by 0.25% per min over 120 min, followed by a quick ramp up to 70% B over 10 min and held for 5 min. The gradient was dropped back to 2% over a period of 5 min and allowed to re-equilibrate for 20 min. Eluent was detected on an LTQ Orbitrap Velos (Thermo Fisher Scientific, Bremen, Germany) via an integrated electrospray emitter operating at 2.2 kV. Experiments consist of MS1 analysis in the obitrap mass analyzer followed by 10 data-dependent high energy collision cell dissociation MS/MS events with a precursor isolation width of 2 Th and mass analysis in the orbitrap as well. Each fraction was run twice. For all experiments, an AGC target value of 1 000 000 charges was used for MS1 and 45 000 charges for MS2. A mass resolution of 30 000 was used for MS1 and 7500 for MS2. Precursors were dynamically excluded for 45 s, and only peptides with assigned charge states of two or greater were selected for MS/MS interrogation. All proteomic data are available on our website (http://www.chem.wisc.edu/~coon/Downloads/Lee_MSB_2011/) and in the Proteome Commons Tranche repository under accession hash 8P18XwqHFqQk+NZ5TJj4DR0e5qLcOYvmhFfHwlyNaK9SWrkO93CYbKok485Hw/ud8Lz/5 × CjvVwNf5yVCMclx5zNvc0AAAAAAABuKg==
Proteomic data analysis
Spectral reduction was performed by DTA Generator. The OMSSA (Open Mass Spectrometry Search Algorithm) (Geer et al, 2004) was used to search spectra against a concatenated target-decoy version of the Saccharomyces Genome Database (http://www.yeastgenome.org) with fully tryptic enzyme specificity, allowing up to three missed cleavages. Static modifications of carbamidomethylation (+57 Da) on cysteine residues, TMT 6-plex on N-termini, and TMT 6-plex on lysine residues, and variable modifications of oxidation of methionine residues (+16 Da) and TMT 6-plex on tyrosine residues were specified. An average mass tolerance of ±4.5 Da was used for precursors, while a monoisotopic mass tolerance of ±0.01 Da was used for fragments with orbitrap detection. Identifications were filtered to a FDR of 1% using in-house software that iteratively checked combinations of expectation value (e-value) score and precursor mass error to find thresholds that maximize unique peptide identifications. Proteins were reduced for parsimony and filtered to 1% FDR as well. Protein quantitation was evaluated with custom software that corrects for isotopic impurities, normalizes reporter ion intensities, and coalesces peptide quantitation into protein quantitation (Wenger et al, 2011). Peptide and protein summaries are available in Supplementary Datasets S1 and S2, respectively. Reproducibility across biological replicates is summarized in Supplementary Table S4.
Microarray sample preparation and data acquisition
Total RNA was recovered by hot phenol extraction as previously described (Gasch, 2002b) and purified with a Qiagen RNeasy column. cDNA synthesis and microarray labeling was performed as described (Berry and Gasch, 2008), except that total RNA was labeled with a mixture of oligo-dT and random hexamer at a 1.7:1 molar ratio. Labeled cDNA from each RNA sample was hybridized against genomic DNA labeled as previously described (Pollack et al, 1999), swapping dye orientations for each time course. Samples were hybridized to custom Nimblegen tiled arrays and incubated on a Maui Hybridization Chamber at 42°C for 16 h. Arrays were scanned and analyzed with a GenePix4000 scanner (Molecular Devices, Sunnyvale, CA), and signal from both channels was extracted with the program NimbleScan. Signal intensity from the RNA-sample channel was quantile normalized for all 18 arrays using the Bioconductor package quantile.normalize() (Bolstad et al, 2003). The log2 ratio was calculated for each gene from the median intensity of gene probes at each time point compared with that of the unstressed cells.
The response of wild-type and dot6Δtod6Δ cells to 0.7 M NaCl was conducted in biological duplicate, as described above, comparing transcript abundance at 30 min after NaCl addition to the unstressed sample from each strain. Relative basal transcript abundance in wild-type and dot6Δtod6Δ cells was performed by extracting the signal intensity corresponding to the unstressed samples and comparing across arrays as described for the NaCl time course. Genes affected by DOT6TOD6 deletion were identified as those whose expression was >1.5-fold different between strains in both replicates: of the 323 genes identified, 244 displayed a repression defect in the dot6Δtod6Δ mutant. Nearly all of these showed ∼1.5 × higher basal levels in the unstressed mutant compared with wild type. All microarray data are available under GEO accession GSE23798 and in Supplementary Dataset S3.
Quantitative western blotting
Cells were lysed in cracking buffer and incubated at 95°C for 5 min with glass beads. Lysate from equivalent number of cells was analyzed by western analysis, using a mixture of mouse anti-actin (MAB1501, Millipore, Billerica, MA) and a second rabbit polyclonal antibody (Hsp104 antibody (Novus Biologicals, NB120-20547), and gifts of the Elizabeth Craig laboratory) to simultaneously detect Act1 and a second protein of interest. IRDDye680-conjugated anti-rabbit IgG and IRDye800-conjugated anti-mouse IgG (LiCor, Lincoln, NE) were used as secondary antibodies at 1:20 000 dilutions in Odyssey blocking buffer. Signal intensities were analyzed by using the Odyssey infrared image system (LiCor).
Polysome profiling and qPCR
Polysome profiles were collected as described in Arava et al (2003) using a 5–50% continuous sucrose gradients analyzed on a Teledyne Isco Fractionation unit. Fractions of ∼60 μl were collected and pooled to capture peaks indicated in Figure 4. Synthetic control RNA (Agilent, Santa Clara, CA) was added to each pool as a normalization control at 15 × 106 copies and RNA from the pool was purified over an RNeasy column (Qiagen, Valencia, CA). Quantitative PCR was done in at least technical duplicate using iQSYBR Green Supermix (Bio-Rad, Hercules, CA) on a MyiQ2 Bio-Rad Cycler. Primers spanned a 3′ 100–200 bp region of each ORF. Cycle numbers were normalized to the doped synthetic RNA (Figure 4) or to SEC21 as controls (Supplementary Figure S7). Relative log2 mRNA abundance in each polysome fraction was normalized to mRNA abundance measured in the trough between polysome peaks 1 and 2, to adjust to baseline levels.
Statistical analysis
Significant mRNA and protein changes were determined for all molecules measured in at least biological duplicate using an ANOVA test in the limma Bioconductor package (Smyth, 2004) with a Q-value (Storey and Tibshirani, 2003) FDR <0.05 taken as significant (Supplementary Dataset S3). In all cases, correlations were assessed based on the average values for fully triplicated data to minimize effects of technical noise. Transcripts that increased or decreased in abundance were defined based on the direction of the largest absolute change in abundance—in most cases, increases or decreases in abundance were largely consistent across all time points. Molecules subject to transient abundance changes were determined in limma by comparing each time point to the final 240 min sample, with FDR <0.05 taken as evidence of transience. Timing of peak levels for transient changes and of acclimation for gradual changes were also identified by a t-test in limma comparing adjacent time points, taking the earliest statistically differentiated time point as the peak/acclimation time. Times were manually inspected and corrected in some cases where subtle but consistent differences were not scored correctly. Transcripts whose change in expression at 15 min was greater than the change at 30 min (Berry and Gasch, 2008; unpublished data) were removed from this analysis (amounting to 13 of 140 genes for Figure 5). The magnitude of the transient burst was measured for RNAs peaking at 30 min by calculating the average difference in changes at 30 min versus 240 min.
Estimates of ribosome redistribution were calculated as follows. Measures of mRNA abundance per cellular mRNA pool from Lipson et al (2009) were converted to copies per cell, based on 60 000 transcripts per actively growing yeast cell (Zenklusen et al, 2008). The number of ribosomes per transcript, as measured by Arava et al (2003), was multiplied by the number of transcripts for each gene; the total number of engaged ribosomes was scaled to 171 000 (90% of 190 000 ribosomes; Warner et al, 2001). To estimate the number of ribosomes released at each time point in each time course, we multiplied the number of ribosomes per gene sequence by the fraction of mRNA that disappeared or appeared relative to starting levels. At each time point, all transcripts for which the average log2 value was <0 were taken as reduced, and the inverse was true for increased transcripts. The average and s.d. of the number of ribosomes released across all three time courses is shown in Figure 7.
Proteins subject to PTR were defined as follows: proteins whose maximal change was in the opposite direction of the maximal mRNA change were defined as opposing mRNA changes. Proteins changing greater than mRNA were identified if their steady-state differences at 240 min were greater than the corresponding mRNA differences in at least two of the three time courses. This is in contrast to most proteins that reach <50% the fold-change in mRNA (data not shown). Proteins subject to noise reduction were identified as follows: the Pearson correlation was calculated for each replicate profile for mRNA or protein, for all triplicated pairs where both mRNA and protein changed significantly. The average and s.d. of the three pairwise correlations was identified; mRNAs with an average correlation outside the average protein correlation plus two s.d. (95th confidence level) were identified. Functional enrichment was determined by testing the hypergenomic distribution using FDR <0.05 (Storey and Tibshirani, 2003) as significant in all cases.
Mathematical modeling overview
A detailed discussion of the modeling and results is presented in Supplementary Appendix. We developed a mass-action model in which:
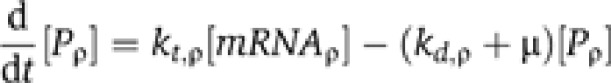 |
where kt,ρ represents the translation rate for protein ρ at time t, and kd,ρ represents the protein degradation rate (fixed over time) as measured by Belle et al (2006), μ represents the dilution rate due to cell division, and  represents the concentration of the protein at time t. Experimental evidence suggested little change in cell volume during the experiment (Supplementary Figure S6B), allowing us to assume a constant cell volume.
We suspected that the translation rate changed with time, particularly during cell-division arrest (Uesono and Toh, 2002), requiring us to create a model that allowed the ‘constants’ in the above equation to vary. These considerations changed our formula to the following form:
 |
where Pρ is the amount of protein ρ per cell, ks,ρ(t) is the translation rate for protein ρ at time t, mρ (t) is the mRNA amount for the transcript encoding protein ρ, kd,ρ is the decay rate of protein ρ, and μ(t) is the diffusion of proteins caused by cell growth at time t.
Because we made measurements at specific, discrete time points, we described time as having specific values (although they need not be uniformly distributed, as in many simulations): t0=0; t1=30, t2=60, t3=90, t4=120, and t5=240 min. We assumed for simplicity that translation rate and cell growth rate change instantly and only at the time points at which we have taken measurements (namely, at 30 min after NaCl treatment). We tested three models of translation. The first (model 1) calculated a single ks,ρ based on the t0=0 to t1=30 min transition. The second (model 2) calculated a single ks,ρ based on a regression across all time points. Because we expected that translation rates may vary during and after cell-division arrest (Uesono and Toh, 2002), we calculated a third model (model 3) in which two ks,ρ values were used: ks,ρ0 estimated translation rates between 0–30 min and ks,ρ1 estimated rates based on a regression across the 60–240 min time points. The model was developed on replicate 1 as the training set and validated on replicates 2 and 3 as test sets. In all cases, model 3 outperformed the other models (Supplementary Table S5; Supplementary Figure S8).
Simulations described in the main text were performed using model 3 on the training set. To test the effects of dilution, protein abundance was calculated with μ=80 min throughout the time course instead of only after t=30 min. To test the effect of increased-mRNA dynamics, the mRNA level at 30 min was replaced with the average values of the remaining time points to remove the transient burst, for all transcripts whose transcript increase peaked at 30 min. The effect of mRNA reduction was tested by calculating protein abundance when transcript levels were held at the median fold-change across the entire transcriptome (log2∼0). Mathematical models used in the analysis (Supplementary Dataset S4) have also been made available for analysis with COPASI (Supplementary Dataset S5). COPASI code was not used for the analysis described here, but was validated for several candidate mRNAs and made available for public use.
Supplementary Material
Supplementary Tables S3–5, Supplementary Figures S1–8
R2 for mRNA-protein changes by GO category
List of proteins subject to different types of post-transcriptional regulation
Summary of metrics and quantitation data for all peptides in each of three biological replicates
Summary of metrics and quantitation data for all proteins in each of three biological replicates
Complete normalized dataset and ANOVA FDR values
EXCEL-based modeling used in the manuscript
COPASI-compatible modeling code and instructions
Acknowledgments
We thank JL Will, L Hoover, and S Haroon for technical assistance; E Craig for providing antibodies and instrument access; AJ Bureta for graphical support; and R Gourse, E Craig, M Culbertson, J Yin, and the Gasch and Coon laboratories for constructive comments. SET was supported by NIH Genomic Sciences Training Grant T32HG002760. This work was funded by NIH R01 GM083989 to APG and an ARRA collaborative supplement to JJC and APG, and NIH R01GM080148 and PO1GM081629 to JJC.
Author contributions: MVL, SET, JJC, and APG designed the experiments; MVL performed proteomic analysis; SET performed transcriptomic analysis; SLH performed mathematical modeling; JH performed all polysome experiments and quantitative westerns; CDW wrote proteomic analysis software; MVL, SET, and APG performed statistical analysis and data interpretation; JJC and APG conceived of the experiments; MVL, SET, SLH, JJC, and APG wrote the manuscript.
Footnotes
The authors declare that they have no conflict of interest.
References
- Alon U (2007) Network motifs: theory and experimental approaches. Nat Rev 8: 450–461 [DOI] [PubMed] [Google Scholar]
- Arava Y, Wang Y, Storey JD, Liu CL, Brown PO, Herschlag D (2003) Genome-wide analysis of mRNA translation profiles in Saccharomyces cerevisiae. Proc Natl Acad Sci USA 100: 3889–3894 [DOI] [PMC free article] [PubMed] [Google Scholar]
- Belle A, Tanay A, Bitincka L, Shamir R, O'Shea EK (2006) Quantification of protein half-lives in the budding yeast proteome. Proc Natl Acad Sci USA 103: 13004–13009 [DOI] [PMC free article] [PubMed] [Google Scholar]
- Berry DB, Gasch AP (2008) Stress-activated genomic expression changes serve a preparative role for impending stress in yeast. Mol Biol Cell 19: 4580–4587 [DOI] [PMC free article] [PubMed] [Google Scholar]
- Blomberg A (1995) Global changes in protein synthesis during adaptation of the yeast Saccharomyces cerevisiae to 0.7 M NaCl. J Bacteriol 177: 3563–3572 [DOI] [PMC free article] [PubMed] [Google Scholar]
- Bolstad BM, Irizarry RA, Astrand M, Speed TP (2003) A comparison of normalization methods for high density oligonucleotide array data based on variance and bias. Bioinformatics 19: 185–193 [DOI] [PubMed] [Google Scholar]
- Brauer MJ, Huttenhower C, Airoldi EM, Rosenstein R, Matese JC, Gresham D, Boer VM, Troyanskaya OG, Botstein D (2008) Coordination of growth rate, cell cycle, stress response, and metabolic activity in yeast. Mol Biol Cell 19: 352–367 [DOI] [PMC free article] [PubMed] [Google Scholar]
- Causton HC, Ren B, Koh SS, Harbison CT, Kanin E, Jennings EG, Lee TI, True HL, Lander ES, Young RA (2001) Remodeling of yeast genome expression in response to environmental changes. Mol Biol Cell 12: 323–337 [DOI] [PMC free article] [PubMed] [Google Scholar]
- de Godoy LM, Olsen JV, Cox J, Nielsen ML, Hubner NC, Frohlich F, Walther TC, Mann M (2008) Comprehensive mass-spectrometry-based proteome quantification of haploid versus diploid yeast. Nature 455: 1251–1254 [DOI] [PubMed] [Google Scholar]
- Fournier ML, Paulson A, Pavelka N, Mosley AL, Gaudenz K, Bradford WD, Glynn E, Li H, Sardiu ME, Fleharty B, Seidel C, Florens L, Washburn MP (2010) Delayed correlation of mRNA and protein expression in rapamycin-treated cells and a role for Ggc1 in cellular sensitivity to rapamycin. Mol Cell Proteomics 9: 271–284 [DOI] [PMC free article] [PubMed] [Google Scholar]
- Futcher B, Latter GI, Monardo P, McLaughlin CS, Garrels JI (1999) A sampling of the yeast proteome. Mol Cell Biol 19: 7357–7368 [DOI] [PMC free article] [PubMed] [Google Scholar]
- Gandin V, Miluzio A, Barbieri AM, Beugnet A, Kiyokawa H, Marchisio PC, Biffo S (2008) Eukaryotic initiation factor 6 is rate-limiting in translation, growth and transformation. Nature 455: 684–688 [DOI] [PMC free article] [PubMed] [Google Scholar]
- Garcia-Martinez J, Gonzalez-Candelas F, Perez-Ortin JE (2007) Common gene expression strategies revealed by genome-wide analysis in yeast. Genome Biol 8: R222. [DOI] [PMC free article] [PubMed] [Google Scholar]
- Gasch AP (2002a) The Environmental Stress Response: a Common Yeast Response to Environmental Stresses. Springer-Verlag: Heidelberg [Google Scholar]
- Gasch AP (2002b) Yeast genomic expression studies using DNA microarrays. Methods Enzymol 350: 393–414 [DOI] [PubMed] [Google Scholar]
- Gasch AP, Huang M, Metzner S, Botstein D, Elledge SJ, Brown PO (2001) Genomic expression responses to DNA-damaging agents and the regulatory role of the yeast ATR homolog Mec1p. Mol Biol Cell 12: 2987–3003 [DOI] [PMC free article] [PubMed] [Google Scholar]
- Gasch AP, Spellman PT, Kao CM, Carmel-Harel O, Eisen MB, Storz G, Botstein D, Brown PO (2000) Genomic expression programs in the response of yeast cells to environmental changes. Mol Biol Cell 11: 4241–4257 [DOI] [PMC free article] [PubMed] [Google Scholar]
- Geer LY, Markey SP, Kowalak JA, Wagner L, Xu M, Maynard DM, Yang X, Shi W, Bryant SH (2004) Open mass spectrometry search algorithm. J Proteome Res 3: 958–964 [DOI] [PubMed] [Google Scholar]
- Ghaemmaghami S, Huh WK, Bower K, Howson RW, Belle A, Dephoure N, O'Shea EK, Weissman JS (2003) Global analysis of protein expression in yeast. Nature 425: 737–741 [DOI] [PubMed] [Google Scholar]
- Greenbaum D, Colangelo C, Williams K, Gerstein M (2003) Comparing protein abundance and mRNA expression levels on a genomic scale. Genome Biol 4: 117. [DOI] [PMC free article] [PubMed] [Google Scholar]
- Griffin TJ, Gygi SP, Ideker T, Rist B, Eng J, Hood L, Aebersold R (2002) Complementary profiling of gene expression at the transcriptome and proteome levels in Saccharomyces cerevisiae. Mol Cell Proteomics 1: 323–333 [DOI] [PubMed] [Google Scholar]
- Gygi SP, Rist B, Gerber SA, Turecek F, Gelb MH, Aebersold R (1999) Quantitative analysis of complex protein mixtures using isotope-coded affinity tags. Nat Biotechnol 17: 994–999 [DOI] [PubMed] [Google Scholar]
- Halbeisen RE, Gerber AP (2009) Stress-dependent coordination of transcriptome and translatome in yeast. PLoS Biol 7: e105. [DOI] [PMC free article] [PubMed] [Google Scholar]
- Hughes TR, Badis G, Chan ET, van Bakel H, Pena-Castillo L, Tillo D, Tsui K, Carlson CD, Gossett AJ, Hasinoff MJ, Warren CL, Gebbia M, Talukder S, Yang A, Mnaimneh S, Terterov D, Coburn D, Yeo AL, Yeo ZX, Clarke ND et al. (2008) A library of yeast transcription factor motifs reveals a widespread function for Rsc3 in targeting nucleosome exclusion at promoters. Mol Cell 32: 878–887 [DOI] [PMC free article] [PubMed] [Google Scholar]
- Ideker T, Galitski T, Hood L (2001a) A new approach to decoding life: systems biology. Annu Rev Genomics Hum Genet 2: 343–372 [DOI] [PubMed] [Google Scholar]
- Ideker T, Thorsson V, Ranish JA, Christmas R, Buhler J, Eng JK, Bumgarner R, Goodlett DR, Aebersold R, Hood L (2001b) Integrated genomic and proteomic analyses of a systematically perturbed metabolic network. Science 292: 929–934 [DOI] [PubMed] [Google Scholar]
- Jiang H, English AM (2002) Quantitative analysis of the yeast proteome by incorporation of isotopically labeled leucine. J Proteome Res 1: 345–350 [DOI] [PubMed] [Google Scholar]
- Jorgensen P, Nishikawa JL, Breitkreutz BJ, Tyers M (2002) Systematic identification of pathways that couple cell growth and division in yeast. Science (New York, NY) 297: 395–400 [DOI] [PubMed] [Google Scholar]
- Jorgensen P, Rupes I, Sharom JR, Schneper L, Broach JR, Tyers M (2004) A dynamic transcriptional network communicates growth potential to ribosome synthesis and critical cell size. Genes Dev 18: 2491–2505 [DOI] [PMC free article] [PubMed] [Google Scholar]
- Kaplan S, Bren A, Dekel E, Alon U (2008) The incoherent feed-forward loop can generate non-monotonic input functions for genes. Mol Syst Biol 4: 203. [DOI] [PMC free article] [PubMed] [Google Scholar]
- Kief DR, Warner JR (1981) Coordinate control of syntheses of ribosomal ribonucleic acid and ribosomal proteins during nutritional shift-up in Saccharomyces cerevisiae. Mol Cell Biol 1: 1007–1015 [DOI] [PMC free article] [PubMed] [Google Scholar]
- Kraft C, Deplazes A, Sohrmann M, Peter M (2008) Mature ribosomes are selectively degraded upon starvation by an autophagy pathway requiring the Ubp3p/Bre5p ubiquitin protease. Nat Cell Biol 10: 602–610 [DOI] [PubMed] [Google Scholar]
- Law GL, Bickel KS, MacKay VL, Morris DR (2005) The undertranslated transcriptome reveals widespread translational silencing by alternative 5′ transcript leaders. Genome Biol 6: R111. [DOI] [PMC free article] [PubMed] [Google Scholar]
- Li J, Steen H, Gygi SP (2003) Protein profiling with cleavable isotope-coded affinity tag (cICAT) reagents: the yeast salinity stress response. Mol Cell Proteomics 2: 1198–1204 [DOI] [PubMed] [Google Scholar]
- Lippman SI, Broach JR (2009) Protein kinase A and TORC1 activate genes for ribosomal biogenesis by inactivating repressors encoded by Dot6 and its homolog Tod6. Proc Natl Acad Sci USA 106: 19928–19933 [DOI] [PMC free article] [PubMed] [Google Scholar]
- Lipson D, Raz T, Kieu A, Jones DR, Giladi E, Thayer E, Thompson JF, Letovsky S, Milos P, Causey M (2009) Quantification of the yeast transcriptome by single-molecule sequencing. Nat Biotechnol 27: 652–658 [DOI] [PubMed] [Google Scholar]
- Lu P, Vogel C, Wang R, Yao X, Marcotte EM (2007) Absolute protein expression profiling estimates the relative contributions of transcriptional and translational regulation. Nat Biotechnol 25: 117–124 [DOI] [PubMed] [Google Scholar]
- Mangan S, Alon U (2003) Structure and function of the feed-forward loop network motif. Proc Natl Acad Sci USA 100: 11980–11985 [DOI] [PMC free article] [PubMed] [Google Scholar]
- Melamed D, Pnueli L, Arava Y (2008) Yeast translational response to high salinity: global analysis reveals regulation at multiple levels. RNA 14: 1337–1351 [DOI] [PMC free article] [PubMed] [Google Scholar]
- Molin C, Jauhiainen A, Warringer J, Nerman O, Sunnerhagen P (2009) mRNA stability changes precede changes in steady-state mRNA amounts during hyperosmotic stress. RNA (New York, NY) 15: 600–614 [DOI] [PMC free article] [PubMed] [Google Scholar]
- Newman JR, Ghaemmaghami S, Ihmels J, Breslow DK, Noble M, DeRisi JL, Weissman JS (2006) Single-cell proteomic analysis of S. cerevisiae reveals the architecture of biological noise. Nature 441: 840–846 [DOI] [PubMed] [Google Scholar]
- Nomura M (1999) Regulation of ribosome biosynthesis in Escherichia coli and Saccharomyces cerevisiae: diversity and common principles. J Bacteriol 181: 6857–6864 [DOI] [PMC free article] [PubMed] [Google Scholar]
- Ong SE, Blagoev B, Kratchmarova I, Kristensen DB, Steen H, Pandey A, Mann M (2002) Stable isotope labeling by amino acids in cell culture, SILAC, as a simple and accurate approach to expression proteomics. Mol Cell Proteomics 1: 376–386 [DOI] [PubMed] [Google Scholar]
- Park EH, Zhang F, Warringer J, Sunnerhagen P, Hinnebusch AG (2011) Depletion of eIF4G from yeast cells narrows the range of translational efficiencies genome-wide. BMC Genomics 12: 68. [DOI] [PMC free article] [PubMed] [Google Scholar]
- Picotti P, Bodenmiller B, Mueller LN, Domon B, Aebersold R (2009) Full dynamic range proteome analysis of S. cerevisiae by targeted proteomics. Cell 138: 795–806 [DOI] [PMC free article] [PubMed] [Google Scholar]
- Pollack JR, Perou CM, Alizadeh AA, Eisen MB, Pergamenschikov A, Williams CF, Jeffrey SS, Botstein D, Brown PO (1999) Genome-wide analysis of DNA copy-number changes using cDNA microarrays. Nat Genet 23: 41–46 [DOI] [PubMed] [Google Scholar]
- Proud CG (2007) Signalling to translation: how signal transduction pathways control the protein synthetic machinery. Biochem J 403: 217–234 [DOI] [PubMed] [Google Scholar]
- Regenberg B, Grotkjaer T, Winther O, Fausboll A, Akesson M, Bro C, Hansen LK, Brunak S, Nielsen J (2006) Growth-rate regulated genes have profound impact on interpretation of transcriptome profiling in Saccharomyces cerevisiae. Genome Biol 7: R107. [DOI] [PMC free article] [PubMed] [Google Scholar]
- Rudra D, Warner JR (2004) What better measure than ribosome synthesis? Genes Dev 18: 2431–2436 [DOI] [PubMed] [Google Scholar]
- Saavedra C, Tung KS, Amberg DC, Hopper AK, Cole CN (1996) Regulation of mRNA export in response to stress in Saccharomyces cerevisiae. Genes Dev 10: 1608–1620 [DOI] [PubMed] [Google Scholar]
- Scott M, Gunderson CW, Mateescu EM, Zhang Z, Hwa T (2010) Interdependence of cell growth and gene expression: origins and consequences. Science 330: 1099–1102 [DOI] [PubMed] [Google Scholar]
- Shalem O, Dahan O, Levo M, Martinez MR, Furman I, Segal E, Pilpel Y (2008) Transient transcriptional responses to stress are generated by opposing effects of mRNA production and degradation. Mol Syst Biol 4: 223. [DOI] [PMC free article] [PubMed] [Google Scholar]
- Smyth GK (2004) Linear models and empirical bayes methods for assessing differential expression in microarray experiments. Stat Appl Genet Mol Biol 3: Article3. [DOI] [PubMed] [Google Scholar]
- Soufi B, Kelstrup CD, Stoehr G, Frohlich F, Walther TC, Olsen JV (2009) Global analysis of the yeast osmotic stress response by quantitative proteomics. Mol Biosyst 5: 1337–1346 [DOI] [PubMed] [Google Scholar]
- Storey JD, Tibshirani R (2003) Statistical significance for genomewide studies. Proc Natl Acad Sci USA 100: 9440–9445 [DOI] [PMC free article] [PubMed] [Google Scholar]
- Swaney DL, Wenger CD, Coon JJ (2010) Value of using multiple proteases for large-scale mass spectrometry-based proteomics. J Proteome Res 9: 1323–1329 [DOI] [PMC free article] [PubMed] [Google Scholar]
- Tsay YF, Thompson JR, Rotenberg MO, Larkin JC, Woolford JL Jr (1988) Ribosomal protein synthesis is not regulated at the translational level in Saccharomyces cerevisiae: balanced accumulation of ribosomal proteins L16 and rp59 is mediated by turnover of excess protein. Genes Dev 2: 664–676 [DOI] [PubMed] [Google Scholar]
- Uesono Y, Toh EA (2002) Transient inhibition of translation initiation by osmotic stress. J Biol Chem 277: 13848–13855 [DOI] [PubMed] [Google Scholar]
- von der Haar T (2008) A quantitative estimation of the global translational activity in logarithmically growing yeast cells. BMC Syst Biol 2: 87. [DOI] [PMC free article] [PubMed] [Google Scholar]
- Waldron C, Lacroute F (1975) Effect of growth rate on the amounts of ribosomal and transfer ribonucleic acids in yeast. J Bacteriol 122: 855–865 [DOI] [PMC free article] [PubMed] [Google Scholar]
- Warner JR (1999) The economics of ribosome biosynthesis in yeast. Trends Biochem Sci 24: 437–440 [DOI] [PubMed] [Google Scholar]
- Warner JR, Mitra G, Schwindinger WF, Studeny M, Fried HM (1985) Saccharomyces cerevisiae coordinates accumulation of yeast ribosomal proteins by modulating mRNA splicing, translational initiation, and protein turnover. Mol Cell Biol 5: 1512–1521 [DOI] [PMC free article] [PubMed] [Google Scholar]
- Warner JR, Vilardell J, Sohn JH (2001) Economics of ribosome biosynthesis. Cold Spring Harb Symp Quant Biol 66: 567–574 [DOI] [PubMed] [Google Scholar]
- Warringer J, Hult M, Regot S, Posas F, Sunnerhagen P (2010) The HOG pathway dictates the short-term translational response after hyperosmotic shock. Mol Biol Cell 21: 3080–3092 [DOI] [PMC free article] [PubMed] [Google Scholar]
- Washburn MP, Koller A, Oshiro G, Ulaszek RR, Plouffe D, Deciu C, Winzeler E, Yates JR III (2003) Protein pathway and complex clustering of correlated mRNA and protein expression analyses in Saccharomyces cerevisiae. Proc Natl Acad Sci USA 100: 3107–3112 [DOI] [PMC free article] [PubMed] [Google Scholar]
- Wenger CD, Phanstiel DH, Lee MV, Bailey DJ, Coon JJ (2011) COMPASS: a suite of pre- and post-search proteomics software tools for OMSSA. Proteomics 11: 1064–1074 [DOI] [PMC free article] [PubMed] [Google Scholar]
- Zenklusen D, Larson DR, Singer RH (2008) Single-RNA counting reveals alternative modes of gene expression in yeast. Nat Struct Mol Biol 15: 1263–1271 [DOI] [PMC free article] [PubMed] [Google Scholar]
- Zhu C, Byers KJ, McCord RP, Shi Z, Berger MF, Newburger DE, Saulrieta K, Smith Z, Shah MV, Radhakrishnan M, Philippakis AA, Hu Y, De Masi F, Pacek M, Rolfs A, Murthy T, Labaer J, Bulyk ML (2009) High-resolution DNA-binding specificity analysis of yeast transcription factors. Genome Res 19: 556–566 [DOI] [PMC free article] [PubMed] [Google Scholar]
Associated Data
This section collects any data citations, data availability statements, or supplementary materials included in this article.
Supplementary Materials
Supplementary Tables S3–5, Supplementary Figures S1–8
R2 for mRNA-protein changes by GO category
List of proteins subject to different types of post-transcriptional regulation
Summary of metrics and quantitation data for all peptides in each of three biological replicates
Summary of metrics and quantitation data for all proteins in each of three biological replicates
Complete normalized dataset and ANOVA FDR values
EXCEL-based modeling used in the manuscript
COPASI-compatible modeling code and instructions