

Abstract
A sensitive and specific liquid chromatography–tandem mass spectrometry method was developed and validated for the quantification of the plant natural product silvestrol in mice, using ansamitocin P-3 as the internal standard. The method was validated in plasma with a lower limit of quantification of 1 ng/mL, accuracy ranging from 87 to 114%, and precision (coefficient of variation) below 15%. The validated method was used to characterize pharmacokinetics in C57BL/6 mice and metabolism in mouse, human and rat plasma, and liver microsomes. Mice were dosed with silvestrol formulated in hydroxypropyl-β-cyclodextrin via intravenous, intraperitoneal, and oral routes followed by blood sampling up to 24 h. Intraperitoneal systemic availability was 100%, but oral administration resulted in only 1.7% bioavailability. Gradual degradation of silvestrol was observed in mouse and human plasma, with approximately 60% of the parent drug remaining after 6 h. In rat plasma, however, silvestrol was completely converted to silvestric acid (SA) within 10 min. Evaluation in microsomes provided further evidence that the main metabolite formed was SA, which subsequently showed no cytotoxic or cytostatic activity in a silvestrol-sensitive lymphoblastic cell line. The ability of the analytical assay to measure tissue levels of silvestrol was evaluated in liver, brain, kidney, and spleen. Results indicated the method was capable of accurately measuring tissue levels of silvestrol and suggested it has a relatively low distribution to brain. Together, these data suggest an overall favorable pharmacokinetic profile of silvestrol in mice and provide crucial information for its continued development toward potential clinical testing.
Key words: liquid chromatography–tandem mass spectrometry, mouse plasma, pharmacokinetics, silvestrol
Introduction
Silvestrol (Fig. 1) is a rocaglate derivative with a unique dioxanyl ring-containing side chain. It was isolated and fully structurally characterized by Kinghorn and colleagues in 2004 from the Indonesian plant Aglaia foveolata (family Meliaceae) (1). The first rocaglate derivative obtained, rocaglamide, was isolated in 1982 (2), with the absolute configuration established by synthesis several years later (3). Thus, the rocaglates represent a relatively recent natural product chemotype for the development of new anticancer lead compounds (4,5). Total synthesis of silvestrol has been reported by the groups of Porco (6) and Rizzacasa (7,8). In addition, this compound has been reported as an antineoplastic agent in the patent literature as a constituent of Aglaia leptantha collected in Sarawak, Malaysia (9). Silvestrol exhibits potent in vitro cytotoxic activity against a panel of human cell lines derived from breast, prostate, and lung cancers, and shows promising in vivo activity in xenograft cancer models. In these tumors, the cytotoxic effects of silvestrol are mediated through blockade of cell cycle progression at the G2/M phase and subsequent induction of p53-indepenent apoptosis (10) (11). More recently, Lucas and colleagues demonstrated that silvestrol exhibits potent activity in multiple models of B-cell malignancies (12). This activity appears to be through selective inhibition of translation with subsequent depletion of the anti-apoptotic protein Mcl-1. Importantly, the efficacy of silvestrol is greater in B lymphocytes relative to T lymphocytes, suggesting a particular potential for the therapy of B-cell diseases (12). Pelletier and colleagues demonstrated that silvestrol directly blocks translation at the initiation step by disrupting the normal interaction of eukaryotic initiation factor eIF4A with capped mRNA, and via this effect enhances the chemosensitivity of multiple tumor types (13,14). Because of these promising efficacy and mechanistic studies, the National Cancer Institute has initiated pre-clinical pharmacologic investigation of silvestrol to generate information to support potential future clinical testing.
Fig. 1.

Structures of silvestrol and silvestric acid
Toward this goal, we have developed and validated a method for silvestrol quantification in mouse plasma and tissues using liquid–liquid extraction (LLE) and liquid chromatography/tandem mass spectroscopy (LC-MS/MS) analysis. We applied this method to characterize pharmacokinetics in mice dosed with an aqueous 2-hydroxypropyl-β-cyclodextrin (HP-β-CD) formulation of silvestrol. Herein, we report these results as well as stability and metabolism of silvestrol in mouse, rat and human plasma and liver microsomes.
Materials and Methods
Materials
Silvestrol (ca. 97% pure) was obtained from the National Cancer Institute (Frederick, MD). Ansamitocin P-3 (AP-3) was obtained as a white powder from Takeda Chemical Industries (Osaka, Japan). Agents were used without further purification. Silvestric acid was purified from A. foveolata in our laboratories (1). A dinitroaniline-positive control substrate for S9 and microsomal reactions was a kind gift from Dr. Karl A. Werbovetz, The Ohio State University College of Pharmacy. HP-β-CD was obtained from Cyclodextrin Technologies Development, Inc. (High Springs, FL). LC-grade ethyl acetate (EA) and acetonitrile (ACN) were purchased from Fisher Scientific (Waltham, MA). Formic acid (FA) and bovine serum albumin were purchased from Sigma-Aldrich (St. Louis, MO). Heparin-treated mouse plasma was obtained from Lampire Biological Laboratories, Inc. (Pipersville, PA). Human plasma was obtained from the American Red Cross (Columbus, OH). Rat liver S9 fraction and human, rat, and mouse liver microsomes were purchased from BD Biosciences (San Jose, CA). A Barnstead E-pure water purification system (Dubuque, IA) was used to obtain HPLC grade water (>18 mΩ). Nicotinamide adenine dinucleotide phosphate (NADPH) and uridine diphosphate glucuronic acid (UDPGA) were purchased from Sigma-Aldrich. Effects of silvestric acid on the growth of the 697 acute lymphoblastic leukemia cell line were evaluated using the CellTiter 96 assay, Promega Co. (Madison, WI).
Stock, Standard and Quality Control Sample Preparation
Stock solutions (1 mg/mL) of silvestrol, silvestric acid, and AP-3 were prepared in ACN and stored at −80°C. Standard solutions with silvestrol and/or silvestric acid concentrations ranging from 10 to 10,000 ng/mL were prepared by dilution of stock solutions with ACN. Standard and quality control (QC) plasma samples were prepared by adding 10 μL standard solution to 90 μL mouse plasma containing 100 ng/mL AP-3. QC samples were prepared at 5.0, 50, and 500 ng/mL.
Sample Processing
Mouse plasma samples from pharmacokinetic and validation studies were removed from −80°C storage, thawed, and spiked with the internal standard (final concentration of 100 ng/mL). After vortex mixing, samples were extracted with 1 mL of EA with mechanical shaking for 60 min then centrifuged at 11,000 ×g for 2 min. FA (2%) was added to plasma samples to enhance extraction efficiency. Samples were placed on dry ice for 1 min to solidify the lower plasma layer, and the supernatant EA layer was collected in a glass tube and evaporated to dryness under a gentle stream of nitrogen. After evaporation, residues were reconstituted with 100 μL of mobile phase and were transferred to microcentrifuge tubes and centrifuged at 11,000 ×g for 2 min. Supernatants were transferred to autosampler vials for analysis. For tissue sample processing, approximately 30 mg mouse tissues were weighed and homogenized in 260 μL PBS, and were vortex-mixed twice at 15,000 rpm for 15 s on ice. Resulting tissue homogenates were treated with 300 μL lysis buffer (20 mM Tris pH 8.0, 20 mM EDTA, 0.5% NP-40) on ice for 5 min. The mixture was centrifuged at 15,000 rpm for 1 min, and the supernatant was acidified by addition of 2% FA prior to EA extraction. Sample drying and residue reconstitution steps were performed as described above.
LC-MS/MS Analysis
Method validation and pharmacokinetic sample analysis was performed on an API-3000 mass spectrometer from Applied Biosystems (Foster City, CA) equipped with LC-10 ADVP pumps, a SIL-10 ADVP autosampler, a SCL-10 AVP system controller and a DGU-14A degassing unit, all from Shimadzu Co. (Columbia, MD). A 50 × 2.1 mm, 5 μm Betabasic C8 column coupled with a 10 × 2.1 mm, 5 μm Betabasic C8 guard column (Thermo Hypersil-Keystone, Bellefonte, PA) was used for separation of analytes. Samples (20 μL) were injected into an isocratic mobile phase comprising 50% ACN with 0.1% FA at a flow rate of 0.2 mL/min. Samples were ionized in positive mode using a turbo ionspray ionization source with nebulizer pressure of 10 units, curtain gas pressure of 9 units, and an ionspray voltage setting of 4,000. The turbo ionspray heater was operated at 400°C with 7 L/min nitrogen flow. Ion transitions used for silvestrol, silvestric acid, and AP-3 were m/z 672 → 535, m/z 663 → 601, and m/z 635 → 547, respectively. The total analysis time was 5 min per sample.
To verify the structures of silvestrol fragment ions, a Micromass micro quadrupole-time of flight (Q-TOF) hybrid mass spectrometer (Waters, Inc., Bellefonte, PA) with lock-spray ionization source was used. The samples were dissolved in 50% ACN containing 0.1% FA and directly infused through the electrospray probe at 10 μL/min. Calibration standards [10 μg/mL polyethylene glycol (PEG 300 + PEG 600) in 2 mM ammonium acetate in 50% ACN and 10 μg/mL CsI in 50% 2-propanol] were introduced at 5-s intervals through the lock-spray source. The electrospray and lock-spray probes were operated in positive ion mode with 3.2 kV spray voltage and cone and dissolvation gas flow rates of 50 and 400 L/h, respectively. High-resolution mass spectra of fragment ions were obtained using in-source fragmentation with extraction voltages between 30 and 60 V.
Plasma Assay Validation
Silvestrol within-run precision values were determined in six replicates of QC samples at concentrations of 5, 50, and 500 ng/mL, and between-run precision was determined across these concentrations on six different days. Mean concentrations and coefficients of variation (relative standard deviation; %CV) were calculated from the six replicates. The accuracy of the assay was determined by comparing the corresponding calculated mean concentrations with nominal concentrations. The lower limit of quantification (LLOQ) was defined as the lowest concentration in the calibration curve with accuracy between 80% and 120% and precision less than or equal to 20%.
Matrix effects and recovery of silvestrol from mouse plasma were evaluated in three separate batches of QC samples: (a) prepared directly in 50% ACN/0.1% FA (MP), (b) extract from untreated mouse plasma reconstituted in MP, and (c) extract of silvestrol in mouse plasma reconstituted in MP. The matrix effects and recovery of silvestrol and AP-3 were calculated by the ratio of peak areas from batches (c)/(a) and from ratios of batches (b)/(a), respectively.
For short-term stability, QC samples were prepared in mouse plasma and evaluated at various times between 0 and 6 h. For long-term freezer and freeze–thaw stability, QC samples were prepared in mouse plasma and stored in a −80°C freezer. Long-term samples remained at −80°C for 21 days until analysis. For freeze–thaw stability, samples were removed after 1 day in the freezer, thawed at room temperature for approximately 5 min, mixed, and immediately returned to −80°C. This process was repeated at 24-h intervals for three freeze–thaw cycles, and samples were subsequently analyzed.
Mouse Studies
Silvestrol dosing solutions were prepared in HP-β-CD as follows: HP-β-CD (4.001 g) was dissolved in water resulting in a final volume of 13.3 ml. Silvestrol (13.57 mg) was added into the HP-β-CD solution and vortexed until completely dissolved. The solution was then filtered through a 0.22 μm syringe filter (Corning, Inc., Corning, NY) to produce 1.0 mg/ml silvestrol in 30% HP-β-CD. Solutions were stored at 4°C for less than 2 days before use.
All animal studies and euthanasia were carried out under protocols approved by the Ohio State University Institutional Animal Care and Use Committee. C57BL/6 mice (male, 4–6 weeks old) were obtained from Harlan Laboratories (Madison, WI) and entered into the pharmacokinetic study after at least 2 days of acclimation. All animals were housed in cages with a 12 h light–dark cycle with controlled temperature (72°F–78°F) and humidity (55–70%) and were fed standard laboratory food (Harlan). Water was available to the mice throughout the experiment. The mice (divided into groups of six) were injected with 1.0 mg/ml HP-β-CD/silvestrol pre-warmed to room temperature prior to injection. Mice received silvestrol at 5.0 mg/kg mouse body weight by tail vain (IV) or intraperitoneal (IP) injection (body weight range 24.5–27.1 g). Mice receiving oral doses (PO; body weight range 17–20 g) were treated using HP-β-CD/silvestrol formulated at a higher concentration (1.25 mg/ml) for a silvestrol dose of 25 mg/kg. Mice in the control group were treated with volume-matched 30% HP-β-CD solution without silvestrol.
Mice were sacrificed by CO2 asphyxiation followed by cervical dislocation at 5, 10, 20, 30, 45, and 60 min, and 1.5, 2, 4, 8, 12, and 24 h after IV or IP dosing. PO-dosed mice were sacrificed at 10, 30, 45, and 60 min, and 1.5, 2, 4, 6, and 8 h post treatment. Blood was extracted by cardiac puncture immediately after cervical dislocation then transferred into heparanized tubes and centrifuged at 10,000 ×g for 5 min. Separated plasma was then collected and stored at −80°C until processing and analysis. For tissue distribution studies, five mice were killed 1 h after IV dosing, and liver, kidney, brain, and spleen were immediately collected and frozen at −80°C until processing. No signs of toxicity in the animals were observed throughout the experiment.
Inter-Species Plasma and Microsome Stability and Metabolite Profiling
For plasma stability, 800 nM silvestrol was incubated in human, rat, or mouse plasma at room temperature for 0 to 300 min. For microsome reactions, 20 μM silvestrol was incubated in 0.1 M phosphate buffer (pH 7.4) containing 1 mg/mL microsomes from human, rat, or mouse with NADPH and UDPGA (1 mM each). Incubations were performed at 37°C, and 200 μL aliquots were removed and immediately extracted with methanol after 60 min incubation. Identical samples without incubation (0 min) and inactivated microsomes were used as negative controls, and dinitroaniline was used as a positive control to confirm microsome activity. Each experiment comprised triplicate samples at the various time points. After adding methanol, samples were centrifuged and the supernatant was transferred to another clean glass tube and evaporated under a gentle stream of nitrogen. The reconstituted samples were analyzed by a Shimadzu LC-20/TSQ Quantum Ultra EMR (ThermoFinnigan) LC-MS/MS system.
Protein Binding
Protein binding was performed in plasma and serum from human and mouse. Binding to purified human albumin was also evaluated. These assays were performed as previously described (15). Briefly, silvestrol protein binding was measured using an HTD 96 re-usable micro-equilibrium dialysis device (HTDialysis, Gales Ferry, CT). Samples (100 μl) with 250 nM silvestrol and either plasma- or phosphate-buffered saline (PBS, pH 7.4) with varying concentrations of human albumin (Sigma, St. Louis, MO) were loaded into one side of each well divided by pre-equilibrated membranes (12–14 kDa) and incubated for 6 h at room temperature against an equal volume of PBS. After incubation, volumes of sample and buffer were measured, and each was then processed for LC-MS/MS analysis. Protein binding was calculated with the formula, [(S − B) × (N / 100) / ((S − B) × (N / 100)) + B] × 100, where S and B are concentrations of silvestrol on the sample and buffer sides of the dialysis membrane, respectively, and N is the final volume of sample.
Pharmacokinetic Data Analysis and Modeling
Pharmacokinetic analyses were performed using WinNonlin Professional software (v.5.2, Pharsight, Mountain View, CA). Non-compartmental pharmacokinetic analysis was completed with each data set (IV, IP, and PO) with sparse sampling (mean data), 1/Y weighting and linear/log interpolation for AUC0−∞ calculations. WinNonlin automatic selections of points for λZ calculations were evaluated visually and deemed appropriate for terminal phase regression. For compartmental analysis, 1, 2, and 3 compartment models were evaluated for each data set. The goodness of fit for each model was assessed by evaluation of diagnostic parameters (Akaike Information Criterion, Schwartz Bayesian Criterion; AIC and SBC), residual plots, and standard errors of estimate.
Results
LC-MS/MS Method Development
The silvestrol [M + H]+ ion was observed at m/z 655.23 (Fig. 1). The full-scan mass spectrum of silvestrol displayed a peak at m/z 655 and additional abundant peaks at m/z 672 and m/z 637, which were anticipated to be the ammonium adduct and dehydrated ions of silvestrol, respectively. The product ion spectrum of each of these ions displayed a prominent peak at m/z 535, which was observed in the full-scan spectrum and is likely due to in-source fragmentation of silvestrol. High-resolution mass spectrometry was used to confirm the composition of the stable and prominent m/z 672 ion. Results indicated an observed m/z of 672.2651, which was within 0.7 parts per million of the theoretical m/z of 672.2656 for the silvestrol ammonium adduct (molecular formula C13H42NO13). Similarly, the observed accurate m/z ratio of 535.1976 was within 2.4 ppm of the theoretical m/z value of 535.1963 for the silvestrol fragment, thus confirming the unanticipated stable ammonium adducts. The m/z 672 > 535 transition for silvestrol was therefore chosen for further optimization in single reaction monitoring mode. For silvestric acid, the sodium adduct ion with m/z 663 was observed as the predominant ion peak in the full-scan spectrum. The product ion with m/z 601 was the major fragment ion formed under appropriate collision energy. Therefore, the m/z 663 > 601 ion mass transition was selected for silvestric acid. Similarly, the m/z 635 > 547 ion mass transition was optimized for AP-3. The full mass and MS/MS spectra of silvestrol and AP-3 are presented in Fig. 2. Initial LC conditions evaluated included a C18 column with gradient elution using water and either methanol or ACN mobile phases. Adequate separation was achieved, but further reduction of analyte retention times and overall run time was achieved with an isocratic method using 50% acetonitrile and 0.1% FA on a 50 × 2.1 mm Betabasic C8 column.
Fig. 2.

Mass spectra of silvestrol and AP-3. Spectra were obtained from direct infusion of 10 μg/mL of each analyte in positive ion electrospray ionization mode. The chemical structures of silvestrol and AP-3 and their putative fragments are shown in the insets: a mass spectrum and chemical structure of silvestrol with m/z 672 @ 25 V; b chemical structure and MS/MS spectrum of the putative silvestrol fragment at m/z 535; c mass spectrum and chemical structure of AP-3 at m/z 635 @ 25 V; d chemical structure and MS/MS spectrum of the putative fragment ion of AP-3 fragment at m/z 547. Dashed lines in panels a and c indicate putative fragmentation sites
Method Validation
Retention times for silvestric acid, silvestrol and AP-3 were approximately 1.4, 1.9, and 2.7 min, respectively, with Gaussian peaks and clear baseline separation. To demonstrate specificity of the method, typical chromatograms of blank mouse plasma with and without silvestrol at 1 ng/mL are displayed in Fig. 3. Total ion chromatograms showing separation of silvestric acid, silvestrol and AP-3 at 100 ng/mL are presented in Fig. 4. The linearity of the method was evaluated with standard mouse plasma samples spiked with several concentrations of silvestrol and a fixed 100 ng/mL concentration of AP-3. Calibration curves with response area ratio plotted against actual silvestrol concentration indicated linearity between the LLOQ of 1 ng/mL up to 1,000 ng/mL. This range was ultimately validated with two calibration curves fit from 1–50 and 50–1,000 ng/mL. Concentrations of silvestrol as low as 0.5 ng/mL were detectable. Intra- and inter-day validation experiments were conducted with six replicates each at 1, 5, 50, and 500 ng/mL. Intra-day accuracy of these samples ranged from 90–109% with relative standard deviations 15% or lower for each concentration. Inter-day accuracy and precision ranged from 101% to 110% and 8% to 13%, respectively. Data from these experiments are presented in Table I. Partial validation of silvestric acid included linearity and within-day accuracy and precision. Results indicated a linear range of 1 to 1,000 ng/mL, as with silvestrol.
Fig. 3.

Total ion chromatograms of silvestrol in mouse plasma. Chromatograms from (a) blank plasma and (b) plasma spiked with 1 ng/mL silvestrol (1.94 min retention time)
Fig. 4.

Total ion chromatogram of silvestric acid, silvestrol and AP-3. LC-MS/MS chromatogram showing relative separation of silvestric acid (1.40 min), silvestrol (1.84 min), and AP-3 (2.72 min)
Table I.
Silvestrol Intra-day and Inter-day Accuracy and Precision
| QC (ng/mL) | Mean calculated concentrations | |||
|---|---|---|---|---|
| Intra-day | Inter-day | |||
| ng/mL (% accuracy) | %CV | ng/mL (% accuracy) | %CV | |
| 1 | 1.05 (105) | 15.1 | 1.10 (110) | 12.6 |
| 5 | 4.52 (90) | 8.88 | 5.07 (101) | 8.27 |
| 50 | 54.6 (109) | 8.70 | 52.1 (104) | 8.49 |
| 500 | 517 (103) | 10.1 | 520 (104) | 9.04 |
Values show mean concentrations and % accuracy. Relative standard deviation (%CV) is from six replicates
Matrix Effects
The effect of the plasma matrix on the recovery and ionization of silvestrol was evaluated by reconstituting residue from EA extracted blank mouse plasma with 100 μL of standard solutions containing 1, 5, 50, 500, and 1,000 ng/mL silvestrol and 100 ng/mL of AP-3 in mobile phase. These and standard mobile phase samples were analyzed, and results indicated no measurable matrix effects between 50 and 1,000 ng/mL silvestrol or at the 100 ng/mL level of AP-3. However, signals in the matrix samples at the lower concentrations were approximately 70% of those of signals in the mobile phase. This result indicated minor, but measurable, signal suppression by the matrix at these lower concentrations.
Plasma Stability
Long-term freezer and freeze–thaw stability of silvestrol in mouse plasma was evaluated with quintuplicate samples at 5, 50, and 500 ng/mL. Samples were prepared and immediately frozen at minus 80°C. For long-term freezer stability, samples were thawed and analyzed 21 days after freezing. Results indicated good freezer stability with accuracy between 109% and 114% (Table II). Freeze–thaw samples were cycled three times thawing at room temperature followed by re-freezing. Results indicated accuracy between 83% and 109% (Table III). Short-term mouse plasma stability was conducted with samples containing 800 ng/mL silvestrol. Evaluations of samples incubated at room temperature indicated a steady loss of silvestrol signal between 0 min and 6 h, with a 40% loss of silvestrol at 6 h. Overall plasma stability data warrant expedient sample processing to avoid degradation of silvestrol at room temperature. Frozen samples appear stable for at least 3 weeks, although multiple freeze–thaw cycles may result in some silvestrol degradation.
Table II.
Silvestrol Freezer Stability (−80°)
| QC Sample (ng/ml) | Average Calculated Concentration ng/mL (% accuracy) | Standard Deviation (ng/mL) | Relative Standard Deviation (%CV) |
|---|---|---|---|
| 5 | 5.70 (114) | 0.277 | 4.86 |
| 50 | 54.6 (109) | 4.64 | 8.50 |
| 500 | 555 (111) | 64.5 | 11.6 |
Concentration values represent means (N = 5) of calculated concentrations of plasma QC samples after 21 days of storage at −80°C
Table III.
Silvestrol Freeze–Thaw Stability
| QC Sample (ng/ml) | Average Calculated Concentration, ng/mL (% accuracy) | Standard Deviation (ng/mL) | Relative Standard Deviation (%CV) |
|---|---|---|---|
| 5 | 4.13 (83) | 0.312 | 7.55 |
| 50 | 46.3 (93) | 3.21 | 6.94 |
| 500 | 544 (109) | 139 | 25.6 |
Concentration values represent means (N = 5) of calculated concentrations of plasma qc samples after 3 freeze–thaw cycles
To assess potential future use of silvestrol in pre-clinical rat toxicology studies or eventual use in human trials, room temperature stability was compared between mouse, rat, and human plasmas. Silvestrol stability in human plasma indicated results similar to mouse plasma with approximately 75% drug remaining after 4 h at room temperature (data not shown). However, in rat plasma, silvestrol was rapidly degraded and was undetectable after only 10 min. Further evaluation of plasma samples after silvestrol degradation revealed the formation of an ion at m/z 663. This ion was suspected to be the sodium adduct of silvestric acid, a derivative of silvestrol (see Fig. 1) wherein the C-2 methyl ester functionality is replaced by a carboxylic acid group. Use of purified silvestric acid as a standard confirmed its presence as the major metabolite in rat plasma. Relative quantitation of silvestrol and silvestric acid in the rat plasma samples after various times indicated silvestric acid reached a maximum concentration after 5 min of incubation (Fig. 5).
Fig. 5.

Silvestrol degradation and silvestric acid formation in rat plasma. Data show relative quantities of compound and metabolite normalized to the average response at 0 (silvestrol, black bars) or 30 (silvestric acid, gray bars) minutes. Error bars are SD from triplicate samples
Protein Binding
Measurement of bound fractions in human and mouse serum and plasma and in PBS with purified human albumin was completed using equilibrium dialysis. The data suggested moderate protein binding of silvestrol with 70–80% bound in human plasma and serum. A broader range was observed in mouse plasma and serum with approximately 44% and 77% bound in each, respectively. These levels were also reflected in PBS containing albumin with approximately 60–70% bound to human albumin at 2, 4, and 7 mg/dL. Table IV shows these results.
Table IV.
Silvestrol Protein Binding. Matrices were PBS with Human Albumin at Several Concentrations and Plasma and Serum from Human and Mouse
| Matrix | Concentration (mg/dL) | Bound (%) | |
|---|---|---|---|
| Human | Albumin | 2 | 62.8 ± 52.4 |
| 4 | 63.6 ± 16.6 | ||
| 7 | 68.3 ± 21.2 | ||
| Plasma | 75.6 ± 4.3 | ||
| Serum | 79.7 ± 24.4 | ||
| Mouse | Plasma | 43.8 ± 8.6 | |
| Serum | 77.0 ± 10.2 |
Table values are mean ± SD for triplicate determinations of percent bound silvestrol in equilibrium dialysis according to the equation presented in the text
Pharmacokinetics of HP-β-CD/Silvestrol
Concentrations of silvestrol in plasma samples obtained from silvestrol-treated mice could be accurately measured to 24 h after IP and IV dosing (5 mg/kg) and to 8 h after PO dosing (25 mg/kg). Concentration vs. time plots for these three routes of administration are displayed in Fig. 6. Maximum mean observed concentrations for the IV and IP routes were 1,574 ± 412 and 747 ± 276 nM, respectively, whereas the plasma Cmax for the PO route was significantly lower at 10 ± 2 nM.
Fig. 6.

Plasma concentration–time profiles of silvestrol. Data points are means + SD of silvestrol in mouse plasma after a IV and IP administration or b oral administration. IV (circles) and IP (triangles) doses were each 5 mg/kg, and oral (squares) doses were 25 mg/kg. N = 6 mice per time point
Of the compartment models evaluated, the IV data were best described by a three-compartment model and the IP data by a two-compartment model. Final PK parameters from IV fits were provided as initial estimates for the two-compartment IP model. Areas under the concentration vs. time curves (AUC0−∞) indicated similar results with IV and IP dosing, with each producing similar exposures (approximately 50 μM min). Summaries of non-compartmental parameter estimates are presented in Table V. Compartmental parameter estimates were similar to non-compartmental parameters and are therefore not presented.
Table V.
Silvestrol Non-compartmental PK Parameters
| Parameter | Units | IV | IP | PO |
|---|---|---|---|---|
| Dose | (mg/kg) | 5 | 5 | 25 |
| λ z | 1/min | 0.0015 | 0.006 | NA |
| Τ ½ λ z | min | 455.1 | 116.4 | NA |
| T max | min | 5 | 20 | 45 |
| C max | μmol/L | 1.648 | 0.709 | 10.8 |
| AUCalast | min μmol/L | 46.74 | 43.97 | 2.640 |
| AUC0-∞_obs | min μmol/L | 48.29 | 44.48 | NA |
| V z/F _obs | L/kg | 103.9 | 28.84 | NA |
| Cl/F _obs | L/min/kg | 0.158 | 0.172 | NA |
| F | 100 | 94 | 1.18 |
Table Values are non-compartmental model parameter estimates. λ z Elimination rate constant, Τ ½ λ z Elimination half life; T max time of C max; C max observed maximum concentration; AUC last area under the observed concentration–time curve; AUC 0−∞ sum of AUClast and predicted AUC beyond the last observed concentration; V z /F _obs estimated volume of distribution divided by F; Estimated Cl/F _obs clearance divided by F; F bioavailability = (AUCip/po,last/Doseip/po)/(AUCiv,last/5 mg/kg); NA estimate not available
aAUClast for PO dose was estimated to 8 h
Metabolic Profiling in Rat Liver S-9 Fractions and Microsomes
To evaluate metabolic stability of silvestrol, its degradation was measured in rat liver S9 fractions as well as in human, mouse, and rat microsomes (Fig. 7). Silvestrol was minimally affected by the phase I metabolic enzymes in the S9 rat liver fraction, with approximately 90% parent drug remaining after 150 min. The positive control dinitroanaline substrate, previously shown to be labile in rat liver S9 (16), was fully degraded within 30 min (data not shown). However, when silvestrol was incubated in active microsomes for 60 min with co-factors for phase I and phase II enzymatic reactions, silvestric acid was found to be the major and only metabolite. No silvestric acid was detectable in the silvestrol samples at 0 min or in the inactive microsomal fractions.
Fig. 7.
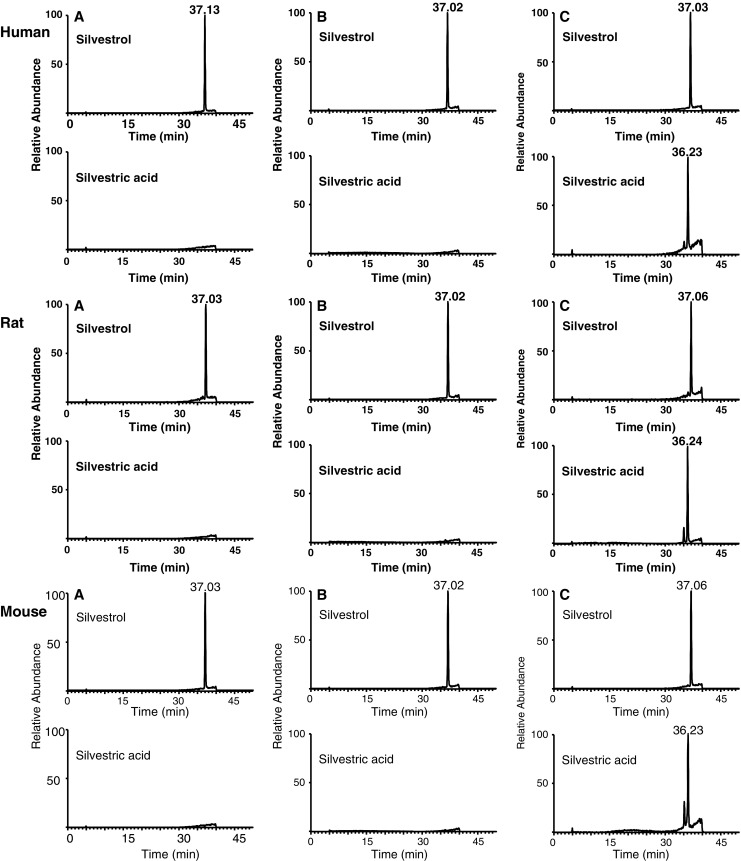
Metabolic profile of silvestrol in microsomes. Extracted ion chromatograms showing the abundance of silvestrol and silvestric acid in human, rat, and mouse microsomes. Silvestrol was incubated in: a functional microsomes for 0 min; b inactivated microsomes for 60 min; and c functional microsomes for 60 min
Cytotoxicity of Silvestric Acid
Since silvestric acid was the major metabolite identified from the in vitro metabolism studies, we further investigated the cytotoxicity of this metabolite. Silvestric acid was directly compared to silvestrol in an MTS assay using the silvestrol-sensitive 697 acute lymphoblastic leukemia cell line, as previously published (12). In sharp contrast to silvestrol, silvestric acid showed no cytostatic or cytotoxic effect using concentrations up to 250 nM and timepoints up to 72 h (silvestrol IC50 in 697 cells at 72 h < 5 nM; data not shown). This is consistent with previous work on silvestric acid using a small panel of human cancer cell lines (1).
Silvestrol Tissue Distribution
Tissue distribution of silvestrol was evaluated in five mice dosed intravenously with 5 mg/kg HP-β-CD/silvestrol and sacrificed 1 h after dosing. Silvestrol levels were determined in four tissues (brain, kidney, spleen, and liver). The silvestrol and silvestric acid levels in plasma and silvestrol levels in tissue samples were calculated against calibration curves of these analytes in the corresponding matrices. Silvestrol and silvestric acid were detected in plasma samples at comparable levels (433.7 ± 62.9 nM for silvestrol and 256.9 ± 73.1 nM for silvestric acid; Table VI). Since silvestric acid could not be recovered sufficiently from tissue using liquid–liquid or solid-phase extraction techniques, only silvestrol concentrations are reported in tissue samples. Silvestrol was found to be distributed in each of the four tissues tested. The lowest level was found in brain (130 ± 143 nmol/g tissue, n = 4). The highest level was found in liver (6,869 ± 3,126 nmol/g tissue, n = 5), and similar levels were found in spleen (2872 ± 923 nmol/g tissue, n = 5) and kidney (2502 ± 527 nmol/g tissue, n = 5). This very low silvestrol level in brain tissue is consistent with our observation that silvestrol is a substrate of P-glycoprotein (companion paper).
Table VI.
Distribution of Silvestrol in Mouse Plasma, Brain, Spleen, Kidney and Liver, and of Silvestric Acid (SA) in Plasma
| Sample ID | Plasma | Brain | Spleen | Kidney | Liver | |
|---|---|---|---|---|---|---|
| Silvestrol (nM) | SA (nM) | Silvestrol (nmol/g) | ||||
| 1 | 487 | 300 | NAa | 1,744 | 2,218 | 2,677 |
| 2 | 363 | 227 | 60.2 | 2,097 | 2,121 | 10,342 |
| 3 | 436 | 256 | 57.9 | 3,260 | 3,040 | 6,477 |
| 4 | 365 | 155 | 58.4 | 3,286 | 3,107 | 5,339 |
| 5 | 518 | 347 | 344 | 3,972 | 2,024 | 9,509 |
| Average ± SD | 434 ± 62.9 | 257 ± 73.1 | 130 ± 143 | 2872 ± 923 | 2502 ± 527 | 6869 ± 3126 |
aNot available: sample contaminated with blood, data not included
Discussion and Conclusions
The development and validation of a sensitive LC-MS/MS method for accurate quantification of silvestrol in mouse plasma is presented. Validation results indicate this method is accurate and precise between 1 and 1,000 ng/mL when two separate standard curves are applied to account for matrix effect suppression of signals in low concentration samples. The sensitivity of this assay enabled detailed characterization of silvestrol pharmacokinetics to 24 h post IV and IP dosing, and to 8 h following oral dosing. Additionally, this assay was used to evaluate silvestrol distribution into four tissues 1 h post IV dosing in mice. Modifications to the method also enabled in vitro stability assessments in liver and microsomal fractions as well as in mouse, rat, and human plasma.
Silvestrol pharmacokinetic properties are generally favorable, and concentrations previously shown to be active in vitro (LC50 ~ 7 nM) (12) were achievable at the 5 mg/kg dose using the HP-β-CD formulation through both IV and IP routes of administration. Importantly, systemic availability of the IP dose with this new formulation was 100%, supporting use of this formulation and route for further pre-clinical testing in mice. Silvestrol has previously been administered to mice using a PEG 400/Tween 80 vehicle (13,14), although the bioavailability in this formulation has not been reported. Previous in vivo experiments by Lucas and colleagues administered silvestrol IP using a saline/DMSO vehicle (12), which we subsequently determined to have a relatively low (~10%) systemic availability based on pilot studies (data not shown). Highly bioavailable formulations such as the water-soluble HP-β-CD formulation presented here will be an important component of future pre-clinical in vivo testing of silvestrol. Additionally, we demonstrate that oral bioavailability of silvestrol is extremely low. While this may suggest poor absorption or significant first-pass metabolism of silvestrol in the mouse, our laboratory work presented in a companion paper demonstrates that silvestrol is a substrate of the P-glycoprotein transporter, potentially explaining this observation. More detailed disposition, metabolism and mass balance studies, as well as permeability and transport studies, will be required to better understand these observations. Regardless, our data indicate that oral administration of silvestrol is unlikely to be effective at least in the mouse.
Validation data for stability in mouse plasma indicate minimal degradation of silvestrol in freezer storage, from freeze–thaw cycles or from short period incubations at room temperature. This plasma stability is further supported by the mouse pharmacokinetic data in which relatively high Cmax is achieved with both IV and IP dosing, demonstrating reasonable in vivo stability as well. The rapid conversion of silvestrol to silvestric acid in rat plasma, but not in rat liver S9 fraction or in human or mouse plasma, suggests silvestrol de-esterification may be specific to a plasma-localized esterase in rats. Additionally, silvestric acid was found to be the major and inactive metabolite of silvestrol in microsomes from human, mouse and rat.
Silvestrol is a potent natural product with demonstrated in vitro and in vivo efficacy, and induces tumor cell cytotoxicity through the direct inhibition of translation initiation. The therapeutic potential of inhibiting translation initiation is well-recognized through the extensive investigations of mTOR inhibitors. However, mTOR pathway inhibition has pleiotropic effects, and no agents are currently available that specifically and directly impact the assembly of the initiation complex. Silvestrol interferes with the productive association of eIF4A with eIF4F, and thus may therefore be a first-in-class cancer therapy with unique cytotoxic and chemosensitization properties. For these reasons, silvestrol’s anticancer efficacy is being actively evaluated in multiple tumor models. However, more research is needed to understand the properties of silvestrol in vivo. Our results indicate that silvestrol in an HP-β-CD formulation shows favorable pharmacokinetic characteristics in mice. Our development and validation of a sensitive LC-MS/MS assay will enable further detailed investigations of silvestrol distribution, metabolism, and transport to support dose and schedule optimization for further pre-clinical testing of this promising agent.
Acknowledgements
This work was supported by the U.S. National Cancer Institute [Contract N01-CM-52205 to KKC, P01-CA125066 to ADK, SPORE P50-CA140158 to MRG, and The Ohio State University Comprehensive Cancer Center Core Grant (P30-CA016058-35) supporting the Experimental Therapeutics Program and Pharmacoanalytical Shared Resource].
Footnotes
U.V.R. Vijaya Saradhi and Sneha V. Gupta contributed equally to this work.
Contributor Information
Mitch A. Phelps, Phone: +1-614-832-2547, FAX: +1-614-292-7766, Email: mitch.phelps@osumc.edu
Kenneth K. Chan, Phone: +1-614-292-8294, FAX: +1-614-292-7766, Email: chan.56@osu.edu
References
- 1.Hwang BY, et al. Silvestrol and episilvestrol, potential anticancer rocaglate derivatives from Aglaia silvestris. J Org Chem. 2004;69(10):3350–8. doi: 10.1021/jo040120f. [DOI] [PubMed] [Google Scholar]
- 2.King ML. X-Ray crystal-structure of rocaglamide, a novel antileukemic 1H-cyclopenta[b]benzofuran from Aglaia elliptifolia. J Chem Soc Chem Commun. 1982;20:1150–1151. doi: 10.1039/c39820001150. [DOI] [Google Scholar]
- 3.Trost BM, et al. An unusual oxidative cyclization—A synthesis and absolute stereochemical assignment of (−)-rocaglamide. J Am Chem Soc. 1990;112(24):9022–9024. doi: 10.1021/ja00180a081. [DOI] [Google Scholar]
- 4.Proksch P, et al. Chemistry and biological activity of rocaglamide derivatives and related compounds in Aglaia species (Meliaceae) Curr Org Chem. 2001;5(9):923–938. doi: 10.2174/1385272013375049. [DOI] [Google Scholar]
- 5.Kim S, et al. Potential of cyclopenta[b]benzofurans from Aglaia species in cancer chemotherapy. Anticancer Agents Med Chem. 2006;6(4):319–45. doi: 10.2174/187152006777698123. [DOI] [PubMed] [Google Scholar]
- 6.Gerard B, et al. Enantioselective synthesis of the complex rocaglate (−)-silvestrol. Angew Chem Int Ed Engl. 2007;46(41):7831–4. doi: 10.1002/anie.200702707. [DOI] [PubMed] [Google Scholar]
- 7.El Sous M, et al. Total synthesis of (−)-episilvestrol and (−)-silvestrol. Angew Chem Int Ed Engl. 2007;46(41):7835–8. doi: 10.1002/anie.200702700. [DOI] [PubMed] [Google Scholar]
- 8.Adams TE, et al. Total synthesis of the potent anticancer Aglaia metabolites (−)-silvestrol and (−)-episilvestrol and the active analogue (−)-4′-desmethoxyepisilvestrol. J Am Chem Soc. 2009;131(4):1607–16. doi: 10.1021/ja808402e. [DOI] [PubMed] [Google Scholar]
- 9.Meurer-Grimes, B.M., et al., Therapeutic compounds and methods U.S. Pat.,US 6710075 B2. 2004.
- 10.Mi Q, et al. Silvestrol regulates G2/M checkpoint genes independent of p53 activity. Anticancer Res. 2006;26(5A):3349–56. [PubMed] [Google Scholar]
- 11.Kim S, et al. Silvestrol, a potential anticancer rocaglate derivative from Aglaia foveolata, induces apoptosis in LNCaP cells through the mitochondrial/apoptosome pathway without activation of executioner caspase-3 or -7. Anticancer Res. 2007;27(4B):2175–83. [PMC free article] [PubMed] [Google Scholar]
- 12.Lucas DM, et al. The novel plant-derived agent silvestrol has B-cell selective activity in chronic lymphocytic leukemia and acute lymphoblastic leukemia in vitro and in vivo. Blood. 2009;113(19):4656–66. doi: 10.1182/blood-2008-09-175430. [DOI] [PMC free article] [PubMed] [Google Scholar]
- 13.Bordeleau ME, et al. Therapeutic suppression of translation initiation modulates chemosensitivity in a mouse lymphoma model. J Clin Invest. 2008;118(7):2651–60. doi: 10.1172/JCI34753. [DOI] [PMC free article] [PubMed] [Google Scholar]
- 14.Cencic R, et al. Antitumor activity and mechanism of action of the cyclopenta[b]benzofuran, silvestrol. PLoS ONE. 2009;4(4):e5223. doi: 10.1371/journal.pone.0005223. [DOI] [PMC free article] [PubMed] [Google Scholar]
- 15.Ramaswamy, B., et al. A dose-finding, pharmacokinetic and pharmacodynamic study of a novel schedule of flavopiridol in patients with advanced solid tumors. Invest New Drugs. 2010. Oct 12. doi:10.1007/s10637-010-9563-7. [DOI] [PMC free article] [PubMed]
- 16.George TG, et al. Antikinetoplastid antimitotic activity and metabolic stability of dinitroaniline sulfonamides and benzamides. Bioorg Med Chem. 2006;14(16):5699–710. doi: 10.1016/j.bmc.2006.04.017. [DOI] [PubMed] [Google Scholar]