Abstract
In this paper, we present 3D chemical shift anisotropy (CSA)/dipolar coupling correlation experiments, based on γ-encoded R-type symmetry sequences. The γ-encoded correlation spectra are exquisitely sensitive to the relative orientation of the CSA and dipolar tensors and can provide important structural and dynamic information in peptides and proteins. We show that the first-order (m = ±1) and second-order (m = ±2) Hamiltonians in the R-symmetry recoupling sequences give rise to different correlation patterns due to their different dependencies on the crystallite orientation. The relative orientation between CSA and dipolar tensors can be determined by fitting the corresponding correlation patterns. The orientation of 15N CSA tensor in the quasi-molecular frame is determined by the relative Euler angles, αNH and βNH, when the combined symmetry schemes are applied for orientational studies of 1H-15N dipolar and 15N CSA tensors. The correlation experiments introduced here work at moderate magic angle spinning frequencies (10-20 kHz) and allow for simultaneous measurement of multiple sites of interest. We studied the orientational sensitivity of γ-encoded symmetry-based recoupling techniques numerically and experimentally. The results are demonstrated on [15N]-N-acetyl-valine (NAV) and N-formyl-Met-Leu-Phe (MLF) tripeptide.
Introduction
Three-dimensional structures of peptides, proteins and protein assemblies at atomic-level resolution provide important clues for understanding their biological function. Solid-state nuclear magnetic resonance (SSNMR) is emerging as an important technique for structural elucidation of biological systems,1 and is particularly powerful for studies of large biopolymers, such as membrane proteins,2-8 amyloid fibrils,9-12 intact viruses,13, 14 and protein assemblies.15, 16 Even for globular, soluble proteins, SSNMR is becoming an essential structural tool since solid-state NMR observables inform about properties of the system at hand that are unavailable from solution measurements.17-26 For example, the anisotropic spin interactions, such as chemical shift (CS) and dipolar interactions, bear a wealth of information about the geometric and electronic structure of a wide variety of solid systems including organic polymers and proteins.18, 25-34 In MAS experiments, these anisotropic spin interactions are averaged out partially or completely by the rapid spinning of the sample around the fixed axis at “magic angle”. In order to measure and exploit these anisotropic interactions, SSNMR recoupling methods have been developed that restore the geometric and electronic structure information.35-49 Alternatively, anisotropic interactions can also be measured under static conditions; however, site resolution is limited in the solid powders, and for multiple sites in a system, it is advantageous to carry out such measurements on aligned samples.50-54
Among the numerous recoupling techniques,35-44, 55 one class of methods, developed by M. Levitt,56-59 employs a symmetry-based principle for the design of pulse sequences that are based on the use of rotor-synchronized radio-frequency (rf) fields in conjunction with magic angle spinning. There are two main symmetry-based pulse sequence classes, CNnv and RNnv, where the symbols N, n and v are small integers and are referred to as the symmetry numbers of the pulse sequence. The CNnv sequences are designed such, that no net rotation of the spin angular momenta is produced as the result of the rotor-synchronized train of radiofrequency pulses, the so-called the C blocks. In the RNnv sequences, a net rotation of the spin angular momenta by π around the x axis of the rotating frame is created. Comparing these two classes of symmetry-based sequences, the R-type sequences have more restrictive selection rules than the C-type sequences.40, 59, 60 The choice of any particular symmetry-based recoupling sequence depends on the tensorial interaction of interest and on the experimental conditions (i.e., the range of MAS frequencies and rf fields) available to the NMR spectroscopist.
Knowledge about the magnitude and orientation of the 15N chemical shift anisotropy (CSA) tensor is important for biological solids because it provides critical information on the primary/secondary structure, electrostatics, hydrogen bonding, solvation, and dynamics.54, 61, 62 Although the magnitudes of the three principal elements of the 15N CSA tensor can be measured easily with existing methods in non-single-crystalline solids under MAS conditions, these experiments do not provide any direct information about the orientation of the CSA tensor in the molecular frame. In contrast, for single crystalline solids, both the magnitude and orientation of the three principal elements of the CSA tensor can be determined by the NMR measurement.62 However, many interesting biological systems (e.g., membrane proteins, protein assemblies, and other biopolymers) cannot be prepared as single crystals, and therefore development of methods for determination of the orientation of the CSA tensor in such noncrystalline samples under MAS conditions (where the resolution and the sensitivity of the measurements is the highest) is becoming more and more important.
For orienting the 15N CSA tensor in the molecular frame, the three Euler angles (α, β, γ) are required, but there is no SSNMR approach for determining γ directly. However, since to an excellent approximation, the δzz principal component of the 15N CSA tensor lies in the peptide plane and the Euler angle γ is usually close to zero, it is reasonable to postulate that the orientation of 15N CSA tensor is determined by α and β in the quasi-molecular frame. Based on two- and three-dimensional experiments for correlating chemical shift and dipolar tensors, several methods have been proposed for characterization of the CSA tensor orientation in the quasi-molecular frame, and these methods have been applied successfully to a number of powder samples.50, 51, 63-68 PISEMA (Polarization Inversion Spin Exchange at the Magic Angle)66 and COAST-C721 (Combined offset and anisotropy stabilization)63 can be used to extract the orientation of the CSA tensor, however these types of experiments are performed under static or slow magic angle spinning conditions, making them suitable for studying only a single site of interest. For a system containing multiple sites, PISEMA or COAST-C721 suffer from peak overlap, interfering with the simultaneous determination of the relative orientations of 15N CSA tensors in a site-resolved manner.
In this work, we demonstrate a three-dimensional MAS NMR approach based on γ-encoded R-type symmetry sequences, in which dipolar and CSA interactions are re-introduced into the t1 and t2 indirect dimensions, respectively. The resulting correlation spectra are especially sensitive to the relative orientation of the CSA and dipolar tensors. The experiments introduced here work at moderate MAS frequencies (10-20 kHz) and yield orientational information simultaneously for multiple sites. The orientational sensitivity of γ-encoded symmetry-based recoupling techniques was studied numerically and experimentally. Results are demonstrated on [15N]-N-acetyl-valine (NAV) and N-formyl-Met-Leu-Phe (MLF) tripeptide.
Theoretical background: a γ-encoded symmetry-based recoupling approach
Consider a system of coupled S spins undergoing a mechanical rotation about a fixed axis. The spin Hamiltonian of such system in the presence of an rf pulse irradiation consists of the time-dependent rf Hamiltonian and the time-dependent internal Hamiltonian, and can be expressed as58, 60
| (1) |
| (2) |
with the quantum numbers l and λ indicating the rank of the spin interaction Λ with respect to spatial rotation and spin rotations, respectively. m (-l, -l+1, …, +l) and μ (-λ - λ+1, …, +λ) refer to the space and spin rotational component, respectively. The rotation of spins caused by the rf irradiation results in the internal Hamiltonian elements with μ ≠ 0. With the Magnus expansion of the effective Hamiltonian in the interaction frame, the first-order average internal Hamiltonian for t = 0∼τ is given by
| (3) |
The scaling factor due to the rf irradiation is expressed as
| (4) |
With the irradiation by the periodic RNnv symmetry pulses, the selection rules for the first-order average Hamiltonian satisfy the following equation:
| (4) |
with Zλ an integer with the same parity as λ. On the basis of the different rotational properties of the spin interactions, a given type of interaction can be recoupled selectively by designing the appropriate symmetry pulse sequences. Considering a symmetry-allowed spin Hamiltonian characterized by a particular set of quantum numbers {l, m, λ, μ}, the component of the spatial tensor in equation (3) has the following form:
| (6) |
| (7) |
The magnitude of each single component of the recoupled Hamiltonian is independent of the Euler angle γMR, and it is only the phase that is γMR-dependent. γ-encoding generally leads to a high recoupling efficiency in a powder and good discrimination of the recoupled spin interactions.40, 69, 70 In addition, γ-encoded recoupling methods are highly sensitive to the molecular orientation, since only the recoupled lineshape and the magnitude depend on two Euler angles, αMR and βMR, which in turn describe the molecular orientation in the rotor frame. Although the complete recoupled spin Hamiltonian usually contains several symmetry-allowed terms which result in a non- γ-encoded recoupled Hamitonian, it is possible to design the selection rules for each spatial quantum number associated with a single spin quantum number, thereby maintaining the entire recoupled Hamiltonian γ-encoded.
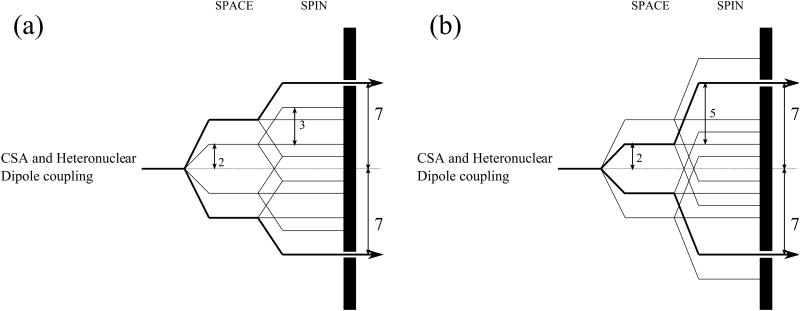
For example, the R1817 symmetry sequence suppresses the isotropic chemical shift, heteronuclear J-coupling and homonuclear dipolar interactions, but recouples the CSA and heteronuclear dipole-dipole interactions characterized by quantum numbers {l, m, λ, μ} = {2, 2, 1,-1} and {2, -2, 1, 1}.40 Since each spatial component is associated with only a single spin component, the spin Hamitonian recoupled by R1817 is γ-encoded. Figure 1 represents the selection properties for CSA and heteronuclear dipolar interactions in two other symmetry-based recoupling sequences, R1423 and R1425. As shown in Figure 1(a), the only Hamiltonian terms that are symmetry-allowed by R1423 are {l, m, λ, μ} = {2, 2, 1, -1} and {2, -2, 1, 1}. It therefore is a γ-encoded recoupling sequence with the same selection rules as R1817. The R1425 sequence exhibits different selection properties for the spin interactions with l = 2 and λ = 1. In R1425, the symmetry-allowed terms are {l, m, λ, μ} = {2, 1, 1, -1} and {2, -1, 1, 1}, and this sequence is also γ-encoded for recoupling of the CSA or heteronuclear dipolar interactions. At the same time, the spin Hamiltonian terms with quantum numbers {l, m, λ, μ} = {2, 2, 2, -2} and {2, -2, 2, 2} are also symmetry-allowed in R1425, indicating that it too is γ-encoded for recoupling the homonuclear dipolar interaction. R1425 therefore is a powerful sequence for the determination of heteronuclear dipolar or CSA interactions in systems with weak homonuclear dipolar interactions. In addition, R1425 provides higher scaling factors than R1423 and R1817.
Figure 1.
Space-spin selection diagrams for R1423 (a) and R1425 (b). (a) R1423 selects the components of the heteronuclear dipolar and CSA interactions with quantum numbers {l, m, λ, μ} = {2, 2, 1, -1} and {2, -2, 1, 1}, respectively. (b) R1425 selects the components of the heteronuclear dipolar and CSA interactions with quantum numbers {l, m, λ, μ} = {2, 1, 1, -1} and {2, -1, 1, 1}, respectively.
It is important to note that for the recoupling of the CSA interactions, the space-spin selections dictate which terms in the Hamiltonian will be recovered, and these selection rules are different for each specific symmetry-based sequence. The average CSA Hamiltonian in Equation (3) can be separated into three components, corresponding to the zeroth-order (m = 0), the first-order (m = ±1) and the second-order (m = ±2) terms according to the spatial rank number, respectively:69
| (8) |
| (9) |
| (10) |
Here the expressions for σ0, σ1, and σ2 depend on the crystallite orientation and the three principal values of the CSA tensor. It can be seen that the first-order and the second-order CSA Hamiltonian terms can be removed by sample spinning at the magic angle, and a sharp line is observed at σ0. However, rotor-synchronized pulse irradiation of correct symmetry would selectively recover the CSA Hamiltonian terms. According to the quantum numbers of the symmetry-allowed Hamiltonian terms, R1425 and R1423 can be referred to as the first-order σ1 and the second-order σ2 γ-encoded symmetry sequences, respectively. In this nomenclature, σ0, σ1, and σ2 are expressed as
| (11) |
| (12) |
| (13) |
| (14) |
| (15) |
Where the Euler angles (αPR, βPR, γPR) define the rotational transformation from the pincipal axis system (PAS) to the rotor fixed frame (RFF), and the principal element σii PAS (i = x, y, z) denotes the element of the chemical shift tensor in the PAS. σCOSi and σSINi (i = 1 and 2) are the projected elements of the ith-order CSA Hamiltonian (σi) in x′y′ plane of the RFF, δi denotes the projection angle of CSA Hamiltonian σi relative to the x′ axis of the RFF.
Experimental section
Materials
The 15N labeled N-acetyl-valine (NAV) and 13C,15N-labeled N-formyl-Met-Leu-Phe (MLF) tripeptide were purchased from Cambridge Isotope Laboratories. Both powder samples were packed into the MAS rotors for subsequent NMR experiments without any further purification or recrystallization.
NMR Experiments
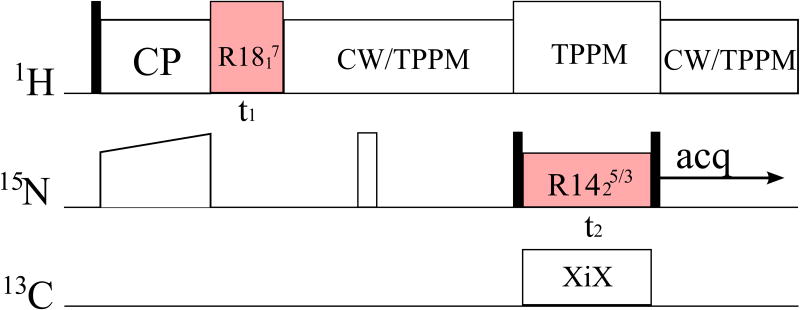
All NMR experiments were carried out on a TECMAG Discovery spectrometer operating at a resonance frequency of 400.49 MHz for 1H, 100.64 MHz for 13C, and 40.55 MHz for 15N. A 3.2 mm Varian triple-resonance probehead was used. The 3D pulse sequence that was used for correlating the dipolar and CSA tensors is displayed in Figure 2. All spectra were recorded at room temperature with a MAS frequency of 10 kHz. The typical 90° pulse lengths were 3.3 μs for 1H and 4.8 μs for 15N. The cross-polarization contact time was 1.0 ms, and the recycle delay was 3.0 s. Continuous wave (CW) 1H decoupling with an rf field strength of 76 kHz was performed during the acquisition period and the residual part of the rotational echo period. During the R1423/5 recoupling period, 1H TPPM decoupling with an rf field strength of 76 kHz and 13C XiX decoupling with an rf field strength of 69 kHz were carried out simultaneously. RF field strengths were 90 and 35 kHz for the R1817 and R1423/5 irradiation periods, respectively. The indirect dimensions (t1 and t2) of the 3D MAS experiments were incremented rotor-synchronously, by 100 μs and 200 μs, respectively. A total of 16 t1 and 32 t2 increments were used to record the 3D spectra, and 32 and 64 scans were accumulated for each increment, for N-acetyl-valine and N-formyl-Met-Leu-Phe, respectively. The data were processed by zero-filling and Fourier transformation in NMRPipe in a Mac environment. Zero-filling up to 256 points was performed in t1 and t2 dimensions, and line broadening of 100 Hz was applied in ω1 and ω2 during the processing.
Figure 2.
Pulse sequence for the three-dimensional CSA/DIP orientational correlation experiment. Solid and blank squares denote π/2 and π pulses, respectively. 1H-15N dipolar coupling and 15N CSA interactions are reintroduced by the γ-encoded symmetry sequences R1817 and R1425/3 in the indirect t1 and t2 dimensions, respectively.
Simulations of the NMR spectra
Numerical simulations of 1D and 2D NMR spectra were performed using the SIMPSON software package.71 986 ZCW angles (α, β) and 3 γ angles were used to generate a powder average. The 1H Larmor frequency was set as 400.5 MHz, and a MAS frequency of 10 kHz was used for all simulations. The applied RF field intensities were 90 and 35 kHz for R1817 and R1423/5 irradiation, respectively. NMR parameters that are required as an input for the program are H-N dipolar couplings and the components of the 1H and 15N chemical shift anisotropy tensor, δσ and η. 1H CSA with δσ = 8.9 ppm and η = 0.75 was used for all simulations. Since the C-N heteronuclear dipolar couplings are completely averaged out by the XiX decoupling, carbon spins were not considered in any of the simulations. In order to determine the accurate relative orientation between the tensors, identical acquisition and processing parameters were used as in the simulations and the NMR experiments.
For defining the chemical shift tensor we follow the Haeberlen-Mehring-Spiess convention, where the isotropic value δiso, the reduced anisotropy δσ, the anisotropy Ω, and the asymmetry parameter η, are related to the principal elements of the chemical shift tensor according to |δzz −δiso|≥|δxx −δiso|≥|δyy −δiso|, δiso =⅓(δxx + δyy +δzz), δσ = δzz −δiso = ⅔Ω., and η = (δyy−δxx)/(δzz −δiso).
Density Functional Theory Calculations
15N magnetic shielding anisotropy tensor calculations were performed in Gaussian0372 using the B3LYP functional73 and tzvp basis set.74 The atomic coordinates were taken from the solid-state NMR structure of MLF75 and used in the single-point calculations of the magnetic shielding anisotropy tensors without further geometry optimization. The calculated principal components of the magnetic shielding tensor, σii (i = 1, 2, or 3), were converted to the principal components of the chemical shift tensors, δii, using the relationship δii = σiso(ref) - σii, where σiso(ref) = 244.6 ppm is the absolute shielding for liquid ammonia at 25 °C.76
Results and Discussion
Simulated DIP/CSA Correlation Spectra
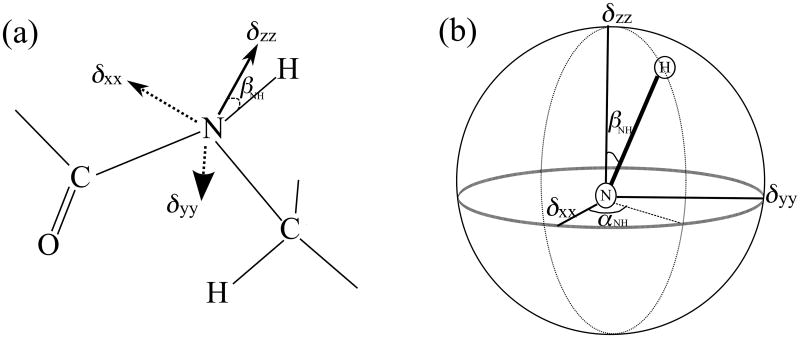
Figure 3 illustrates the orientation of the principal axes of the amide nitrogen CSA in the common molecular frame. Euler angles αNH and βNH determine the relative orientation between the 15N CSA and the 1H-15N dipolar tensors; this orientation yields important structural and dynamic information (i.e., torsion angle ϕ and backbone internal motional timescales in proteins). The relative orientation can be determined by correlating the H-N dipolar coupling, along the first indirect dimension ω1, and the chemical shift anisotropy of the amide nitrogen, along the second indirect dimension ω2. The 3D pulse sequence shown in Figure 2 was used to record such a 2D correlation spectrum extracted along the 15N isotropic chemical shift dimension. After the 1H-15N cross polarization, the 15N magnetization evolves during the t1 period under the R1817 Hamiltonian applied in the 1H channel; this Hamiltonian reintroduces the 1H-15N dipolar couplings and the 1H CSA interactions while suppressing the 1H-1H homonuclear dipolar couplings. Subsequently, the dipolar-modulated 15N magnetization is tilted into the longitudinal direction and is subjected to the rf pulse irradiation of the R1423 or R1425 symmetry.
Figure 3.
(a) Molecular structure of a peptide unit depicting the orientation of chemical shift tensor of the amide nitrogen in the molecular frame, defined by the N-H bond (z-axis) and the C-N-H peptide plane. (b) Euler rotations between the principal axis system (PAS) of the CSA tensor and the molecular frame. Euler angles αNH and βNH represent the orientation of the three principal elements of 15N CSA tensor in the peptide unit. The peptide plane contains the N-H bond and the δzz principal component of the 15N CSA tensor as shown in (b), with a zero Euler angle γ.
As discussed above, the R1423 sequence has the same space-spin selection pathways and the same scaling factors as R1817, where the 1H-15N/13C-15N heteronuclear dipolar couplings and the 15N anisotropic chemical shift interactions are reintroduced. In order to achieve pure 15N CSA interactions during the R1423 pulse train period, TPPM and XiX heteronuclear decoupling is applied to protons and carbons, respectively. Usually, for efficient 1H or 13C decoupling a decoupling rf field strength greater than twice the rf field strength of the R1423/5 element (3.5×ωR) is required. The R1425 symmetry sequence also recouples the 15N-15N homonuclear dipolar couplings while reintroducing the heteronuclear dipole-dipole and CSA interactions. It should be noted, however, that any effects of the 15N-15N dipolar couplings are negligible, given their small sizes (tens of Hertz). Therefore, the dipolar-modulated 15N magnetization nutates under σ1 or σ2 γ-encoded CSA Hamiltonian during t2, and is detected during t3 in the presence of 1H proton CW decoupling. The resulting 3D spectrum correlates 1H-15N dipolar couplings with the 15N CSA interactions in two dimensions, and, in the third dimension, the isotropic 15N chemical shift. Therefore it is easy to extract a 2D spectrum that correlates the dipolar and the CSA interactions along the 15N isotropic chemical shift.
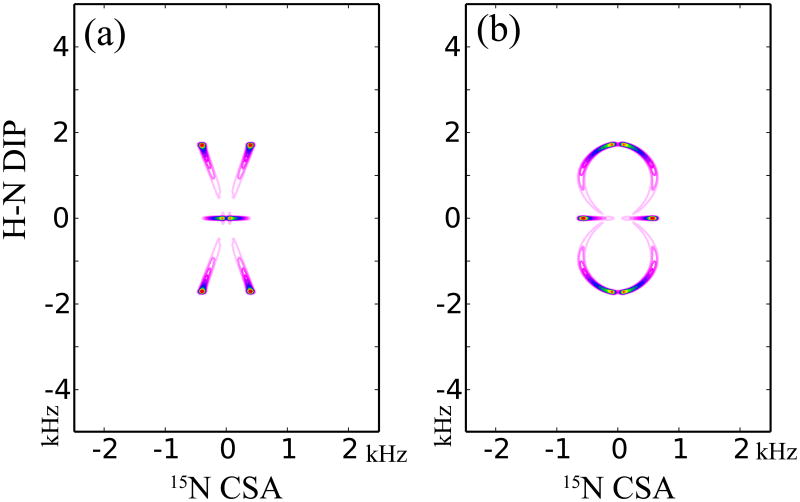
We analyzed the R-symmetry-based DIP/CSA correlation spectra for determining the relative orientation of the two tensors, using the SIMPSON simulation package. The simulated 2D DIP/CSA correlation spectra are shown in Figure 4 and correspond to different combined R-symmetry sequences. For both simulations, R1817 is used for recoupling the 1H-15N dipolar interactions, while R1425 and R1423 are employed for recoupling the 15N σ1 and σ2 CSA interactions as depicted in Figure 4a and 4b, respectively. To simulate the spectra, we constructed a molecular model consisting of two coupled (1H, 15N) spins with the same internal interaction parameters. For each spin, 1H-15N dipolar coupling and 1H (or 15N) chemical shift anisotropy tensors were included in the simulation. For the spectra shown in Figure 4, the principal frame of the 15N chemical shift tensor was coincident with that of the anisotropic 1H-15N dipole-dipole interaction, i.e., αNH = 0° and βNH = 0°. Due to the different orientational dependence in the σ2-CSA recoupled R1423 and σ1-CSA recoupled R1425, different correlation spectra result from these two recoupling sequences as demonstrated in Figure 4 (a) and (b), respectively, even though the same R18 sequence is used for the 1H-15N dipolar recoupling during t1 dimension.
Figure 4.
Simulated CSA/DIP correlation NMR spectra produced by combined symmetry-based sequences, R1817/R1423 (a) and R1817/R1425 (b). The CSA and dipolar tensors are assumed to be coincident in this simulation (αNH = 0° and βNH = 0°). 64 t1 increments and 128 t2 increments were used to generate the spectra.
Since the splitting of the recoupled lineshapes by γ-encoded R1817 and R1423/5 sequences depends greatly on the crystallite orientation in the laboratory frame (while the non γ-encoded recoupling schemes do not exhibit such orientational dependence), the 2D DIP/CSA correlation spectrum is sensitive to the relative orientation between the two tensors both in the crystalline and in the powder samples (simulated data are shown in the supporting information).
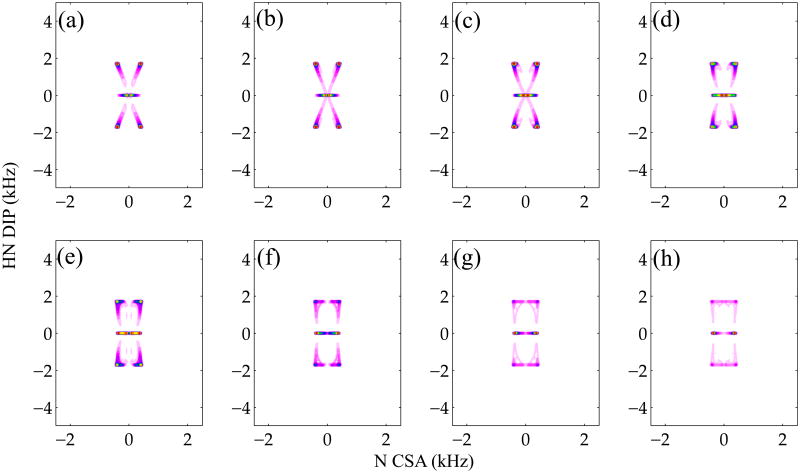
Figure 5 displays the simulated 2D R1817/R1423 DIP/CSA correlation spectra as the function of the relative tensor orientations; the corresponding R1817/R1425 spectra are shown in the Supporting Inforamation. From the series of these simulated spectra, it is clear that the powder lineshapes representing the DIP/CSA correlation are extremely sensitive to the orientation of the most deshielded element δzz relative to the N-H bond, represented by the Euler angle βNH. The Euler angle αNH affects the 2D correlation spectrum as well, but its effect on the lineshape is much less pronounced (simulated data shown in the Supporting Information). In all simulations, the δxx principal value of the CS A tensor is considered to lie in the Cα-N-H peptide plane (αNH = 0°). With the increase of the Euler angle βNH, the lineshape spreads over a larger frequency range. These simulated 2D correlation plots demonstrate that it should be possible to extract the relative orientation between the dipolar and CSA tensors from the corresponding experimental spectra.
Figure 5.
Simulated R1817/R1423 CSA/DIP spectra for different relative tensor orientations. In these simulations, the δxx principal value CSA is considered to lie in the Cα-N-H peptide plane (αNH = 0°), and the angle βNH between the H-N vector and the CSA δzz principal value was changed from 0 to 70 degrees with 10-degree increments from (a) to (h), respectively. 64 t1 increments and 128 t2 increments were used for each simulation. A powder average was generated with 986 ZCW angles and 3 γ angles.
Experimental DIP/CSA Correlation Spectra
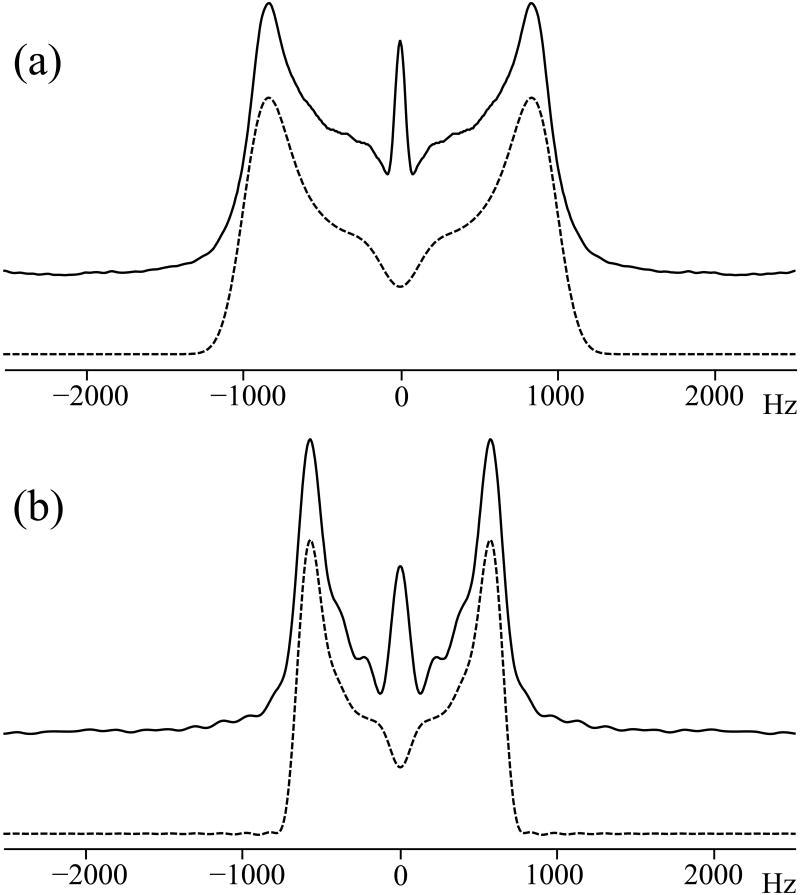
The applications of R1817 for determining heteronuclear dipolar couplings have been reported previously.26, 32, 40 However, the measurement of σ1 or σ2 CSA by R1423/5 has not yet been investigated. Figure 6 shows the simulated and the experimental 15N σ1 and σ2 CSA spectra of NAV generated by R1423/5 symmetry sequences using an RF field intensity of 35 kHz for R14 irradiation. It can be seen that the scaling factor for recoupling the σ1 CSA by R1425 is higher than that for recoupling the σ2 CSA by R1423, although the σ1 and σ2 CSA lineshapes are similar. The central peak in the experimental spectra is assigned to the effect of finite 15N relaxation times. The simulations yield a best-fit reduced anisotropy δσ of 103 ppm with an asymmetry parameter η of 0.25, and the simulated lineshapes agree well with the experimental spectra. These CSA parameters are also consistent with values reported previously.62, 77 Our results demonstrate that γ-encoded R1423/5 experiments can be performed to successfully determine the 15N CSA tensors, and that R1425 yields good accuracy in systems with weak homonuclear dipolar interactions (vide supra).
Figure 6.
Experimental (solid lines) and simulated (dashed lines) σ1 and σ2 CSA recoupled 15N NMR spectra of [15N]-N-acetyl-valine (NAV) generated by γ-encoded R1425 (a) and R1423(b) sequences, respectively. The sample was spun at an MAS frequency of 10 kHz. In both 2D experiments, 32 scans were accumulated for each t1 increment. A total of 32 t1 increments were used. The acquisition and processing parameters used in SIMPSON simulations were the same as those utilized in the corresponding NMR experiments. The best-fit simulated spectra were obtained with δσ = 103 ppm and η = 0.25.
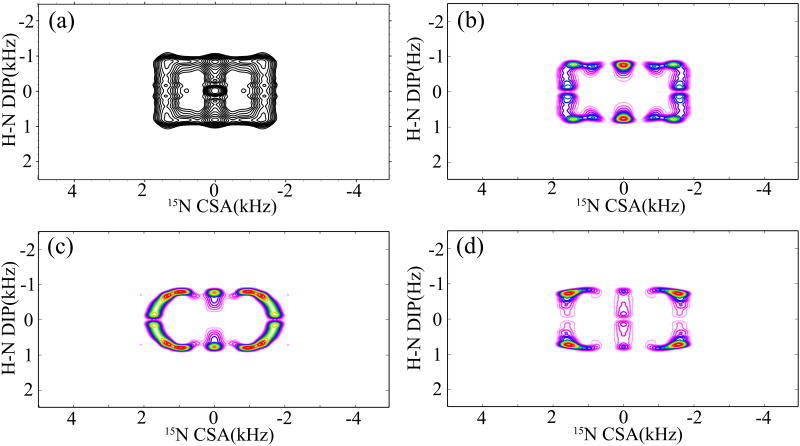
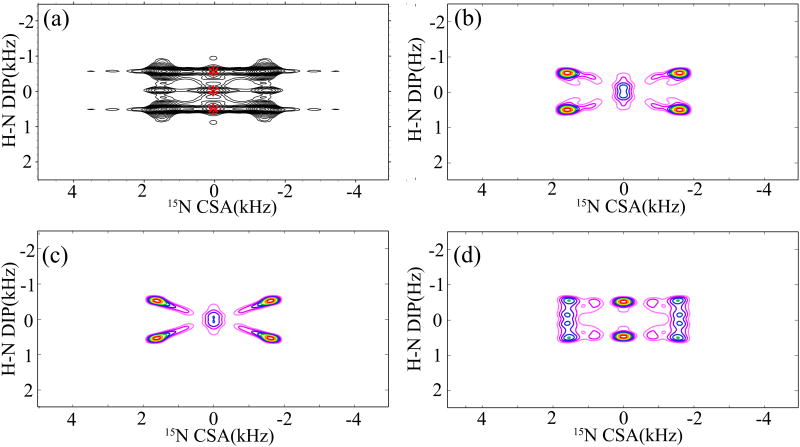
The experimental 1H-15N DIP/15N CSA 2D correlation spectra of NAV obtained with the combined R1817/R1423/5 symmetry sequences are shown in Figures 7 (a) and 8 (a), respectively. The 2D lineshapes were extracted from the 3D correlation experiment (vide supra) along the 15N isotropic chemical shift in the ω3 dimension. R1425 and R1423 were performed to reintroduce the 15N σ1- (Figure 7(a)) and σ2- (Figure 8(a)) CSA powder patterns, respectively. Consistent with the simulations discussed above, the experimental correlation spectra are different due to the different dependence of the lineshapes in each recoupling sequence on the relative tensor orientations. There also exists a central peak in the 2D correlation spectra arising from the 15N relaxation, and its contribution to the overall spectrum makes it difficult to extract the DIP/CSA cross peaks cleanly, as shown in Figure 8(a). In order to determine the relative orientation between the 15N CSA and 1H-15N dipolar tensors, a series of simulations are performed with Euler angles (α and β) monotonously increasing by 5°. Figures 7(b) and 8(b) show the best-fit simulated DIP/CSA correlation spectra for the 3D R1817/R1425 and R1817/R1423 sequences, respectively. The parameters used in the simulations, 1H-15N dipolar coupling (ωD(H-N) = 10.4 kHz) and the 15N CSA (δσ = 103 ppm and η = 0.25) were extracted from the simulated 1D R1817 dipolar and R1425 CSA patterns shown in Figure 6. For the R1817/R1425 experiment, the best-fit relative orientation was obtained for βNH(δzz) = 25°±5° and αNH(δxx) = 30°±5°. The best-fit simulated pattern was chosen visually, and the final error is estimated to be in range of ±5°. These angles establish unambiguously the orientation of 15N CSA tensor in the quasi-molecular frame. Similarly, the best-fit relative orientation (βNH(δzz) = 25°±5° and αNH(δxx) = 20°±10°) was obtained for the 3D R1817/R1423 experiment. The consistency of the relative tensor orientations extracted from the two independent experiments is encouraging and illustrates the accuracy of the current approach. Figure 7(c, d) and Figure 8(c, d) show the DIP/CSA correlation patterns for other relative orientations. The orientation of 15N CSA tensor in the molecular frame determined by the present NMR method agrees well with the previous reports.62, 77 As can be observed, the ridge patterns depend to a large degree on the orientation of δzz relative to the N-H bond, and it is clear that there is a unique orientation that is consistent with the NMR experiment. Here it should be noted that the librational and vibrational motions would give rise to reduced CSA and dipolar interactions,78 and this is commonly exploited in the studies of dynamics by CSA and dipolar recoupling techniques. These motions also add to the uncertainty in the experiments for measuring the relative orientation between CSA and dipolar tensors. A motionally averaged relative orientation would result in this case, especially for the system with librational motions where the relative orientation varies continuously over time.
Figure 7.
(a) 2D 15N CSA/1H-15N DIP correlation spectrum of N-acetyl-valine (NAV), extracted from the 3D R1817/R1425 experiment along the 15N isotropic chemical shift. The spectrum was recorded with 64 scans, 16 t1 and 32 t2 increments. The sample was spun at a MAS frequency of 10 kHz. (b) Best-fit simulated correlation spectrum, obtained with βNH(δzz) = 25°±5° and αNH(δxx) = 30°±10°, using the same acquisition and processing parameters as in the NMR experiment in (a). (c) Simulated correlation spectrum with βNH(δzz) = 0° and αNH (δxx) = 0°. (d) Simulated correlation spectrum with βNH(δzz) = 90° and αNH(δxx) = 0°.
Figure 8.
(a) 2D 15N CSA/1H-15N DIP correlation spectrum of N-acetyl-valine (NAV), extracted from the 3D R1817/R1423 experiment along the 15N isotropic chemical shift. The spectrum was recorded with 64 scans, 16 t1 and 32 t2 increments. The sample was spun at a MAS frequency of 10 kHz. (b) Best-fit simulated correlation spectrum, obtained with βNH(δzz) = 25°±5° and αNH(δxx) = 20°±5°, and the same acquisition and processing parameters as in the NMR experiment. (c) Simulated correlation spectrum with βNH(δzz) = 0° and αNH(δxx) = 0°. (d) Simulated correlation spectrum with βNH(δzz) = 90° and αNH(δxx) = 0°.
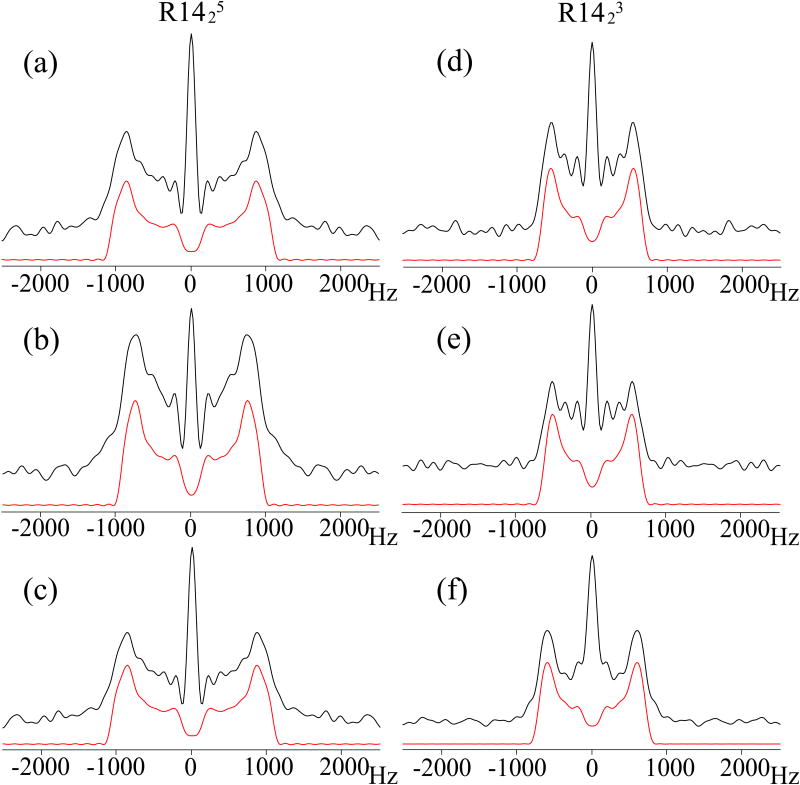
The present combined symmetry sequences can also be applicable for simultaneous determination of DIP-CSA relative tensor orientations for multiple sites of interest. Figure 9 shows the 15N σ1 and σ2 CSA recoupled NMR powder patterns of 13C,15N-enriched MLF tripeptide generated by γ-encoded R1423 and R1425 symmetry sequences; these powder patterns were extracted along the 15N isotropic chemical shifts of each residue. The 15N CSA parameters for each site can be derived from the experimental spectra using SIMPSON simulations. In Table 1, the best-fit 15N CSA experimental parameters for MLF generated by the R1423/5 symmetry-based recoupling sequences are compared with those obtained from quantum chemical calculations using DFT. It can be seen that the experimental 15N CSA parameters derived from the R1423/5 symmetry sequences generally agree with DFT computations very well. We note that there are small differences between the 15N σ1 and σ2 CSA parameters extracted from the two pulse sequences, which we attribute to the effect of the 15N relaxation on the central peak, as discussed above.
Figure 9.
15N σ1 and σ2 CSA recoupled NMR spectra of 13C, 15N N-formyl-Met-Leu-Phe (MLF) tripeptide, for Phe (a, d), Leu (b, e), and Met (c, f) residues. The spectra were recorded using R1425 (a - c) and R1423 (d - e) pulse sequences, respectively. The sample was spun at a MAS frequency of 10 kHz. The experimental spectra are shown in black, the best-fit spectra simulated in SIMPSON, in red. The best-fit chemical shift anisotropy δσ and asymmetry parameter η as well as the comparison with other experimental and computational results are presented in Table 1.
Table 1.
15N CSA parameters for each residue in 13C, 15N N-formyl-MLF: experimental derived from R1423/5 recoupling sequences and calculated using Density Functional Theory. The experimental and simulated σ1 and σ2 CSA powder patterns are shown in Figure 9.
| Residue | Method | δiso(ppm) | δσppm) | ησ |
|---|---|---|---|---|
| Met | R1425 | 125.5 | 107±1 | 0.33±0.01 |
| R1423 | 125.5 | 109±1 | 0.32±0.01 | |
| DFT: b3lyp/tzvp | 117.3 | 110.4 | 0.40 | |
|
| ||||
| Leu | R1425 | 116.2 | 93±1 | 0.34±0.01 |
| R1423 | 116.2 | 97±1 | 0.35±0.01 | |
| DFT: b3lyp/tzvp | 112.6 | 93.2 | 0.70 | |
|
| ||||
| Phe | R1425 | 107.6 | 101±1 | 0.32±0.01 |
| R1423 | 107.6 | 101±1 | 0.34±0.01 | |
| DFT: b3lyp/tzvp | 103.7 | 97.0 | 0.40 | |
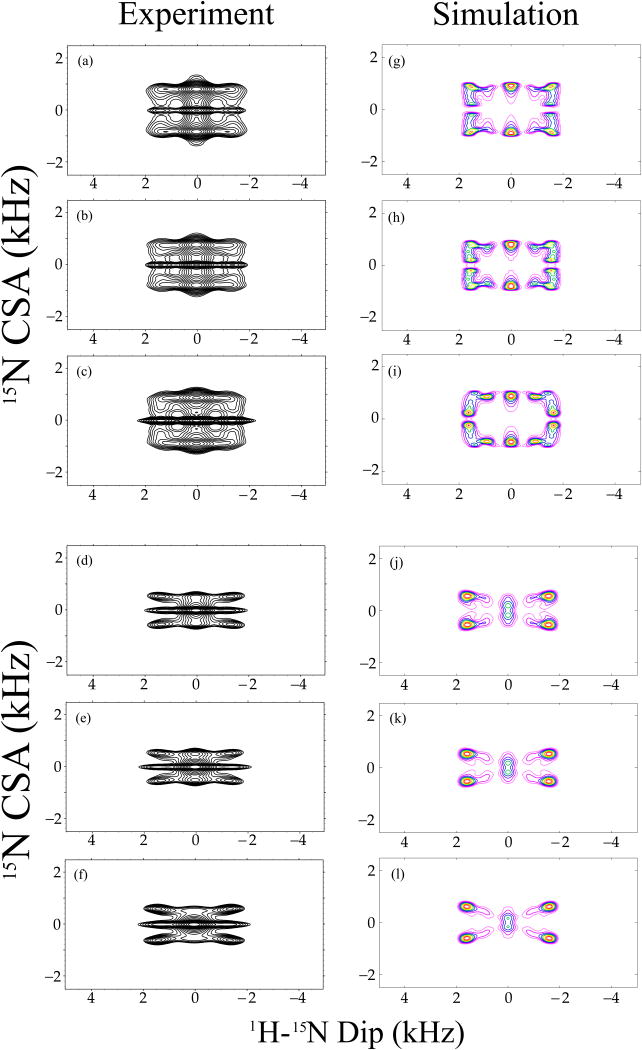
Three-dimensional R1817/R1423/5 experiments were also carried out on the MLF tripeptide for measuring the 15N CSA orientation for each residue, as shown in Figure 10 (a – f). As discussed above, R1817 and R1423 or R1425 are used for correlating the 1H-15N dipolar coupling and the 15N σ2 or σ1 CSA interactions, respectively. 2D DIP/CSA correlation spectra for each residue were extracted from these 3D data sets along the 15N isotropic chemical shift dimension (ω3). SIMPSON simulations were carried out to derive the relative 1H-15N dipolar and 15N CSA tensor orientations using the best-fit calculated 1H-15N dipolar coupling and the 15N CSA parameters for each site, as shown in Table 2. The simulated best-fit DIP/CSA correlation powder patterns for each residue are shown in Figure 10 (g – l). Table 2 also lists the parameters obtained experimentally and computed using DFT. The comparison of experimental and DFT-calculated 15N CSA parameters shown in Table 1, reveals that these are in good agreement, giving us confidence in both the experimental and computational methodologies. Although the 15N orientation information obtained by DFT using b3lyp/tzvp method is slightly different from that derived from the symmetry-based NMR measurement, the difference is within the experimental error (see Table 2). Our results demonstrate that the amide nitrogen of each residue in the MLF tripeptide has a similar CSA tensor orientation relative to the H-N-Cα plane. The most deshielded element of the amide 15N CSA tensor, δzz, is close to, but non-coincident with the H-N bond.
Figure 10.
Experimental (a-f) and simulated (g-l) 15N CSA/1H-15N dipolar correlation spectra of 13C, 15N N-formyl-Met-Leu-Phe (MLF) tripeptide, extracted from the corresponding 3D experiments along the 15N isotropic chemical shift for Phe (a, d), Leu (b, e) and Met (c, f) residues. 3D R1817/R1425 and R1817/R1423 pulse sequences were used to record the experimental (a - c) and (d - f) spectra, respectively, and the same sequences were employed to generate the simulated (g – i) and (j – l) spectra, respectively. The sample was spun at a MAS frequency of 10 kHz. 1H-15N dipolar and 15N CSA parameters used in the simulations were extracted from 1D R18 dipolar and 1D R14 CSA pattern simulations, and fixed during the calculations. The orientation of the 15N CSA relative to 1H-15N dipolar tensor was optimized. The best-fit relative orientations between the 1H-15N dipolar and 15N CSA are shown in Table 2.
Table 2.
The relative orientations between 1H-15N dipolar and 15N CSA tensors for each residue in 13C, 15N N-formyl-MLF: experimental derived from R1817/R1423/5 recoupling sequences and calculated using Density Functional Theory.
| Residue | Method | αNH (degrees) | βNH (degrees) |
|---|---|---|---|
| Met | R1817/R1423/5 | 20±10 | 20±5 |
| DFT: b3lyp/tzvp | 9.8 | 14.8 | |
|
| |||
| Leu | R1817/R1423/5 | 20±10 | 25±5 |
| DFT: b3lyp/tzvp | 6.3 | 14.7 | |
|
| |||
| Phe | R1817/R1423/5 | 10±10 | 35±10 |
| DFT: b3lyp/tzvp | 24 | 19 | |
The experiments discussed above are generally applicable to peptides and proteins. The time for the 3D experiments introduced in this work is similar to that required for any 3D experiments on uniformly enriched proteins, and therefore, the same sensitivity considerations apply. The protein samples have to be stable over extended periods of time (days and up to several weeks), and instrument stability (rf fields, temperature, MAS frequency) is highly important. With the rapid progress in hardware (probes), data collection and sample preparation protocols, such as fast-MAS technology,79-81 non-uniform sampling,82, 83 use of paramagnetically doped samples to reduce the 1H spin-lattice relaxation times and corresponding recycle delays without affecting other NMR observables,84 as well as proton detection6, 85 dramatic sensitivity enhancements are observed in multidimensional protein spectroscopy. A combination of these approaches enables 3D spectra to be detected in several hours rather than several days as we have seen in our laboratory (data to be reported elsewhere), making it possible to study very large and/or dilute proteins and protein assemblies. The information about the relative orientations of the CSA and dipolar tensors derived from the measurements introduced in this work is expected to be invaluable for accurate measurement of torsion angles, which in turn represent an important constraint in tertiary structure determination of peptides and proteins in the solid state.86, 87
Conclusions
In summary, combined R-symmetry sequences can be used to measure the relative orientations between the 1H-15N dipolar and 15N chemical shift anisotropy tensors. γ-encoded R1425 and R1423 symmetry sequences are used to reintroduce the first-order (σ1) and the second-order (σ2) CSA powder patterns, respectively. These sequences work best at moderate MAS frequencies, which is the regime most commonly used for structural and dynamics studies in uniformly and extensively isotopically enriched peptides, proteins and protein assemblies. Each of these symmetry-based recoupling blocks can be combined with the R1817 dipolar recoupling sequence to construct 2D dipolar/CSA correlation patterns. The ridges of these correlation spectra are very sensitive to the relative orientation between the two tensors. Since the dipolar and CSA principal components can be readily determined by independent measurements, the analysis of the spectral DIP/CSA correlation patterns is straightforward, with Euler angles βNH(δzz) and αNH(δxx) being the only variable parameters. The latter can be readily extracted from the numerical simulations of the spectra. Our results show that the βNH(δzz) angle has the highest sensitivity to correlation patterns. The central peaks due to the 15N relaxation contribute to the 1D/2D spectral lineshapes; these relaxation effects are necessary to be taken into account in the spectral simulations. Work is in progress on incorporating the effect of relaxation into the spectral simulations and on designing experiments that would minimize its influence on the experimental lineshapes. By incorporating a 15N isotropic chemical shift dimension into a 3D experiment, these sequences become applicable for simultaneous determination of multiple sites in peptides and proteins, and are expected to become a useful tool for measuring torsion angles, important constraints in protein structure determination in the solid state.
Supplementary Material
Acknowledgments
This work was supported by the National Institutes of Health (NIH Grants P50GM082251 from NIGMS, P20 RR-015588 and 5P20RR017716-07 from the NCRR) and is a contribution from the Pittsburgh Center for HIV Protein Interactions. We thank Olga Dmytrenko for help with the DFT calculations, and Lex Vega for multiple discussions.
Footnotes
Supporting Information: The recoupled lineshapes for different crystallite orientations in the laboratory frame produced by γ-encoded R1817 and R1423/5. The effect of the Euler angle αNH on the 2D DIP/CSA lineshapes for the simulated DIP/CSA correlation spectra acquired with the γ-encoded R1817 and R1423/5 pulse sequences. Simulated R1817/R1425 DIP/CSA correlation spectra for different relative tensor orientations.
References
- 1.McDermott A, Polenova T. Curr Opin Struct Biol. 2007;17:617–622. doi: 10.1016/j.sbi.2007.10.001. [DOI] [PubMed] [Google Scholar]
- 2.Huang L, McDermott AE. Biochim Biophys Acta. 2008;1777:1098–1108. doi: 10.1016/j.bbabio.2008.01.006. [DOI] [PubMed] [Google Scholar]
- 3.Hong M. Structure. 2006;14:1731–1740. doi: 10.1016/j.str.2006.10.002. [DOI] [PubMed] [Google Scholar]
- 4.Seidel K, Andronesi OC, Krebs J, Griesinger C, Young HS, Becker S, Baldus M. Biochemistry. 2008;47:4369–4376. doi: 10.1021/bi7024194. [DOI] [PubMed] [Google Scholar]
- 5.Ader C, Schneider R, Seidel K, Etzkorn M, Becker S, Baldus M. J Am Chem Soc. 2009;131:170–176. doi: 10.1021/ja806306e. [DOI] [PubMed] [Google Scholar]
- 6.Zhou DH, Shah G, Mullen C, Sandoz D, Rienstra CM. Angew Chem Int Ed Engl. 2009;48:1253–1256. doi: 10.1002/anie.200801029. [DOI] [PMC free article] [PubMed] [Google Scholar]
- 7.Nanga RP, Brender JR, Vivekanandan S, Popovych N, Ramamoorthy A. J Am Chem Soc. 2009;131:17972–17979. doi: 10.1021/ja908170s. [DOI] [PMC free article] [PubMed] [Google Scholar]
- 8.Shi L, Lake EM, Ahmed MA, Brown LS, Ladizhansky V. Biochim Biophys Acta. 2009;1788:2563–2574. doi: 10.1016/j.bbamem.2009.09.011. [DOI] [PubMed] [Google Scholar]
- 9.Tycko R. Quart Rev Biophys. 2006;39:1. doi: 10.1017/S0033583506004173. [DOI] [PubMed] [Google Scholar]
- 10.Wasmer C, Lange A, Van Melckebeke H, Siemer AB, Riek R, Meier BH. Science. 2008;319:1523–1526. doi: 10.1126/science.1151839. [DOI] [PubMed] [Google Scholar]
- 11.Jaroniec CP, MacPhee CE, Bajaj VS, McMahon MT, Dobson CM, Griffin RG. Proc Natl Acad Sci U S A. 2004;101:711–716. doi: 10.1073/pnas.0304849101. [DOI] [PMC free article] [PubMed] [Google Scholar]
- 12.Helmus JJ, Surewicz K, Nadaud PS, Surewicz WK, Jaroniec CP. Proc Natl Acad Sci U S A. 2008;105:6284–6289. doi: 10.1073/pnas.0711716105. [DOI] [PMC free article] [PubMed] [Google Scholar]
- 13.Shon KJ, Kim Y, Colnago LA, Opella SJ. Science. 1991;252:1303–1305. doi: 10.1126/science.1925542. [DOI] [PubMed] [Google Scholar]
- 14.Thiriot DS, Nevzorov AA, Zagyanskiy L, Wu CH, Opella SJ. J Mol Biol. 2004;341:869–879. doi: 10.1016/j.jmb.2004.06.038. [DOI] [PubMed] [Google Scholar]
- 15.Han Y, Ahn J, Concel J, Byeon IJ, Gronenborn AM, Yang J, Polenova T. J Am Chem Soc. 2010;132:1976–1987. doi: 10.1021/ja908687k. [DOI] [PMC free article] [PubMed] [Google Scholar]
- 16.Sun S, Siglin A, Williams JC, Polenova T. J Am Chem Soc. 2009;131:10113–10126. doi: 10.1021/ja902003u. [DOI] [PubMed] [Google Scholar]
- 17.Lorieau JL, McDermott AE. J Am Chem Soc. 2006;128:11505–11512. doi: 10.1021/ja062443u. [DOI] [PubMed] [Google Scholar]
- 18.Lorieau JL, Day LA, McDermott AE. Proc Natl Acad Sci U S A. 2008;105:10366–10371. doi: 10.1073/pnas.0800405105. [DOI] [PMC free article] [PubMed] [Google Scholar]
- 19.Mainz A, Jehle S, van Rossum BJ, Oschkinat H, Reif B. J Am Chem Soc. 2009;131:15968–15969. doi: 10.1021/ja904733v. [DOI] [PubMed] [Google Scholar]
- 20.Giraud N, Blackledge M, Goldman M, Bockmann A, Lesage A, Penin F, Emsley L. J Am Chem Soc. 2005;127:18190–18201. doi: 10.1021/ja055182h. [DOI] [PubMed] [Google Scholar]
- 21.Bockmann A, Juy M, Bettler E, Emsley L, Galinier A, Penin F, Lesage A. J Biomol NMR. 2005;32:195–207. doi: 10.1007/s10858-005-8073-y. [DOI] [PubMed] [Google Scholar]
- 22.Lesage A, Emsley L, Penin F, Bockmann A. J Am Chem Soc. 2006;128:8246–8255. doi: 10.1021/ja060866q. [DOI] [PubMed] [Google Scholar]
- 23.Wylie BJ, Sperling LJ, Frericks HL, Shah GJ, Franks WT, Rienstra CM. J Am Chem Soc. 2007;129:5318–5319. doi: 10.1021/ja0701199. [DOI] [PubMed] [Google Scholar]
- 24.Wylie B, Schwieters CD, Oldfield E, Rienstra C. J Am Chem Soc. 2009;131:985–992. doi: 10.1021/ja804041p. [DOI] [PMC free article] [PubMed] [Google Scholar]
- 25.Yang J, Tasayco ML, Polenova T. J Am Chem Soc. 2008;130:5798–5807. doi: 10.1021/ja711304e. [DOI] [PubMed] [Google Scholar]
- 26.Yang J, Tasayco ML, Polenova T. J Am Chem Soc. 2009;131:13690–13702. doi: 10.1021/ja9037802. [DOI] [PMC free article] [PubMed] [Google Scholar]
- 27.Baldus M. Prog Nucl Magn Reson Spectrosc. 2002;41:1–47. [Google Scholar]
- 28.Tycko R. Prog Nucl Magn Reson Spectrosc. 2003;42:53–68. doi: 10.1016/j.pnmrs.2023.10.001. [DOI] [PMC free article] [PubMed] [Google Scholar]
- 29.Ernst RR, Bodenhausen G, Wokaun A. Principles of nuclear magnetic resonance in one and two dimensions. Oxford University Press; New York: 1987. [Google Scholar]
- 30.Schmidt-Rohr K, Spiess HW. Multidimensional solid-state NMR and polymers. Academic Press; London; San Diego: 1994. [Google Scholar]
- 31.Franks WT, Zhou DH, Wylie BJ, Money BG, Graesser DT, Frericks HL, Sahota G, Rienstra CM. J Am Chem Soc. 2005;127:12291–12305. doi: 10.1021/ja044497e. [DOI] [PubMed] [Google Scholar]
- 32.Franks WT, Wylie B, Schmidt HL, Nieuwkoop AJ, Mayrhofer RM, Shah GJ, Graesser DT, Rienstra C. Proc Natl Acad Sci U S A. 2008;105:4621–4626. doi: 10.1073/pnas.0712393105. [DOI] [PMC free article] [PubMed] [Google Scholar]
- 33.Hohwy M, Jaroniec CP, Reif B, Rienstra CM, Griffin RG. J Am Chem Soc. 2000;122:3218–3219. [Google Scholar]
- 34.Kandasamy SK, Lee DK, Nanga RP, Xu J, Santos JS, Larson RG, Ramamoorthy A. Biochim Biophys Acta. 2009;1788:686–695. doi: 10.1016/j.bbamem.2008.11.009. [DOI] [PubMed] [Google Scholar]
- 35.Chan JCC, Tycko R. J Chem Phys. 2003;118:8378–8389. [Google Scholar]
- 36.Duma L, Abergel D, Ferrage F, Pelupessy P, Tekely P, Bodenhausen G. Chem Phys Chem. 2008;9:1104–1106. doi: 10.1002/cphc.200800053. [DOI] [PubMed] [Google Scholar]
- 37.Mehta MA, Eddy MT, McNeill SA, Mills FD, Long JR. J Am Chem Soc. 2008;130:2202–2212. doi: 10.1021/ja074244w. [DOI] [PubMed] [Google Scholar]
- 38.Schnell I. Prog Nucl Magn Reson Spectrosc. 2004;45:145–207. [Google Scholar]
- 39.Kehlet CT, Sivertsen AC, Bjerring M, Reiss TO, Khaneja N, Glaser SJ, Nielsen NC. J Am Chem Soc. 2004;126:10202–10203. doi: 10.1021/ja048786e. [DOI] [PubMed] [Google Scholar]
- 40.Zhao X, Eden M, Levitt MH. Chem Phys Lett. 2001;342:353–361. [Google Scholar]
- 41.Verel R, Ernst M, Meier BH. J Magn Reson. 2001;150:81–99. doi: 10.1006/jmre.2001.2310. [DOI] [PubMed] [Google Scholar]
- 42.Bennett AE, Weliky DP, Tycko R. J Am Chem Soc. 1998;120:4897–4898. [Google Scholar]
- 43.Fu R, Smith SA, Bodenhausen G. Chem Phys Lett. 1997;272:361–369. [Google Scholar]
- 44.Ernst M, Bush S, Kolbert AC, Pines A. J Chem Phys. 1996;105:3387–3397. [Google Scholar]
- 45.Wei YF, Lee DK, McDermott AE, Ramamoorthy A. J Magn Reson. 2002;158:23–35. doi: 10.1016/s1090-7807(02)00056-3. [DOI] [PubMed] [Google Scholar]
- 46.Lee DK, Wei YF, Ramamoorthy A. J Phys Chem B. 2001;105:4752–4762. [Google Scholar]
- 47.Wei YF, Lee DK, Ramamoorthy A. Chem Phys Lett. 2000;324:20–24. [Google Scholar]
- 48.Poon A, Birn J, Ramamoorthy A. J Phys Chem B. 2004;108:16577–16585. doi: 10.1021/jp0471913. [DOI] [PMC free article] [PubMed] [Google Scholar]
- 49.Chen L, Wang Q, Hu BW, Lafon O, Trebosc J, Deng F, Amoureux JP. Phys Chem Chem Phys. 2010;12:9395–9405. doi: 10.1039/b926546e. [DOI] [PubMed] [Google Scholar]
- 50.Lorigan GA, McNamara R, Jones RA, Opella SJ. J Magn Reson. 1999;140:315–319. doi: 10.1006/jmre.1999.1822. [DOI] [PubMed] [Google Scholar]
- 51.Nevzorov AA, Opella SJ. J Magn Reson. 2003;160:33–39. doi: 10.1016/s1090-7807(02)00138-6. [DOI] [PubMed] [Google Scholar]
- 52.Denny JK, Wang J, Cross TA, Quine JR. J Magn Reson. 2001;152:217–226. doi: 10.1006/jmre.2001.2405. [DOI] [PubMed] [Google Scholar]
- 53.Traaseth NJ, Shi L, Verardi R, Mullen DG, Barany G, Veglia G. Proc Natl Acad Sci U S A. 2009;106:10165–10170. doi: 10.1073/pnas.0904290106. [DOI] [PMC free article] [PubMed] [Google Scholar]
- 54.Lee DK, Wittebort RJ, Ramamoorthy A. J Am Chem Soc. 1998;120:8868–8874. [Google Scholar]
- 55.van Rossum BJ, de Groot CP, Ladizhansky V, Vega S, de Groot HJM. J Am Chem Soc. 2000;122:3465–3472. [Google Scholar]
- 56.Tycko R. J Chem Phys. 2007;126:064506. doi: 10.1063/1.2437194. [DOI] [PubMed] [Google Scholar]
- 57.Eden M. Chem Phys Lett. 2003;378:55–64. [Google Scholar]
- 58.Brinkmann A, Levitt MH. J Chem Phys. 2001;115:357–384. [Google Scholar]
- 59.Eden M, Levitt MH. J Chem Phys. 1999;111:1511–1519. [Google Scholar]
- 60.Carravetta M, Eden M, Zhao X, Brinkmann A, Levitt MH. Chem Phys Lett. 2000;321:205–215. [Google Scholar]
- 61.DeDios AC, Pearson JG, Oldfield E. Science. 1993;260:1491–1496. doi: 10.1126/science.8502992. [DOI] [PubMed] [Google Scholar]
- 62.Brender JR, Taylor DM, Ramamoorthy A. J Am Chem Soc. 2001;123:914–922. doi: 10.1021/ja001980q. [DOI] [PubMed] [Google Scholar]
- 63.Jurd APS, Titman JJ. Phys Chem Chem Phys. 2009;11:6999–7007. doi: 10.1039/b906814g. [DOI] [PubMed] [Google Scholar]
- 64.Andronesi OC, Pfeifer JR, Al-Momani L, Ozdirekcan S, Rijkers DT, Angerstein B, Luca S, Koert U, Killian JA, Baldus M. J Biomol NMR. 2004;30:253–265. doi: 10.1007/s10858-004-3452-3. [DOI] [PubMed] [Google Scholar]
- 65.Ishii Y, Terao T, Kainosho M. Chem Phys Lett. 1996;256:133–140. [Google Scholar]
- 66.Ramamoorthy A, Opella SJ. Solid State Nucl Magn Reson. 1995;4:387–392. doi: 10.1016/0926-2040(95)00054-t. [DOI] [PubMed] [Google Scholar]
- 67.Schmidt-Rohr K. J Am Chem Soc. 1996;118:7601–7603. [Google Scholar]
- 68.Yao XL, Hong M. J Am Chem Soc. 2002;124:2730–2738. doi: 10.1021/ja017137p. [DOI] [PubMed] [Google Scholar]
- 69.Nishiyama Y, Yamazaki T, Terao T. J Chem Phys. 2006;124:064304. doi: 10.1063/1.2141949. [DOI] [PubMed] [Google Scholar]
- 70.Lee YK, Kurur ND, Helmle M, Johannessen OG, Nielsen NC, Levitt MH. Chem Phys Lett. 1995;242:304–309. [Google Scholar]
- 71.Bak M. J Magn Reson. 2000;147:296–330. doi: 10.1006/jmre.2000.2179. [DOI] [PubMed] [Google Scholar]
- 72.Frisch MJ, Trucks GW, Schlegel HB, Scuseria GE, Robb MA, Cheeseman JR, Montgomery JA, Vreven T, Kudin KN, Burant JC, Millam JM, Iyengar SS, Tomasi J, Barone V, Mennucci B, Cossi M, Scalmani G, Rega N, Petersson GA, Nakatsuji H, Hada M, Ehara M, Toyota K, Fukuda R, Hasegawa J, Ishida M, Nakajima T, Honda Y, Kitao O, Nakai H, Klene M, Li X, Knox JE, Hratchian HP, Cross JB, Bakken V, Adamo C, Jaramillo J, Gomperts R, Stratmann RE, Yazyev O, Austin AJ, Cammi R, Pomelli C, Ochterski JW, Ayala PY, Morokuma K, Voth GA, Salvador P, Dannenberg JJ, Zakrzewski VG, Dapprich S, Daniels AD, Strain MC, Farkas O, Malick DK, Rabuck AD, Raghavachari K, Foresman JB, Ortiz JV, Cui Q, Baboul AG, Clifford S, Cioslowski J, Stefanov BB, Liu G, Liashenko A, Piskorz P, Komaromi I, Martin RL, Fox DJ, Keith T, Laham A, Peng CY, Nanayakkara A, Challacombe M, Gill PMW, Johnson B, Chen W, Wong MW, Gonzalez C, Pople JA. Gaussian 03, revision C.02. Gaussian, Inc.; Wallingford, CT: 2004. [Google Scholar]
- 73.Becke AD. J Chem Phys. 1993;98:5648–5652. [Google Scholar]
- 74.Schafer A, Horn H, Ahlrichs R. J Chem Phys. 1992;97:2571–2577. [Google Scholar]
- 75.Rienstra CM, Tucker-Kellogg L, Jaroniec CP, Hohwy M, Reif B, McMahon MT, Tidor B, Lozano-Perez T, Griffin RG. Proc Natl Acad Sci U S A. 2002;99:10260–10265. doi: 10.1073/pnas.152346599. [DOI] [PMC free article] [PubMed] [Google Scholar]
- 76.Jameson CJ, Jameson AK, Cohen SM, Parker H, Oppusunggu D, Burrell PM, Wille S. J Chem Phys. 1981;74:1608–1612. [Google Scholar]
- 77.Facelli JC, Pugmire RJ, Grant DM. J Am Chem Soc. 1996;118:5488–5489. [Google Scholar]
- 78.Hallock KJ, Lee DK, Ramamoorthy A. J Chem Phys. 2000;113:11187–11193. [Google Scholar]
- 79.Samoson A, Tuherm T, Gan Z. Solid State Nucl Magn Reson. 2001;20:130–136. doi: 10.1006/snmr.2001.0037. [DOI] [PubMed] [Google Scholar]
- 80.Ernst M, Meier MA, Tuherm T, Samoson A, Meier BH. J Am Chem Soc. 2004;126:4764–4765. doi: 10.1021/ja0494510. [DOI] [PubMed] [Google Scholar]
- 81.Samoson A, Tuherm T, Past J, Reinhold A, Anupold T, Heinmaa N. New Techniques in Solid-State NMR. 2005;246:15–31. doi: 10.1007/b98647. [DOI] [PubMed] [Google Scholar]
- 82.Rovnyak D, Frueh DP, Sastry M, Sun ZYJ, Stern AS, Hoch JC, Wagner G. J Magn Reson. 2004;170:15–21. doi: 10.1016/j.jmr.2004.05.016. [DOI] [PubMed] [Google Scholar]
- 83.Petkova AT, Baldus M, Belenky M, Hong M, Griffin RG, Herzfeld J. J Magn Reson. 2003;160:1–12. doi: 10.1016/s1090-7807(02)00137-4. [DOI] [PubMed] [Google Scholar]
- 84.Wickramasinghe NP, Shaibat M, Ishii Y. J Am Chem Soc. 2005;127:5796–5797. doi: 10.1021/ja042188i. [DOI] [PubMed] [Google Scholar]
- 85.Zhou DH, Shah G, Cormos M, Mullen C, Sandoz D, Rienstra CM. J Am Chem Soc. 2007;129:11791–11801. doi: 10.1021/ja073462m. [DOI] [PubMed] [Google Scholar]
- 86.Rienstra CM, Hohwy M, Mueller LJ, Jaroniec CP, Reif B, Griffin RG. J Am Chem Soc. 2002;124:11908–11922. doi: 10.1021/ja020802p. [DOI] [PubMed] [Google Scholar]
- 87.Chan JCC, Tycko R. J Am Chem Soc. 2003;125:11828–11829. doi: 10.1021/ja0369820. [DOI] [PubMed] [Google Scholar]
Associated Data
This section collects any data citations, data availability statements, or supplementary materials included in this article.


