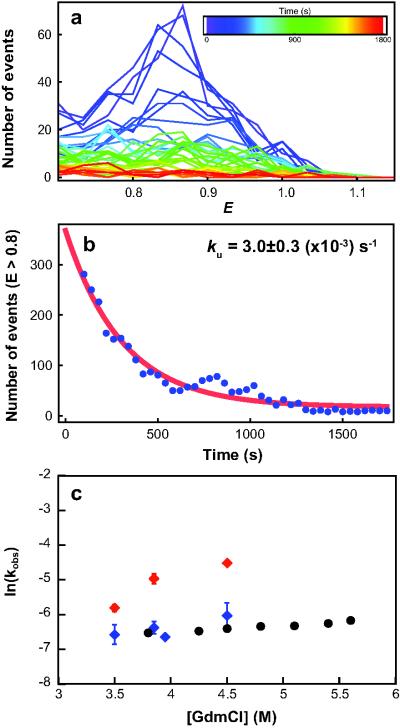
Figure 3.
Unfolding Kinetics. (a) Evolution of transfer efficiency histograms over time (E ≥ 0.7) from single-molecule double-jump experiments in which refolded/misfolded I27-I27 (doubly-labelled) was unfolded in 3.5 M GdmCl. Histograms were constructed for a moving window of 120s that was shifted by 30s for each increment (inset, colour key). (b) The number of events with E > 0.8 for each histogram in (a) was summed and the resulting kinetics fitted with a single exponential decay. The rate constants are unaffected by different window sizes or the use of non-overlapping windows. (c) Unfolding rate constants for I27wt monomer (black) (ensemble data from12)*, and for the misfolded and natively folded states of I27-I27 from single-molecule measurements (red and blue, respectively). The error bars represent the standard error of the fit (see Methods). Note that for some data points the error bars are smaller than the symbols. *I27 domains have the same unfolding rate constants in tandem repeat proteins as in isolated domains.

