

Abstract
Gap junctions containing connexin 36 electrically couple interneurons in many brain regions and synchronize their activity. We used connexin-36 knock-out mice (Cx36−/−) to study the importance of electrical coupling between interneurons for spatial coding in the hippocampus and for different forms of hippocampus-dependent spatial memory. Recordings in behaving mice revealed that the spatial selectivity of hippocampal pyramidal neurons was reduced and less stable in Cx36−/− mice. Altered network activity was reflected in slower theta oscillations in the mutants. Temporal coding, assessed by determining the presence and characteristics of theta phase precession, had different dynamics in Cx36−/− mice compared with controls. At the behavioral level, Cx36−/− mice displayed impaired short-term spatial memory but normal spatial reference memory. These results highlight the functional role of electrically coupled interneurons for spatial coding and cognition. Moreover, they suggest that the precise spatial selectivity of place cells is not essential for normal performance on spatial tasks assessing associative long-term memory.
Introduction
GABAergic interneurons control and synchronize network activity (Cobb et al., 1995; Cardin et al., 2009). In vitro and modeling studies have been instrumental in suggesting mechanisms that enable interneurons to exert this function (Whittington and Traub, 2003). As predicted, mice with reduced inhibitory input onto interneurons exhibited abnormal synchronization of hippocampal neurons at theta frequency (6–10 Hz) in vivo (Wulff et al., 2009). Moreover, diminishing excitatory currents onto defined interneurons results in altered gamma oscillations and impaired memory (Fuchs et al., 2007; Belforte et al., 2010; Korotkova et al., 2010).
In several brain regions, gap junctions between interneurons promote subthreshold and suprathreshold synchronization of neuronal activity (Galarreta and Hestrin, 1999; Gibson et al., 1999; Koós and Tepper, 1999; Tamás et al., 2000). The molecular substrate of these gap junctions in the rodent forebrain is connexin 36 (Cx36) (Condorelli et al., 1998; Söhl et al., 1998), which is predominantly expressed in interneurons in adult mice (Bennett and Zukin, 2004; Connors and Long, 2004). Ablation of Cx36 results in a loss of gap junctions between fast-spiking interneurons in the hippocampus and the cortex and interferes with oscillatory activity (Deans et al., 2001; Hormuzdi et al., 2001; Buhl et al., 2003).
Although the importance of interneurons in network oscillations is well documented, their role in shaping information processing by principal cells has not been studied extensively. In the hippocampus, pyramidal cells, often referred to as place cells, fire only when an animal is at one or few locations in space (O'Keefe and Dostrovsky, 1971). Given the sparse firing of place cells and the high firing rate of several interneurons, place cell firing is probably under strict control of inhibitory interneurons. Moreover, some interneurons vary their firing rate depending on the animal's position, suggesting a role for interneurons in spatial coding (Maurer et al., 2006; Ego-Stengel and Wilson, 2007; Wilent and Nitz, 2007; Hangya et al., 2010). Place cells encode spatial information also by varying the timing of their action potentials relative to theta oscillations (O'Keefe and Recce, 1993; Skaggs et al., 1996; Harris et al., 2002; Huxter et al., 2003). As the animal moves through the field of a place cell, action potentials occur at progressively earlier theta phases, a phenomenon termed theta phase precession. Interneurons could be involved in the precise timing of action potentials to different phases of theta oscillations (Maurer et al., 2006; Ego-Stengel and Wilson, 2010). Indeed, a physiological implementation of the soma–dendrite interference model of theta phase precession suggests that inhibitory inputs onto pyramidal cells are essential to reproduce certain features of theta phase precession (Losonczy et al., 2010).
Here, we investigated the contribution of electrical coupling between GABAergic interneurons to spatial and temporal coding by hippocampal pyramidal cells and to hippocampus-dependent spatial memory. We used Cx36−/− mice, in which the main perturbation resides in the lack of electrical coupling between interneurons, leaving the excitatory and inhibitory synapses onto interneurons unaffected.
Materials and Methods
Subjects.
Behavioral testing and in vivo recordings were conducted in age-matched, male Cx36−/− mice and wild-type littermates with a C57BL/6 background. Mice were kept on a 12 h light/dark schedule with testing being performed during the light phase. All mice were 3–6 months old at the time of the experiments. At this age, no electrical coupling between hippocampal interneurons was observed in mutants (Hormuzdi et al., 2001). All experiments were conducted by operators who were blind to the genotype of the mice.
Tetrode implantation.
Naive mice were implanted with four to six independently moving tetrodes under anesthesia (isoflurane, 1.0–2.5%). Tetrodes were constructed by twisting together four 12-μm-diameter tungsten wires (H-Formvar insulation with Butyral bond coat; California Fine Wire). These tetrodes were mounted into microdrives enabling independent movement. During surgery, holes centered above the dorsal hippocampus (2.2 mm posterior and 1.8 mm lateral to bregma) were drilled. The dura mater was removed and the tetrodes were inserted 0.5 mm into the neocortex. Two stainless steel screws were implanted into the bone above the cerebellum and served as reference and ground signals.
Electrophysiological recordings.
After a recovery period of 1 week, the tetrodes were lowered into the CA1 region of the hippocampus over a period of ∼10 d. Electrophysiological data were collected from the CA1 pyramidal cell layer. Tetrodes were considered to be located in the pyramidal cell layer only if fast ripples (125–250 Hz) were observed during periods of immobility. Electrode placement was subsequently confirmed by histological analysis. After each recording session, the tetrodes were moved down ∼25–50 μm.
Channel unity-gain preamplifier head stages (TLC2274C; Texas Instruments) were used to reduce cable movement artifacts. The electrophysiological signal was amplified (1000×), filtered (bandpass from 1 Hz to 10 kHz; MCP Plus signal conditioner; Alpha Omega), and acquired continuously at 20 kHz (Alpha-Map; Alpha Omega).
Two light-emitting diodes were attached to the head stage to track the position of the animal during recording. The video signal from a camera mounted on the ceiling was analyzed by a custom-made position tracking system, which saved the position of the light-emitting diodes at 25 Hz. The resolution of the camera was 6 pixels/cm.
Behavioral paradigm for electrophysiological recordings.
After a recovery period of 1 week, mice were maintained at 85–90% of their free-feeding weight before being trained to forage for food in two different environments. These could be two different open fields (40 × 50 × 40 cm high or 70 × 70 × 30 cm high) or one open field (70 × 70 × 30 cm high) and a zigzag maze (Derdikman et al., 2009; Royer et al., 2010) (see Fig. 1A,C). The zigzag maze was used because it constrains the mouse to a single movement path, thereby simplifying the analysis of theta phase precession. For all but one subject, the zigzag maze consisted of five 7-cm-wide, adjacent alleys. Each alley was 65 cm long, and the walls were 20 cm high. The walls separating the alleys were 58 cm long, leaving a 7-cm-wide passage between the alleys. One control mouse was trained on a zigzag maze with four 7-cm-wide alleys. The open fields and the zigzag mazes were made of wood painted dark gray.
Figure 1.

Impaired spatial representations in Cx36−/− mice during open-field exploration and zigzag maze running. A, Four place firing rate maps of pyramidal cells recorded during open-field exploration in a control (top) and Cx36−/− (bottom) mouse. The number above each map indicates the maximum firing rate (Max Fr.) in the map. The picture above shows the 70 × 70 cm open field in which the place cells were recorded. B, Spatial information, spatial sparsity, and place field size as a proportion of the open-field area for pyramidal cells of control and Cx36−/− mice. C, Left, Place firing rate maps of pyramidal cells of a control and a Cx36−/− mouse recorded as the mouse ran on the zigzag maze. The firing maps are plotted separately according to the running direction of the mouse (upward or downward). Right, Linear firing maps for the same pyramidal cells as the mouse ran on the zigzag maze. The filled and dotted lines represent the firing rate of the neurons as the mouse ran toward the two different ends of the track. D, Spatial information, linear place field size, and mean number of fields per pyramidal cell in control and Cx36−/− mice. *p < 0.05, **p < 0.01, ***p < 10−10.
For familiarization to the open fields, mice received two 10-min daily sessions during which food crumbs were delivered every 20–40 s. This was repeated for a period of 5 d. For the subsequent days, mice were connected to the recording system before being placed in the open field for training. Food crumbs were delivered every 20–40 s at random locations. Training continued until the mice explored readily the entire open field.
For familiarization to the zigzag maze, a mouse was first placed in the maze with food available at random locations for two 10-min daily sessions. On subsequent days, the food rewards were moved progressively away from the center of the maze until they were only available at the two ends of the maze. The mouse had to run from one end to the other to obtain food rewards. Mice were trained for ∼14 d, or until they ran from one end to the other without much hesitation.
A recording session consisted of a series of nine 20-min trials, starting with a rest trial and then alternating between foraging and rest trials. Two different environments were used for the foraging trials, following an ABAB protocol. For some animals, A and B were two different open fields. For others, A and B consisted of the zigzag maze and the 70 cm square box. During rest trials, mice were placed in a small rest box (23 × 25 × 30 cm high) for 20 min.
Analysis of electrophysiological data.
The analysis was performed offline with C/C++ programs and shell scripts on computers running a GNU/Linux operating system (Fedora 12). Spikes were extracted from the digitally bandpass filtered (0.8–5 kHz) signal, and their features were obtained using principal components analysis (Csicsvari et al., 1999). Spikes were separated into putative individual neurons via automatic clustering software (http://klustakwik.sourceforge.net/), before being manually refined using a graphical cluster cutting program. Only clusters that were stable for the duration of the recording session and with clear refractory periods (>2 ms) in their spike time autocorrelation were used for subsequent analysis. Pyramidal cells and interneurons were discriminated by their autocorrelations, firing rates, and wave forms, as described previously (Csicsvari et al., 1999). The quality of cluster isolation was quantified by calculating the isolation distance for each cluster (Harris et al., 2001; Schmitzer-Torbert et al., 2005). The isolation distance is defined as the Mahalanobis distance in 12-dimensional space from the identified cluster within which as many spikes belong to the specified cluster as to others.
Spatial properties of neurons during open-field exploration.
To be included in the spatial analysis of a foraging trial, pyramidal cells needed to fire at least 300 spikes during the trial. Comparison of the spatial selectivity of neurons was performed separately on the first and second trial in an environment. Firing rate maps were constructed by dividing the recording environment into 2 × 2 cm bins. Only periods for which the mouse was running faster than 3 cm/s were used to construct the maps. The time spent in every bin was first calculated, and the resulting occupancy map was smoothed with a Gaussian kernel function (kernel SD of 3 cm). The firing rate map of each cell was calculated by dividing the number of spikes emitted in a given bin by the time spent there. The firing rate maps were smoothed as described above. A place field was defined as 10 or more adjacent bins for which at least one bin had a firing rate >5 Hz and the firing rate in the other bins was >20% of the highest firing rate. Two measures were used to quantify the spatial selectivity of neurons: spatial information score and sparsity of firing (Skaggs et al., 1996). Place field stability was measured by correlating rate values of corresponding bins from the firing rate maps of two 20-min trials in the same environment (Muller et al., 1987).
Spatial properties of neurons on the zigzag maze.
Firing rate maps for trials on the zigzag maze were constructed using the same method as for the open-field trials. Also, the two-dimensional position data were transformed into one dimension. This was done by finding the linear vectors that best represented the path of the mouse on the maze. Each alley was represented by one vector and the turning points by two shorter vectors. For each position sample, the point on these vectors that was closest to the two-dimensional position of the animal was found. The summation of the length of the vectors from one end of the zigzag maze until this point represented the current linear position of the mouse. The runs toward each end of the maze were treated separately. Linear firing rate maps were calculated using the same procedure and parameters as for the two-dimensional firing rate maps (2 cm bins, smoothing kernel SD of 3 cm), with the exception that the data were unidimensional. A linear place field was defined as a portion of the maze containing a bin with a firing rate >5 Hz and extended in both directions until the firing rate dropped <20% of the bin with the highest firing rate. Different fields from the same cell were treated separately.
Theta detection and theta modulation of cell activity.
Theta oscillations were detected on each tetrode located in the CA1 pyramidal cell layer. The signal was bandpass filtered at delta (2–4 Hz) and theta (6–10) frequency by applying a fast Fourier transform (Frigo and Steven, 2005) and multiplying the output by a Butterworth filter function. The power of the filtered signal (root mean square) was calculated for each 500 ms window. Theta epochs were defined as windows with a theta/delta power ratio >2. Within these epochs, the raw signal was filtered at 5–14 Hz, and five points were identified for each cycle: positive-to-negative zero-crossing, trough, negative-to-positive zero-crossing, peak, and positive-to-negative zero-crossing. The five detected points were assigned phases 0, 90, 180, 270, and 360, respectively. The firing phase of spikes was linearly interpolated between these points.
The theta phase of spikes in the current experiment was calculated based on theta oscillations recorded from the tetrode on which the spikes were detected. Consequently, if the phase of theta oscillations varies widely across tetrodes, this could add variability to the data when neurons recorded from different tetrodes are pooled for population analysis. We therefore investigated whether theta oscillations recorded on different tetrodes had a similar phase. To estimate the theta phase shift between tetrodes, we calculated the cross-correlation of the signals for all pairs of simultaneously recorded tetrodes. For each pair, one channel was selected from each tetrode and the two signals were bandpass filtered (5–14 Hz). The cross-correlation of the signals was computed for theta epochs longer than 500 ms. The time lag between −70 and 70 ms associated with the maximum value in the cross-correlation was taken as the theta phase shift between the two tetrodes.
A mean theta wave form was calculated for each recording session. Six-hundred-millisecond time windows starting at the beginning of each theta cycle were averaged. Only theta cycles found within theta epochs of at least 1 s were considered. This calculation was performed for each tetrode in the CA1 pyramidal layer and then averaged across tetrodes. Power spectra of theta epochs were computed by using multitapper estimators (Press et al., 2007). Power spectra were also calculated separately for periods when the mouse was running at different speed during the foraging trials. When the power spectra were used to calculate the peak theta frequency, they were smoothed using a Gaussian kernel (SD of 0.15 Hz). The intrinsic firing frequency of pyramidal cells was estimated by calculating the spike time autocorrelation for each cell (2 ms time bin) (O'Keefe and Recce, 1993; Geisler et al., 2007). Only spikes emitted when the mouse was running faster than 3 cm/s were used in this analysis. The spike time autocorrelation histogram was smoothed (kernel SD of 6 ms), and the frequency with the highest count between 5 and 12 Hz (or 83.3 and 200 ms) was taken as the cell intrinsic oscillation frequency.
The firing rate modulation by theta oscillations was estimated for each cell by calculating a mean vector length (Fisher, 1995). The theta phase of each spike was first transformed in a unit vector in a two-dimensional plane. Vectors were then added and the length of the resultant vector was divided by the number of spikes. The preferred phase of a cell was defined as the circular mean of the phase of its action potentials.
Theta phase precession on the zigzag maze.
Theta phase precession was assessed when mice were running faster than 3 cm/s on the zigzag maze. The dataset from the two 20-min trials on this maze were combined, and linear firing fields were detected as described previously. Only fields with a peak firing rate of at least 5 Hz and a length smaller than 1 m were selected. Moreover, fields with a border located within 3 cm from one of the two ends of the maze were excluded. Runs toward each of the two ends of the maze were analyzed separately. For each firing field, a place-phase firing rate map covering only the firing field was constructed. The length of the firing field was divided into 24 bins. Theta cycles were divided into 36 bins and were plotted twice. Place-phase maps were calculated like the two-dimensional firing rate maps, but the smoothing kernel had an SD of 1.5 bins. A mean place-phase firing rate map was created for each genotype, and a shuffling procedure was used to estimate the 95% confidence intervals for the difference between the two mean place-phase firing maps. For each pixel of the maps, the genotype assignation of each map was shuffled, and the mean difference of firing rate between the two pseudo-groups was calculated. This was repeated 500 times to obtain a probability distribution of firing rate differences between groups at that bin, which could then be used to establish the 95% confidence intervals in the original dataset.
The relationship between position and theta phase of the spikes fired within each firing field was tested with linear–circular correlations between these variables (Fisher, 1995; Huxter et al., 2008). We also analyzed the firing phase of neurons after dividing the firing fields into four segments of equal length on the position axis. Spikes were assigned to one of the segments depending on the position of the animal when the spikes occurred. For each field, both the firing rate at different theta phases and the mean theta phase were calculated in the four different segments.
Spatial reference memory tasks.
The water maze (2 m diameter) was located in the same room, with the same visual extramaze cues, as in a previous study that showed that mice with hippocampal lesions were unable to learn the same, standard, fixed-location, hidden escape platform version of the task (Deacon et al., 2002). An escape platform was submerged just below the water surface and milk was added to the water to obscure the platform. The position of the platform remained the same throughout testing for any given mouse but could be in either the north–east or south–west quadrant of the pool (counterbalanced across groups). On each trial, the mouse was released from one of eight possible positions, which was determined according to a pseudorandom order. The mouse was allowed to swim for 90 s or until it had found the platform. If the mouse failed to find the platform within 90 s, then it was guided to the platform and allowed to sit on the platform for 30 s. Mice received four trials per day for 9 d. Probe tests, in which the platform was removed from the pool, were conducted 24 h after trial 24 (transfer test 1) and 24 h after trial 36 (transfer test 2). A software package (Water Maze; Paul Fray Ltd.) provided the path length and latency to reach the platform. There was no familiarization or water maze pretraining.
Spatial reference memory was also tested on an elevated Y-maze located in a room with many extramaze visual cues. Acquisition of this task is also hippocampus dependent (Deacon et al., 2002). Mice were maintained at 85% of their free-feeding weight. The maze had three arms of 50 × 9 cm. Food wells were located 5 cm from the distal end of the arms. Mice were familiarized to the maze until they were running freely. A target arm, defined by its position within the room, was designated for each mouse to receive 0.1 ml rewards of sweetened, condensed milk. Target arms were counterbalanced across groups. The start arm for each trial was determined by a pseudorandom sequence with equal numbers of starts from each of the remaining arms in any session and no more than three consecutive starts from the same arm. The maze was also rotated by multiples of 120° between trials to prevent the use of intramaze cues.
Rewarded alternation on the T-maze.
The mice were maintained at 85% of their free-feeding weight and habituated to the maze over several days before rewarded spatial alternation testing began. Each trial consisted of a sample run and a choice run. On sample runs, the mouse was forced either left or right by blocking access to one goal arm with a wooden block according to a pseudorandom sequence (with equal numbers of left and right turns per session and not more than two consecutive turns in the same direction). A 0.1 ml reward of condensed milk was available in a food well at the end of the goal arm. The block was then removed, and the mouse was placed back at the beginning of the start arm. The delay between the sample run and the choice run was 10–15 s. On choice runs, the mouse was rewarded for choosing the previously unvisited arm. Mice were tested with an intertrial interval (ITI) of ∼10 min and received four daily trials for a period of 10 d.
Recognition memory for spatial arrangements.
For the object displacement test, the mice were first individually habituated to an open field (50 × 30 × 18 cm high) for 3 d. No object was present in the open field during familiarization. The stimuli presentation was done over two 5 min sessions (5 min ITI). Three objects were present in the open field. These objects were made of plastic building blocks (Lego Group) and had distinctive shapes and colors. The position of the objects was counterbalanced across animals. Before the recognition test, one object was moved to a different (and novel) location, thereby altering the spatial arrangement of the objects. The recognition test took place 5 min, 1 h, or 24 h after the last training session. The mouse was placed back into the open field, and a discrimination ratio (time with displaced object/time with objects in familiar location) was used to measure recognition memory. Triplicates of each object were used on the test trial to avoid the use of odor cues.
Statistical analysis.
Unless specified, all data reported are mean ± SE. Possible differences in the firing properties of neurons were investigated using Wilcoxon's rank-sum tests or ANOVAs. Differences between distributions of preferred theta phase between genotypes were tested with a Watson's test for homogeneity of circular data. Most behavioral data were analyzed using ANOVAs with group as a between-subjects factor. The factors block, days, and trials were treated as within-subjects factors.
Histological analysis.
Mice used in the electrophysiological experiments were deeply anesthetized and perfused intracardially with saline, followed by 4% paraformaldehyde. The brains were removed and stored in 4% paraformaldehyde for a minimum of 24 h. The brains were sliced in 50-μm-thick parasagittal sections. The sections were stained with cresyl violet. The final position of the tetrode tips were established using light microscopy.
Results
In vivo tetrode recordings from the CA1 pyramidal cell layer were performed in nine control and seven Cx36−/− mice as they explored open fields or ran in a zigzag maze. The amplitude of spikes from cells recorded in Cx36−/− and control mice was not significantly different (Table 1). In addition, the quality of cluster isolation was similar in the two groups (isolation distance, control, 18.36 ± 0.46; Cx36−/−, 17.03 ± 0.45; Wilcoxon's rank-sum test, p > 0.1). The basic firing properties of recorded neurons are presented in Table 1. Pyramidal cells in knock-out mice had slightly higher firing rates when the mice were running faster than 3 cm/s (p < 0.005). Moreover, the burst index of pyramidal cells from Cx36−/− mice was significantly higher than that of controls, independently of running speed (p < 10−5). For interneurons, the burst index tended to be higher in knock-outs only at running speed faster than 3 cm/s (p = 0.050).
Table 1.
Basic firing properties of hippocampal neurons from control and Cx36−/− mice
| Control mice | Cx36−/− mice | p value | |
|---|---|---|---|
| Pyramidal cells | n = 319 | n = 214 | |
| Spike amplitude at peak (μV) | 234.3 ± 7.4 | 236.0 ± 6.5 | >0.05 |
| Firing rate (Hz) at speed <3 cm/s | 1.11 ± 0.06 | 1.18 ± 0.13 | >0.20 |
| Firing rate (Hz) at speed >3 cm/s | 0.93 ± 0.05 | 1.35 ± 0.19 | <0.005 |
| Burst index at speed <3 cm/s | 0.23 ± 0.007 | 0.27 ± 0.008 | <10−5 |
| Burst index at speed >3 cm/s | 0.21 ± 0.006 | 0.26 ± 0.007 | <10−6 |
| Interneurons | n = 54 | n = 31 | |
| Spike amplitude at peak (μV) | 211.6 ± 20.1 | 200.7 ± 25.7 | >0.40 |
| Firing rate (Hz) at speed <3 cm/s | 11.02 ± 1.17 | 7.57 ± 1.16 | >0.05 |
| Firing rate (Hz) at speed >3 cm/s | 15.56 ± 1.64 | 10.75 ± 1.41 | >0.10 |
| Burst index at speed <3 cm/s | 0.30 ± 0.028 | 0.30 ± 0.042 | >0.20 |
| Burst index at speed >3 cm/s | 0.18 ± 0.016 | 0.27 ± 0.040 | =0.050 |
Mean ± SE. Burst index is the probability that a cell fires spikes 2–10 ms after a first action potential was fired. Wilcoxon's rank-sum tests were applied to obtain significance levels.
Lower spatial selectivity of hippocampal neurons in Cx36−/− mice
Pyramidal cells of Cx36−/− mice had impaired spatial firing properties when compared with controls. Figure 1A shows representative firing rate maps of pyramidal cells recorded from a control and a Cx36−/− mouse during the first daily trial in the open field. The loss of spatial selectivity in pyramidal cells of the mutants was reflected in lower spatial information scores and higher sparsity scores (Fig. 1B) (control, n = 213; Cx36−/−, n = 159; information scores, p < 10−10; sparsity scores, p < 10−10). We also analyzed the size of the detected place fields with a firing peak >5 Hz (Fig. 1B) (control, n = 161; Cx36−/−, n = 102). The size of the place fields as a proportion of the environment size was significantly larger in the mutants (p < 0.05). There was no significant difference between genotypes in regard to the mean number of place fields detected per pyramidal cell (control, 0.76 ± 0.06; Cx36−/−, 0.64 ± 0.06; p > 0.1). These results demonstrate that the spatial modulation of the firing rate of pyramidal cells during open-field exploration was reduced in Cx36−/− mice. The analysis of the second recording trial in the open field revealed similar impairments in the mutants (data not shown) (information scores, p < 10−14; sparsity scores, p < 10−14).
The spatial representation of hippocampal pyramidal cells was also analyzed for trials in which the mice ran on a zigzag maze. Several pyramidal cells from both genotypes had one or more firing fields on the maze, and the presence of the fields depended on the running direction of the mouse (Derdikman et al., 2009). Figure 1C shows representative examples of firing rate maps of pyramidal cells recorded from a control and a mutant mouse. The two-dimensional spatial representations of pyramidal cells from Cx36−/− mice were not significantly different from those of controls with regard to spatial information scores (Fig. 1D) and sparsity scores (first daily trial, control, n = 110; Cx36−/−, n = 97; information scores, p > 0.2; sparsity scores, p > 0.2). This difference compared with the findings obtained in open-field recordings could be attributable to the numerous internal boundaries in the zigzag maze (Derdikman et al., 2009). Because the presence of most firing fields was dependent on the running direction of the mouse, we assessed the size of the linear firing fields after treating the runs in opposite directions separately. Similar to what was observed in the open-field recordings, we found that fields from Cx36−/− mice were larger than those in controls (Fig. 1D) (control, n = 118; Cx36−/−, n = 186; size difference, p < 0.001). This difference between genotypes remained significant after removing the data from the one control mouse trained on a zigzag maze with four alleys instead of five (see Materials and Methods) (p < 0.01). Pyramidal cells of Cx36−/− mice also had more firing fields than those of control mice (Fig. 1D) (mean number of fields per pyramidal cell: control, 1.07; Cx36−/−, 1.92; p < 0.0001). These results suggest that the decline in spatial selectivity of pyramidal cells in Cx36−/− mice was also present in the zigzag maze: pyramidal cells of Cx36−/− mice had more firing fields, and these fields were larger.
The stability of hippocampal spatial representations was assessed during two 20-min foraging trials in the same open field, separated by an ITI of 1 h (Fig. 2A). Firing map similarity, which was assessed by calculating the correlation coefficients between the firing rate values of the two firing rate maps, was lower in Cx36−/− mice (Fig. 2B) (p < 10−11). Because spatial stability was positively correlated with information score (r = 0.34, p = 10−13) (Fig. 2C), we also performed an analysis of covariance, testing the effect of genotype on spatial stability after controlling for the effect of information score on spatial stability. This analysis also indicated that the spatial firing patterns of pyramidal cells from Cx36−/− mice were less stable than those of controls (F(1,432) = 35.65, p < 10−9).
Figure 2.

Impaired stability of spatial representations in Cx36−/− mice during open-field exploration. A, Three place firing rate maps of pyramidal cells recorded during two trials in control (left) and Cx36−/− (right) mice. The first trial is shown in the top row. The intertrial interval was 1 h long. The number above each map indicates the maximum firing rate in the map. B, Mean spatial stability for pyramidal cells of control and Cx36−/− mice. C, Mean spatial stability for pyramidal cells with an information score of 0–0.5 or 0.5–1. Data are shown separately for both genotypes. ***p < 10−9.
Slower theta oscillations in Cx36−/− mice
Spatial exploration was accompanied by prominent theta oscillations in both genotypes. The mean theta wave was calculated for time periods in which the mice were running between 3 and 15 cm/s or faster than 15 cm/s (Fig. 3A). The frequency of theta oscillations in Cx36−/− mice was slower than that of controls. The mean power spectra of the local field potentials showed more power in the lower theta frequencies in Cx36−/− mice when they ran faster than 3 cm/s (Fig. 3B). The theta peak frequency in the power spectrum was calculated for each recording session at different speed intervals (Fig. 3C). The peak frequency was significantly lower in knock-out mice at all speeds (0–5 cm/s, p < 0.05; 5–10 cm/s, p < 0.05; 10–15 cm/s, p < 0.01; 15–20 cm/s, p < 0.001; 20–25 cm/s, p < 0.01). There was no significant difference, however, in the power at the theta peak frequency (Fig. 3D).
Figure 3.

Slower theta oscillations in Cx36−/− mice. A, Mean theta oscillations for control and Cx36−/− mice running at a speed between 3 and 15 cm/s or faster than 15 cm/s. Note that the peaks of the theta oscillations in the Cx36−/− mice occur progressively later than those of controls. Dotted lines are aligned to the peaks of theta oscillations when the mice were running between 3 and 15 cm/s. B, Mean power spectra for Cx36−/− and control mice running at different speeds. C, Mean theta peak frequency at different running speed intervals. D, Mean power at the theta peak frequency at different speed intervals. E, Mean autocorrelation for pyramidal cells (Pyr.) and interneurons (Int.) when the mice ran faster than 3 cm/s. The theta peak in the autocorrelation occurs later in Cx36−/− mice. F, Mean intrinsic theta frequency of pyramidal cells and interneurons for both genotypes. Note that the y-axes on C and F have a range limited to theta frequencies. *p < 0.05, **p < 0.01, ***p < 10−7.
The firing of individual neurons also pointed toward a reduction of theta frequency in mutants. The peak in the mean spike time autocorrelation occurring at theta frequency was delayed (Fig. 3E). The mean intrinsic theta frequency of neurons, calculated from the spike time autocorrelation of each neuron, was slower in Cx36−/− mice (Fig. 3F) (pyramidal cells, p < 10−16; interneurons, p < 10−7). These results are unlikely to be caused by different running speeds in the two groups, because there was no significant difference in the mean running speed when the mice were running faster than 3 cm/s.
Altered temporal coding in Cx36−/− mice
Before comparing the theta firing phase of neurons recorded from different tetrodes, we first investigated whether theta oscillations recorded on different tetrodes located in the CA1 pyramidal cell layer had a similar theta phase. Figure 4A shows the raw and filtered signals recorded simultaneously from four tetrodes located in or near the CA1 pyramidal cell layer. The peaks of theta oscillations from different tetrodes occurred almost simultaneously. The theta phase shift between pairs of tetrodes was obtained via the cross-correlation between the filtered signals (Fig. 4B). The median of the distribution of theta phase shifts in controls was 4.5 ms, or ∼13°. There was no significant difference across genotypes (Fig. 4C) (control, n = 62; Cx36−/−, n = 46; p > 0.5). These results indicate that the data related to the theta phase of neurons recorded from different tetrodes can be pooled without adding much variability to the dataset.
Figure 4.

Phase difference of theta oscillations recorded from different tetrodes located in the CA1 pyramidal cell layer. A, Examples of raw and filtered signals recorded simultaneously from four tetrodes located in the CA1 pyramidal cell layer of a control mouse. Filter bandpass, 5–14 Hz. B, Cross-correlations of the filtered signals from A. The six possible pairs of tetrodes are shown. The peaks in the cross-correlations are located near time lag 0, indicating that theta oscillations recorded on different tetrodes tended to have a similar phase. C, Distribution of theta phase shifts for all pairs of tetrodes located in the pyramidal cell layer of CA1 and recorded simultaneously. Data are shown separately for control and Cx36−/− mice.
Theta phase precession was observed in approximately half of the place fields as the mice ran on the zigzag maze. An example of a field with clear theta phase precession is shown in Figure 5, A and B. A total of 111 and 165 fields were analyzed from control and Cx36−/− mice, respectively. The position of the mouse within the field and the theta phase were calculated for each spike, and linear–circular correlations between these two variables were performed. In both groups, we observed more negative than positive r values, suggesting that a number of fields displayed theta phase precession (Fig. 5C) (control, −0.074 ± 0.009; Cx36−/−, −0.077 ± 0.008; p > 0.2). Figure 5D presents the percentage of fields with significant negative and positive correlations. In control and Cx36−/− mice, 56.8 and 53.3% of the fields showed significant theta phase precession, respectively. Examination of the mean place-phase firing rate maps also indicated significant theta phase precession (Fig. 5E). However, pyramidal cells from Cx36−/− mice appear to fire proportionally more at the ascending and less at the descending phase of the oscillations. This difference was also observed when the firing fields of control and Cx36−/− mice were selected so that there was no difference in place field size between the two genotypes (data not shown).
Figure 5.

Altered theta phase precession in Cx36−/− mice. A, Example of a place field recorded in a control mouse. B, Theta phase and location of the spikes emitted while the mouse was within the place field shown in A. The theta phase of spikes changed as the mouse ran through the place field. The trough of theta oscillations, which is assigned to 90°, corresponds to the most negative portion of the cycle recorded in the pyramidal cell layer. C, Distribution of r values between location and theta phase for each place field of control and Cx36−/− mice. D, Percentage of firing fields showing a nonsignificant (Non sign), a significant negative (Pre.), or a significant positive (Pro.) correlation between location and theta phase. E, Mean place-phase firing rate map for place fields of control (left) and Cx36−/− (middle) mice. The map on the right shows in color the bins for which the difference in firing rate between control and Cx36−/− mice exceeds the 95% confidence interval (see Materials and Methods). The color of each bin represents the difference between the mean firing rate for control and mutant mice for that particular bin. The gray background was obtained by plotting the mean place-phase firing rate map of control mice using a grayscale.
To further analyze how the theta phase of spikes changed as the mice ran through a firing field, each field was divided into four segments, with the first and fourth segments representing the beginning and end of the field, respectively (Fig. 6A). The firing rate of the cells at different theta phases was calculated for the four segments of the place fields (Fig. 6B). ANOVAs revealed significant phase by genotype interactions in the second and third segments of the field (second segment, F(23,6302) = 2.54, p < 10−5; third segment, F(23,6302) = 5.60, p < 10−15). Pyramidal cells of Cx36−/− mice fired less at the descending phase of theta oscillations when the mouse was in the middle portion of the firing field (second and third segments). The distributions of mean theta firing phase for pyramidal cells were not significantly different in the first, second, and fourth segments of the firing fields (Fig. 6C). However, when the mouse was in the third segment, pyramidal cells of Cx36−/− mice fired at later theta phases than pyramidal cells of control mice (p < 0.01). Similar effects were observed when the place fields were divided into three or five segments (data not shown).
Figure 6.

Theta firing phase in different place field segments. A, Schematic illustrating the four segments of a place field in the zigzag maze. Segments 1 and 4 represent the beginning and the end of the field, respectively. B, Mean in-field firing rate at different theta phases for pyramidal cells of control and Cx36−/− mice. The data are shown separately for the four segments of the place fields. C, Distributions of mean theta phase of pyramidal cells in the four segments of the place fields. D, Mean firing rate within the place fields of pyramidal cells. There was no difference between groups in regard to the peak firing rate within the fields. E, Mean theta vector length for pyramidal cells (Pyr.) and interneurons (Int.) when the mice were running faster than 3 cm/s. *p < 0.01, **p < 10−5, ***p < 10−15.
There was no significant difference in the peak firing rate of the fields from Cx36−/− and control mice (Fig. 6D) (p > 0.2), suggesting that the difference in firing phase was not attributable to different firing rates in the two groups. The theta phase precession profile in Cx36−/− mice suggests that neurons in the mutants fire during a more restricted phase of the theta cycle. Indeed, this was confirmed by the longer mean theta vector length observed in pyramidal cells and interneurons from Cx36−/− mice (Fig. 6E) (pyramidal cells, p < 10−6; interneurons, p < 0.005).
Intact spatial reference memory in Cx36−/− mice
Hippocampus-dependent spatial reference memory of Cx36−/− mice and control littermates was tested in the water maze. Acquisition of this task is impaired in mice with hippocampal lesions in the very same testing room, with the same extramaze spatial cues (Deacon et al., 2002; Reisel et al., 2002). Cx36−/− mice performed as well as controls on this task. In both groups, the path length to reach the submerged platform decreased progressively over days (Fig. 7A) (control, n = 11; Cx36−/−, n = 9; F(8,144) = 49.55, p < 0.0001), and there was no significant difference between groups (F(1,18) < 1) or interaction between these two factors (F(8,144) = 1.37, p > 0.20). There was a significant effect of trial within the days of training (F(3,54) = 7.06, p > 0.001) but no group × trial interaction (F(3,54) < 1). Similar results were obtained when escape latencies were used as the dependent variable (Fig. 7B). Analysis of the performance during the first transfer test, in which the platform was removed from the pool, showed that mice of both genotypes spent the most time searching in the quadrant that had contained the escape platform (Fig. 7C). Comparison of the two groups solely in terms of the time spent in the training quadrant failed to reveal a group difference (F(1,18) < 1). The performance on the second transfer test led to similar findings (Fig. 7D).
Figure 7.
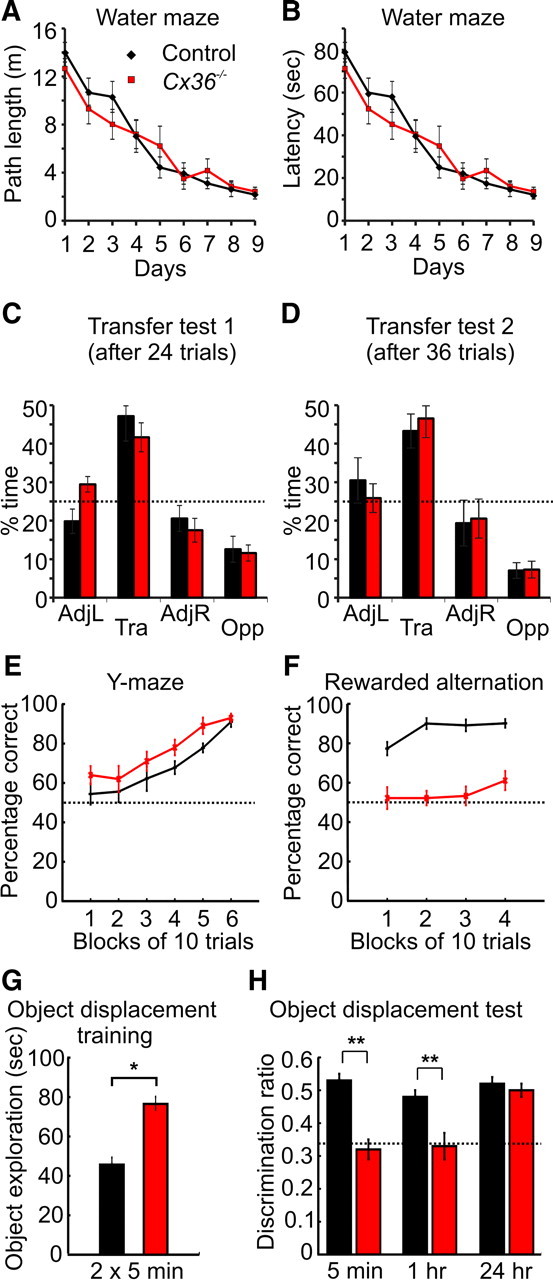
Absence of Cx36-mediated gap junctions does not affect long-term spatial reference memory but impairs short-term spatial memory. A, Path length to reach the submerged platform during the acquisition phase of the water maze task. B, Latency to reach the platform during acquisition. C, Percentage of the total time spent in the four maze quadrants during the first transfer test of the water maze task after 24 trials. The dotted line represents chance levels. D, Same as C but for the second transfer test after 36 trials. AdjL, Adjacent left quadrant; Tra, training quadrant; AdjR, adjacent right quadrant; Opp, opposite quadrant. E, Acquisition of the appetitive reference memory task on the Y-maze. F, Percentage of correct choices for control and Cx36−/− mice during rewarded alternation on a T-maze. G, Time spent exploring objects during the training phase of the object displacement task. H, Discrimination ratio (time spent with the displaced object divided by the total time exploring objects) during the spatial recognition test after different delays. *p < 0.001, **p < 0.0001.
Hippocampus-dependent spatial reference memory was also assessed using an appetitive protocol on an elevated Y-maze (Deacon et al., 2002). On this task, mice were rewarded for visiting one arm of the maze that was located at a constant position within the room. Cx36−/− mice actually exhibited a higher percentage of correct arm entries during the acquisition of this task than controls (Fig. 7E) (control, n = 10; Cx36−/−, n = 9; main effect of group, F(1,17) = 9.5, p < 0.005; main effect of block, F(5,85) = 17.8, p < 0.001; group × block interaction, F(5,85) < 1).
Impaired rewarded alternation performance and recognition memory in Cx36−/− mice
Short-term spatial memory was analyzed using the rewarded alternation (non-matching to place) task on the T-maze (Fig. 7F). This task has been shown to be sensitive to hippocampal lesions in mice (Deacon et al., 2002). Control mice performed well from the beginning. In contrast, Cx36−/− mice alternated at near chance levels, and their performance was significantly below that of the controls (control, n = 11; Cx36−/−, n = 9; F(1,18) = 149.9, p < 0.0001).
To analyze short-term and long-term spatial recognition memory during an object displacement task, short delays (5 min or 1 h) and a long delay (24 h) between the training and the test phase were used. Thirty-four control and 36 Cx36−/− mice underwent the training phase (2 × 5 min). Cx36−/− mice spent significantly more time exploring the objects during training than control mice (Fig. 7G) (Kruskal–Wallis test, H = 25.2; p < 0.001). One object was then displaced just before the test phase. To compare spatial recognition memory between the genotypes, we calculated discrimination ratios (time spent exploring the displaced object/time spent exploring all three objects; chance = 0.33) after the different delays (Fig. 7H). There was a significant group × delay interaction (F(2,64) = 9.82, p < 0.001). Discrimination ratios were significantly lower in Cx36−/− mice after a delay of 5 min (F(1,64) = 45.30, p < 0.0001) or 1 h (F(1,64) = 18.66, p < 0.0001). In contrast, after the 24 h delay, both genotypes expressed similar long-term spatial recognition memory and displayed a strong preference for the displaced object (main effect of group, F(1,64) < 1).
Discussion
Deletion of gap junctions led to a deficit in place cell spatial selectivity. Moreover, the CA1 spatial representations in Cx36−/− mice were less stable. This implicates interneurons in the neuronal computations responsible for the spatial selectivity and stability of hippocampal place cells. In Cx36−/− mice, electrical coupling between interneurons is abolished, but the excitatory and inhibitory synaptic inputs onto these cells were not modified. Indeed, the mean firing rate of putative GABAergic interneurons in Cx36−/− mice was not significantly different from that of controls. This argues against the idea that hippocampal interneurons contribute to spatial rate coding solely by providing a certain level of inhibition onto pyramidal cells.
Previous work on the function of Cx36-mediated gap junctions has demonstrated their importance for the generation of gamma oscillations (Tamás et al., 2000; Hormuzdi et al., 2001; Buhl et al., 2003). The present study indicates that the function of neuronal gap junctions also extends to shaping theta firing dynamics. The frequency of theta oscillations was lower in Cx36−/− mice, and this change could not be accounted for by a lower running speed in mutant mice. Possible mechanisms for this effect will have to be investigated. The isolated hippocampus was shown to generate atropine-resistant theta oscillations, and in vitro and modeling studies implicated interactions between oriens-lacunosum- moleculare interneurons and fast-spiking interneurons in these oscillations (Gillies et al., 2002; Rotstein et al., 2005; Goutagny et al., 2009). Interestingly, both of these interneuron types are coupled via gap junctions (Fukuda and Kosaka, 2000; Zhang et al., 2004). It should also be noted that the mechanisms responsible for setting theta frequency in vivo likely involve other brain areas, such as the medial septum and the medial entorhinal cortex (Buzsáki, 2002). Regionally selective molecular manipulations will be needed to clarify the contribution of gap junctions to theta oscillation frequency in these areas.
We characterized theta phase precession in the hippocampus of freely moving mice (Harvey et al., 2009). More than 50% of the place fields recorded on the zigzag maze showed significant theta phase precession. The profile of phase precession in mice is relatively similar to what is usually observed in rats. For example, the phase variability appears to increase as the mouse moves through the place field (Skaggs et al., 1996). However, the proportion of neurons showing significant theta phase precession in mice was lower than in rats, in which the vast majority of fields recorded on linear (O'Keefe and Recce, 1993; Huxter et al., 2003; Hafting et al., 2008) or triangular (Skaggs et al., 1996) tracks showed theta phase precession. The lower proportion of neurons exhibiting theta phase precession could be attributable to species differences or to divergences in the behavioral protocols. Nevertheless, the presence of robust theta phase precession in at least half of the place fields of the mouse paves the way for additional investigations to dissect cellular mechanisms responsible for theta phase precession using molecular tools in mice.
In Cx36−/− and control mice, a similar proportion of place fields showed theta phase precession, but the dynamics of this process were altered in mutants. Pyramidal cells from Cx36−/− mice fired proportionally more at the ascending phase of theta than at the descending phase. Previous work indicated that theta phase precession in CA1 pyramidal cells is more complex than a simple linear phase shift (Skaggs et al., 1996). In several fields, theta phase precession could be best described as a two-component process (Yamaguchi et al., 2002). The first component extends for a large portion of the place field, and its phase shifts by ∼180°. The second component occurs at a later position in the place field, shows little phase shift, and is anti-phase with the first component. Whereas the two components appeared to have similar firing rates in pyramidal cells from control mice, the second component had a lower firing rate than the first in Cx36−/− mice. One observes the overlap between these two components when an animal enters the second half of a place field, in which pyramidal cells in mutant mice fired at a later phase of theta oscillations than those in control mice.
The reduced firing of pyramidal cells at the descending phase of theta oscillations in the mutants most likely suggests that they receive less excitation or more inhibition at this phase of theta. Current source density analysis and dual-site recordings indicate that neurons of layer III of the medial entorhinal cortex depolarize the distal dendrites of CA1 pyramidal cells, and most probably CA1 interneurons, near the peak of theta oscillations (Kamondi et al., 1998; Mizuseki et al., 2009). It is possible that the lack of electrical coupling between hippocampal interneurons affects the integration of this input (Price et al., 2005; Zsiros and Maccaferri, 2005; Capogna, 2010). Interestingly, this medial entorhinal cortex layer III projection is required for precise spatial firing of CA1 pyramidal cells (Brun et al., 2008). A second possibility is that pyramidal cells in the CA3 region also have reduced firing at the descending phase of theta in Cx36−/− mice and that this effect is transmitted to CA1 pyramidal cells.
An intriguing question is how do these electrophysiological changes relate to the behavior of the animals. Cx36−/− mice performed at near chance levels on the rewarded alternation T-maze task. Performance on this win-shift memory task requires animals to differentiate between arms of the maze on the basis of their relative familiarity as a result of recent experience (Sanderson et al., 2010). Wild-type animals readily display a tendency to visit novel locations rather than more familiar once (such as a recently visited arm of the maze). This account based on relative familiarity explains why performance on rewarded alternation tasks is above chance levels from the very first trials. Based on the current and previous experiments, it seems plausible that the ability to rapidly encode and express a short-lasting change in the relative novelty/familiarity of a given spatial location could require normal spatial and/or temporal firing of place cells (Cacucci et al., 2008; Robbe and Buzsáki, 2009; Korotkova et al., 2010). In Cx36−/− mice, the absence of gap junctions between interneurons changed the spatial and temporal properties of hippocampal place cells, which in turn could potentially lead to impaired performance on the rewarded alternation task and to a deficit in short-term spatial recognition memory.
Notably, Cx36−/− mice performed as well as (if not better than) control mice on reference memory tasks, in the water maze and on the Y-maze. These findings rule out the possibility that their short-term memory deficits resulted from sensorimotor or motivational impairments. It is generally accepted that performance on reference memory tasks requires forming long-term associations between spatial locations and outcomes. In contrast to the rewarded alternation task on the T-maze, performance on the reference memory tasks improves incrementally over many trials. Although this form of learning is impaired by hippocampal lesions (Morris et al., 1982; Jarrard, 1993; Deacon et al., 2002), it remains unaffected by several molecular manipulations that likely alter the activity of hippocampal interneurons (Reisel et al., 2002; Fuchs et al., 2007; Bannerman et al., 2008; Korotkova et al., 2010). It therefore appears that this form of spatial memory depends on physiological processes that are more resistant to alterations either in glutamatergic synaptic transmission onto interneurons or electrical coupling between interneurons.
The impairments in spatial coding of place cells together with the normal reference memory performance of the Cx36−/− mice raises the question as to the role of place cell activity during different spatial memory tasks. The cognitive map theory proposes that place cells represent different parts of the environment and that their ensemble firing pattern provides a map that enables the animal to successfully navigate within an environment (O'Keefe and Nadel, 1978). If the activity of place cells represents long-term spatial memory traces, then impaired spatial selectivity and stability of place cells in Cx36−/− mice might have been expected to have led to poorer spatial memory traces and impaired spatial navigation. However, Cx36−/− mice navigated as efficiently as control mice in the water maze and on the Y-maze. Thus, mice with impaired hippocampal spatial coding do not necessarily perform poorly on spatial tasks assessing associative long-term memory. It remains possible that, despite their lower degree of spatial selectivity and stability, the place fields of Cx36−/− mice could still contain sufficient spatial information for accurate performance on these tasks. Alternatively, other brain regions involved in spatial coding could support performance on these tasks (Hafting et al., 2005).
Conclusions
By interfering with electrical coupling between interneurons, it was possible to reveal their role in shaping the spatial selectivity of hippocampal place cells and in spatial cognition. Limitations of the current study include a lack of regional selectivity of the Cx36 knock-out, that neuronal gap junctions were eliminated in several interneuron types, and that the deletion might have altered developmental processes. A better dissection of the role of gap junctions in information processing awaits the development of new mouse lines, allowing the manipulation of Cx36 expression in a regional, cell-type specific and temporal manner.
Footnotes
K.A. held a Humboldt Research Fellowship for Postdoctoral Researchers. H.M. was supported by the Schilling Foundation, the Deutsche Forschungsgemeinschaft (Leibniz Award), and the Seventh Framework Programme of the European Commission (SPACEBRAIN). D.M.B. was supported by Wellcome Trust Grant 074385. We thank A. Taylor for her help with behavioral training and C. Buetfering for her comments on the manuscript.
References
- Bannerman DM, Niewoehner B, Lyon L, Romberg C, Schmitt WB, Taylor A, Sanderson DJ, Cottam J, Sprengel R, Seeburg PH, Köhr G, Rawlins JN. NMDA receptor subunit NR2A is required for rapidly acquired spatial working memory but not incremental spatial reference memory. J Neurosci. 2008;28:3623–3630. doi: 10.1523/JNEUROSCI.3639-07.2008. [DOI] [PMC free article] [PubMed] [Google Scholar]
- Belforte JE, Zsiros V, Sklar ER, Jiang Z, Yu G, Li Y, Quinlan EM, Nakazawa K. Postnatal NMDA receptor ablation in corticolimbic interneurons confers schizophrenia-like phenotypes. Nat Neurosci. 2010;13:76–83. doi: 10.1038/nn.2447. [DOI] [PMC free article] [PubMed] [Google Scholar]
- Bennett MV, Zukin RS. Electrical coupling and neuronal synchronization in the mammalian brain. Neuron. 2004;41:495–511. doi: 10.1016/s0896-6273(04)00043-1. [DOI] [PubMed] [Google Scholar]
- Brun VH, Leutgeb S, Wu HQ, Schwarcz R, Witter MP, Moser EI, Moser MB. Impaired spatial representation in CA1 after lesion of direct input from entorhinal cortex. Neuron. 2008;57:290–302. doi: 10.1016/j.neuron.2007.11.034. [DOI] [PubMed] [Google Scholar]
- Buhl DL, Harris KD, Hormuzdi SG, Monyer H, Buzsáki G. Selective impairment of hippocampal gamma oscillations in connexin-36 knock-out mouse in vivo. J Neurosci. 2003;23:1013–1018. doi: 10.1523/JNEUROSCI.23-03-01013.2003. [DOI] [PMC free article] [PubMed] [Google Scholar]
- Buzsáki G. Theta oscillations in the hippocampus. Neuron. 2002;33:325–340. doi: 10.1016/s0896-6273(02)00586-x. [DOI] [PubMed] [Google Scholar]
- Cacucci F, Yi M, Wills TJ, Chapman P, O'Keefe J. Place cell firing correlates with memory deficits and amyloid plaque burden in Tg2576 Alzheimer mouse model. Proc Natl Acad Sci U S A. 2008;105:7863–7868. doi: 10.1073/pnas.0802908105. [DOI] [PMC free article] [PubMed] [Google Scholar]
- Capogna M. Neurogliaform cells and other interneurons of stratum lacunosum moleculare gate entorhinal-hippocampal dialogue. J Physiol. 2010 doi: 10.1113/jphysiol.2010.201004. [DOI] [PMC free article] [PubMed] [Google Scholar]
- Cardin JA, Carlén M, Meletis K, Knoblich U, Zhang F, Deisseroth K, Tsai LH, Moore CI. Driving fast-spiking cells induces gamma rhythm and controls sensory responses. Nature. 2009;459:663–667. doi: 10.1038/nature08002. [DOI] [PMC free article] [PubMed] [Google Scholar]
- Cobb SR, Buhl EH, Halasy K, Paulsen O, Somogyi P. Synchronization of neuronal activity in hippocampus by individual GABAergic interneurons. Nature. 1995;378:75–78. doi: 10.1038/378075a0. [DOI] [PubMed] [Google Scholar]
- Condorelli DF, Parenti R, Spinella F, Trovato Salinaro A, Belluardo N, Cardile V, Cicirata F. Cloning of a new gap junction gene (Cx36) highly expressed in mammalian brain neurons. Eur J Neurosci. 1998;10:1202–1208. doi: 10.1046/j.1460-9568.1998.00163.x. [DOI] [PubMed] [Google Scholar]
- Connors BW, Long MA. Electrical synapses in the mammalian brain. Annu Rev Neurosci. 2004;27:393–418. doi: 10.1146/annurev.neuro.26.041002.131128. [DOI] [PubMed] [Google Scholar]
- Csicsvari J, Hirase H, Czurkó A, Mamiya A, Buzsáki G. Oscillatory coupling of hippocampal pyramidal cells and interneurons in the behaving rat. J Neurosci. 1999;19:274–287. doi: 10.1523/JNEUROSCI.19-01-00274.1999. [DOI] [PMC free article] [PubMed] [Google Scholar]
- Deacon RM, Bannerman DM, Kirby BP, Croucher A, Rawlins JN. Effects of cytotoxic hippocampal lesions in mice on a cognitive test battery. Behav Brain Res. 2002;133:57–68. doi: 10.1016/s0166-4328(01)00451-x. [DOI] [PubMed] [Google Scholar]
- Deans MR, Gibson JR, Sellitto C, Connors BW, Paul DL. Synchronous activity of inhibitory networks in neocortex requires electrical synapses containing connexin36. Neuron. 2001;31:477–485. doi: 10.1016/s0896-6273(01)00373-7. [DOI] [PubMed] [Google Scholar]
- Derdikman D, Whitlock JR, Tsao A, Fyhn M, Hafting T, Moser MB, Moser EI. Fragmentation of grid cell maps in a multicompartment environment. Nat Neurosci. 2009;12:1325–1332. doi: 10.1038/nn.2396. [DOI] [PubMed] [Google Scholar]
- Ego-Stengel V, Wilson MA. Spatial selectivity and theta phase precession in CA1 interneurons. Hippocampus. 2007;17:161–174. doi: 10.1002/hipo.20253. [DOI] [PubMed] [Google Scholar]
- Ego-Stengel V, Wilson MA. Disruption of ripple-associated hippocampal activity during rest impairs spatial learning in the rat. Hippocampus. 2010;20:1–10. doi: 10.1002/hipo.20707. [DOI] [PMC free article] [PubMed] [Google Scholar]
- Fisher NI. Statistical analysis of circular data. Cambridge, UK: Cambridge UP; 1995. [Google Scholar]
- Frigo M, Steven FJ. The design and implementation of FFTW3. Proc IEEE. 2005;93:216–231. [Google Scholar]
- Fuchs EC, Zivkovic AR, Cunningham MO, Middleton S, Lebeau FE, Bannerman DM, Rozov A, Whittington MA, Traub RD, Rawlins JN, Monyer H. Recruitment of parvalbumin-positive interneurons determines hippocampal function and associated behavior. Neuron. 2007;53:591–604. doi: 10.1016/j.neuron.2007.01.031. [DOI] [PubMed] [Google Scholar]
- Fukuda T, Kosaka T. Gap junctions linking the dendritic network of GABAergic interneurons in the hippocampus. J Neurosci. 2000;20:1519–1528. doi: 10.1523/JNEUROSCI.20-04-01519.2000. [DOI] [PMC free article] [PubMed] [Google Scholar]
- Galarreta M, Hestrin S. A network of fast-spiking cells in the neocortex connected by electrical synapses. Nature. 1999;402:72–75. doi: 10.1038/47029. [DOI] [PubMed] [Google Scholar]
- Geisler C, Robbe D, Zugaro M, Sirota A, Buzsáki G. Hippocampal place cell assemblies are speed-controlled oscillators. Proc Natl Acad Sci U S A. 2007;104:8149–8154. doi: 10.1073/pnas.0610121104. [DOI] [PMC free article] [PubMed] [Google Scholar]
- Gibson JR, Beierlein M, Connors BW. Two networks of electrically coupled inhibitory neurons in neocortex. Nature. 1999;402:75–79. doi: 10.1038/47035. [DOI] [PubMed] [Google Scholar]
- Gillies MJ, Traub RD, LeBeau FE, Davies CH, Gloveli T, Buhl EH, Whittington MA. A model of atropine-resistant theta oscillations in rat hippocampal area CA1. J Physiol. 2002;543:779–793. doi: 10.1113/jphysiol.2002.024588. [DOI] [PMC free article] [PubMed] [Google Scholar]
- Goutagny R, Jackson J, Williams S. Self-generated theta oscillations in the hippocampus. Nat Neurosci. 2009;12:1491–1493. doi: 10.1038/nn.2440. [DOI] [PubMed] [Google Scholar]
- Hafting T, Fyhn M, Molden S, Moser MB, Moser EI. Microstructure of a spatial map in the entorhinal cortex. Nature. 2005;436:801–806. doi: 10.1038/nature03721. [DOI] [PubMed] [Google Scholar]
- Hafting T, Fyhn M, Bonnevie T, Moser MB, Moser EI. Hippocampus-independent phase precession in entorhinal grid cells. Nature. 2008;453:1248–1252. doi: 10.1038/nature06957. [DOI] [PubMed] [Google Scholar]
- Hangya B, Li Y, Muller RU, Czurkó A. Complementary spatial firing in place cell-interneuron pairs. J Physiol. 2010;588:4165–4175. doi: 10.1113/jphysiol.2010.194274. [DOI] [PMC free article] [PubMed] [Google Scholar]
- Harris KD, Hirase H, Leinekugel X, Henze DA, Buzsáki G. Temporal interaction between single spikes and complex spike bursts in hippocampal pyramidal cells. Neuron. 2001;32:141–149. doi: 10.1016/s0896-6273(01)00447-0. [DOI] [PubMed] [Google Scholar]
- Harris KD, Henze DA, Hirase H, Leinekugel X, Dragoi G, Czurkó A, Buzsáki G. Spike train dynamics predicts theta-related phase precession in hippocampal pyramidal cells. Nature. 2002;417:738–741. doi: 10.1038/nature00808. [DOI] [PubMed] [Google Scholar]
- Harvey CD, Collman F, Dombeck DA, Tank DW. Intracellular dynamics of hippocampal place cells during virtual navigation. Nature. 2009;461:941–946. doi: 10.1038/nature08499. [DOI] [PMC free article] [PubMed] [Google Scholar]
- Hormuzdi SG, Pais I, LeBeau FE, Towers SK, Rozov A, Buhl EH, Whittington MA, Monyer H. Impaired electrical signaling disrupts gamma frequency oscillations in connexin 36-deficient mice. Neuron. 2001;31:487–495. doi: 10.1016/s0896-6273(01)00387-7. [DOI] [PubMed] [Google Scholar]
- Huxter JR, Senior TJ, Allen K, Csicsvari J. Theta phase-specific codes for two-dimensional position, trajectory and heading in the hippocampus. Nat Neurosci. 2008;11:587–594. doi: 10.1038/nn.2106. [DOI] [PubMed] [Google Scholar]
- Huxter J, Burgess N, O'Keefe J. Independent rate and temporal coding in hippocampal pyramidal cells. Nature. 2003;425:828–832. doi: 10.1038/nature02058. [DOI] [PMC free article] [PubMed] [Google Scholar]
- Jarrard LE. On the role of the hippocampus in learning and memory in the rat. Behav Neural Biol. 1993;60:9–26. doi: 10.1016/0163-1047(93)90664-4. [DOI] [PubMed] [Google Scholar]
- Kamondi A, Acsády L, Wang XJ, Buzsáki G. Theta oscillations in somata and dendrites of hippocampal pyramidal cells in vivo: activity-dependent phase-precession of action potentials. Hippocampus. 1998;8:244–261. doi: 10.1002/(SICI)1098-1063(1998)8:3<244::AID-HIPO7>3.0.CO;2-J. [DOI] [PubMed] [Google Scholar]
- Koós T, Tepper JM. Inhibitory control of neostriatal projection neurons by GABAergic interneurons. Nat Neurosci. 1999;2:467–472. doi: 10.1038/8138. [DOI] [PubMed] [Google Scholar]
- Korotkova T, Fuchs EC, Ponomarenko A, von Engelhardt J, Monyer H. NMDA receptor ablation on parvalbumin-positive interneurons impairs hippocampal synchrony, spatial representations, and working memory. Neuron. 2010;68:557–569. doi: 10.1016/j.neuron.2010.09.017. [DOI] [PubMed] [Google Scholar]
- Losonczy A, Zemelman BV, Vaziri A, Magee JC. Network mechanisms of theta related neuronal activity in hippocampal CA1 pyramidal neurons. Nat Neurosci. 2010;13:967–972. doi: 10.1038/nn.2597. [DOI] [PMC free article] [PubMed] [Google Scholar]
- Maurer AP, Cowen SL, Burke SN, Barnes CA, McNaughton BL. Phase precession in hippocampal interneurons showing strong functional coupling to individual pyramidal cells. J Neurosci. 2006;26:13485–13492. doi: 10.1523/JNEUROSCI.2882-06.2006. [DOI] [PMC free article] [PubMed] [Google Scholar]
- Mizuseki K, Sirota A, Pastalkova E, Buzsáki G. Theta oscillations provide temporal windows for local circuit computation in the entorhinal-hippocampal loop. Neuron. 2009;64:267–280. doi: 10.1016/j.neuron.2009.08.037. [DOI] [PMC free article] [PubMed] [Google Scholar]
- Morris RG, Garrud P, Rawlins JN, O'Keefe J. Place navigation impaired in rats with hippocampal lesions. Nature. 1982;297:681–683. doi: 10.1038/297681a0. [DOI] [PubMed] [Google Scholar]
- Muller RU, Kubie JL, Ranck JB., Jr Spatial firing patterns of hippocampal complex-spike cells in a fixed environment. J Neurosci. 1987;7:1935–1950. doi: 10.1523/JNEUROSCI.07-07-01935.1987. [DOI] [PMC free article] [PubMed] [Google Scholar]
- O'Keefe J, Dostrovsky J. The hippocampus as a spatial map. Preliminary evidence from unit activity in the freely-moving rat. Brain Res. 1971;34:171–175. doi: 10.1016/0006-8993(71)90358-1. [DOI] [PubMed] [Google Scholar]
- O'Keefe J, Nadel L. The hippocampus as a cognitive map. Oxford: Oxford UP; 1978. [Google Scholar]
- O'Keefe J, Recce ML. Phase relationship between hippocampal place units and the EEG theta rhythm. Hippocampus. 1993;3:317–330. doi: 10.1002/hipo.450030307. [DOI] [PubMed] [Google Scholar]
- Press WH, Teukolsky SA, Vetterling WT, Flannery BP. Numerical recipes: the art of scientific computing. Ed 3. Cambridge, UK: Cambridge UP; 2007. [Google Scholar]
- Price CJ, Cauli B, Kovacs ER, Kulik A, Lambolez B, Shigemoto R, Capogna M. Neurogliaform neurons form a novel inhibitory network in the hippocampal CA1 area. J Neurosci. 2005;25:6775–6786. doi: 10.1523/JNEUROSCI.1135-05.2005. [DOI] [PMC free article] [PubMed] [Google Scholar]
- Reisel D, Bannerman DM, Schmitt WB, Deacon RM, Flint J, Borchardt T, Seeburg PH, Rawlins JN. Spatial memory dissociations in mice lacking GluR1. Nat Neurosci. 2002;5:868–873. doi: 10.1038/nn910. [DOI] [PubMed] [Google Scholar]
- Robbe D, Buzsáki G. Alteration of theta timescale dynamics of hippocampal place cells by a cannabinoid is associated with memory impairment. J Neurosci. 2009;29:12597–12605. doi: 10.1523/JNEUROSCI.2407-09.2009. [DOI] [PMC free article] [PubMed] [Google Scholar]
- Rotstein HG, Pervouchine DD, Acker CD, Gillies MJ, White JA, Buhl EH, Whittington MA, Kopell N. Slow and fast inhibition and an H-current interact to create a theta rhythm in a model of CA1 interneuron network. J Neurophysiol. 2005;94:1509–1518. doi: 10.1152/jn.00957.2004. [DOI] [PubMed] [Google Scholar]
- Royer S, Sirota A, Patel J, Buzsáki G. Distinct representations and theta dynamics in dorsal and ventral hippocampus. J Neurosci. 2010;30:1777–1787. doi: 10.1523/JNEUROSCI.4681-09.2010. [DOI] [PMC free article] [PubMed] [Google Scholar]
- Sanderson DJ, McHugh SB, Good MA, Sprengel R, Seeburg PH, Rawlins JN, Bannerman DM. Spatial working memory deficits in GluA1 AMPA receptor subunit knockout mice reflect impaired short-term habituation: evidence for Wagner's dual-process memory model. Neuropsychologia. 2010;48:2303–2315. doi: 10.1016/j.neuropsychologia.2010.03.018. [DOI] [PMC free article] [PubMed] [Google Scholar]
- Schmitzer-Torbert N, Jackson J, Henze D, Harris K, Redish AD. Quantitative measures of cluster quality for use in extracellular recordings. Neuroscience. 2005;131:1–11. doi: 10.1016/j.neuroscience.2004.09.066. [DOI] [PubMed] [Google Scholar]
- Skaggs WE, McNaughton BL, Wilson MA, Barnes CA. Theta phase precession in hippocampal neuronal populations and the compression of temporal sequences. Hippocampus. 1996;6:149–172. doi: 10.1002/(SICI)1098-1063(1996)6:2<149::AID-HIPO6>3.0.CO;2-K. [DOI] [PubMed] [Google Scholar]
- Söhl G, Degen J, Teubner B, Willecke K. The murine gap junction gene connexin36 is highly expressed in mouse retina and regulated during brain development. FEBS Lett. 1998;428:27–31. doi: 10.1016/s0014-5793(98)00479-7. [DOI] [PubMed] [Google Scholar]
- Tamás G, Buhl EH, Lörincz A, Somogyi P. Proximally targeted GABAergic synapses and gap junctions synchronize cortical interneurons. Nat Neurosci. 2000;3:366–371. doi: 10.1038/73936. [DOI] [PubMed] [Google Scholar]
- Whittington MA, Traub RD. Interneuron diversity series: inhibitory interneurons and network oscillations in vitro. Trends Neurosci. 2003;26:676–682. doi: 10.1016/j.tins.2003.09.016. [DOI] [PubMed] [Google Scholar]
- Wilent WB, Nitz DA. Discrete place fields of hippocampal formation interneurons. J Neurophysiol. 2007;97:4152–4161. doi: 10.1152/jn.01200.2006. [DOI] [PubMed] [Google Scholar]
- Wulff P, Ponomarenko AA, Bartos M, Korotkova TM, Fuchs EC, Bähner F, Both M, Tort AB, Kopell NJ, Wisden W, Monyer H. Hippocampal theta rhythm and its coupling with gamma oscillations require fast inhibition onto parvalbumin-positive interneurons. Proc Natl Acad Sci U S A. 2009;106:3561–3566. doi: 10.1073/pnas.0813176106. [DOI] [PMC free article] [PubMed] [Google Scholar]
- Yamaguchi Y, Aota Y, McNaughton BL, Lipa P. Bimodality of theta phase precession in hippocampal place cells in freely running rats. J Neurophysiol. 2002;87:2629–2642. doi: 10.1152/jn.2002.87.6.2629. [DOI] [PubMed] [Google Scholar]
- Zhang XL, Zhang L, Carlen PL. Electrotonic coupling between stratum oriens interneurones in the intact in vitro mouse juvenile hippocampus. J Physiol. 2004;558:825–839. doi: 10.1113/jphysiol.2004.065649. [DOI] [PMC free article] [PubMed] [Google Scholar]
- Zsiros V, Maccaferri G. Electrical coupling between interneurons with different excitable properties in the stratum lacunosum-moleculare of the juvenile CA1 rat hippocampus. J Neurosci. 2005;25:8686–8695. doi: 10.1523/JNEUROSCI.2810-05.2005. [DOI] [PMC free article] [PubMed] [Google Scholar]