

Abstract
If we wish to understand whether development influences the rate or direction of morphological evolution, we must first understand the developmental bases of morphological variation within species. However, quantitative variation in adult morphology is the product of molecular and cellular processes unfolding from embryonic development through juvenile growth to maturity. The Atchley-Hall model provides a useful framework for dissecting complex morphologies into their component parts as a way of determining which developmental processes contribute to variation in adult form. We have examined differences in postnatal allometry and the patterns of genetic correlation between age-specific traits for 10 recombinant inbred strains of mice generated from an intercross of LG/J and SM/J. Long bone length is closely tied to body size, but variation in adult morphology is more closely tied to differences in growth rate between 3 and 5 weeks of age. These analyses show that variation generated during early development is overridden by variation generated later in life. To more precisely determine the cellular processes generating this variation we then examined the cellular dynamics of long bone growth plates at the time of maximum elongation rate differences in the parent strains. Our analyses revealed that variation in long bone length is the result of faster elongation rates of the LG/J stain. The developmental bases for these differences in growth rate involve the rate of cell division and chondrocyte hypertrophy in the growth plate.
Keywords: Growth plate, Long Bone, Mouse, Evo-Devo, Quantitative Genetics
Introduction
Variation in long bone length underlies much of the diversity in mammalian locomotion. Relatively elongated long bones allow bats to fly and modern horses greater sprint speeds compared to their ancestors (Simpson ‘63). Relatively short long bones, on the other hand, provide mammals such moles and shrews with superior burrowing abilities. It is clear that natural selection has repeatedly acted on long bone morphology throughout mammalian evolutionary history. But, what were the specific developmental mechanisms that natural selection acted upon to generate this diversity? How complex were the developmental and genetic responses to natural selection? Answers to these questions depend on the patterns of genetic variation within populations. We need to identify such variation patterns to understand how developmental and genetic constraints impact the course of morphological evolution.
Much attention has been given to uncovering the specific developmental and molecular mechanisms underlying morphological variation among mammals (e.g. Hallgrimmson et al. ‘02, Young and Hallgrimmson ‘05, Rolian ‘08, ‘09, Rolian et al. ‘09, Sears ‘09, Schmidt and Fischer ‘09) and many other metazoan lineages (e.g. Carroll ‘01, Brakefield ‘03, Carroll ‘08, Moczek ‘09, Wagner and Lynch ‘10). However, much of our understanding of developmental evolution has been generated using comparisons among distantly related species. At these time scales it can often be difficult to reconstruct the specific target of natural selection due to the accumulation of additional changes associated with later natural selection. To improve our ability to relate development (proximate causation) to morphological evolution (ultimate causation), greater appreciation of the processes underlying intraspecific variation is needed because this is the variation that serves as the fodder upon which natural selection acts.
Long bones are an ideal model system to dissect the developmental origins of adult variation because they are of great evolutionary importance and have long served as a developmental model system (e.g. Kronenberg ‘03, Farnum ‘07, Butterfield et al ‘10). However, long bone length has a complex developmental origin comprised of processes occurring from early development through postnatal growth. Thus understanding the genetic and developmental architecture of adult variation will require a thorough analysis many developmental stages in search of those that show a heritable, statistical correlation with adult morphology.
The Atchley-Hall model (Atchley and Hall ‘91) combines developmental and quantitative genetic perspectives into a single model of morphological evolution that provides a useful framework for modeling developmental variation in quantitative traits (Figs 1, 2). To simplify the study of complex structures, the Atchley-Hall model first dissects adult morphology into a series of developmental modules. In their empirical example, Atchley and Hall break the development of the mouse mandible into seven modules, representing the separate condensations that generate the mandibular body processes. Each module is then partitioned into a series of “developmental units”, or the smallest quantifiable developmental process (Fig. 1, e.g. cell division, cell size, timing of initiation, etc.). Thus, adult morphology can be modeled as the combined product of many developmental units, their interactions with one another, and their interaction with the surrounding environment. This model draws an explicit correlation between early development and adult morphology. Hall (‘03) later hypothesized that cellular condensations act as modular units of evolutionary change, implying a genetic (statistical) correlation between adult morphology and processes acting at the earliest stages of skeletal development.
Figure 1.

Simplified version of the Atchley Hall model stressing the key developmental units associated with variation in long bone length at different stages. The heavy arrows represent genetic interactions between stages while the light arrows represent the influence of the stage-specific environments on the developing long bone. The complete complement of genetic and non-genetic effects is best modeled in Fig. 2.
Figure 2.

A summary of the genetic and non-genetic effects influencing long bone length variation as predicted from the Atchley-Hall model. Our model stresses the importance of examining genetic and environmental effects on long bone development at all stages: embryonic development, early, and late stages of juvenile growth. Solid lines represent direct effects on the skeletal phenotype while dashed lines represent interactions among the various elements.
Variation in long bone length can, however, arise throughout ontogeny, either by modifying the proportions of the original mesenchymal condensation or through later allometric growth (Huxley ‘32). While developmental processes are sure to vary at any stage, variation generated late in life may simply negate earlier events, making them irrelevant to the patterns observed in adult form. Conversely, changes to early processes, such as altering the number of cells in a condensation, could have drastic effects on growth rates later in development. Incorporation of multiple time points can be incorporated into the traditional Atchley-Hall model by examining genetic correlations among different life stages and adult form (Fig. 1, 2), leaving the developmental units at each time independent of those at other stages. Examining the genetic correlations among age-specific traits will determine the specific time in development that would respond to natural selection on adult morphology and allow for more precise determination of the developmental origin of variation in adult form.
The Atchley-Hall model can be easily applied to any skeletal element derived from endochondral ossification or revised for other non-skeletal structures with a basic understanding of development. We have applied this expanded Atchley-Hall model to the study of the developmental bases of long bone length variation in the inbred mouse strains LG/J and SM/J. Whether variations in murine long bone primordia length or embryonic limb dimensions relate to adult limb size is unknown (Barham and Clarke ‘08, Yang ‘09). Examination of variation in the parental strains alone lacks the power needed for quantitative genetic analysis so we have examined growth series of ten recombinant inbred (RI) strains of mice generated from LG/J and SM/J inbred lines. Use of RI lines is a powerful tool for studies of development because individuals within each RI strain are genetically identical, allowing for pseudo-longitudinal studies of phenotypes requiring terminal procedures. Finally, to more precisely determine the cellular basis of this variation, we examined the histomorphology of long bone growth plates between 3 and 5 weeks, the time of maximum difference in growth rate, in the parental strains.
Murine long bone development
During embryonic development, after initial patterning and formation of the limb bud, mesenchymal stem cells aggregate and differentiate to form single cartilaginous anlagen, the precursors to limb long bones (Hall and Miyake ‘00). This single bar divides at the site of future joints to form the proximal to distal cartilaginous precursors of the long bones. As ossification begins, a bony collar surrounds the anlagen and expands towards the ends of the bone, establishing a growth plate. From this time on, proximal-distal lengthening occurs through the process of endochondral ossification occurring within these growth plates.
Growth plates are located between the epiphysis and diaphysis at either end of the long bones and are organized into distinct cellular zones: the reserve zone, the proliferative zone, and the pre-hypertrophic and hypertrophic zones (Fig. 3). Chondrocyte proliferation (cell division) and hypertrophy (change in cell size and shape) are the primary means by which mammalian long bones lengthen, with hypertrophy thought to contribute most to elongation (Hunziker and Schenk ‘89, Wilsman et al. ‘96a, b). During endochondral ossification the cartilage template produced by growth plate chondrocytes is filled in with bone following hypertrophic chondrocyte death and ensuing blood vessel invasion (reviewed in Kronenberg ‘03).
Figure 3.

The average lengths (in mm) of the humerus, ulna, femur, and tibia at various ages are shown for LG/J (solid line) and SM/J (dotted line) animals. Males and females are represented approximately equally for each age in the cohort (cohort sizes listed in Supplemental Table 1), with 3 extra males included in the 3–5 week age categories. E refers to 17.5 days post conception, and 0 refers to the day of birth; all other ages are given in weeks. Day E17.5-1 week lengths are diaphysis lengths, while 2–6 week lengths are epiphysis-to-epiphysis lengths. Standard deviations are shown by vertical bars and are listed in Supplemental Table 1.
Variation in adult long bone length can result from variation generated during limb bud patterning influencing the initial dimensions of the anlagen or through differential rates of long bone elongation via the action of growth plates at either end of the bone. For the purposes of our model, we have simplified mouse ontogeny into four pre-adult stages: embryonic development and morphogenesis, neonatal, and later juvenile growth. These loosely correlate with major changes in life history, the first marking the completion of morphogenesis, then birth and the transition between IGF2- and IGF1-mediated growth, weaning when the mouse begins to independently feed, and, finally, skeletal maturity. Events unfolding during morphogenesis can be modeled as originally proposed by the Atchley-Hall model whereby the number of cells, timing of condensation, mitosis rate, rate of cell death, and hypertrophy all contribute to the final proportions of the condensation (Figs 1). Growth plates at either end of the long bone are known to differentially contribute to adult long bone length and need to be modeled independently (Digby ‘16, Payton ‘32). Due to similarities in mechanisms of endochondral ossification, similar developmental processes (number of cells, rate of matrix synthesis, hypertrophy, etc.) affect rates of long bone elongation as affect the proportions of the initial condensation (Hunziker and Schenk ‘89, Wilsman et al. ‘96a, b). These complex processes can be approximated using simple histomorphological measurements of the growth plate (see below).
LG/J and SM/J skeletal variation
An excellent model for examining variation in skeletal formation are the LG/J and SM/J mouse strains, two inbred strains of mice selected for differences in adult body size (Goodale ‘41, MacArthur ‘44). QTL have been mapped for numerous adult skeletal dimensions including mandibular, scapular, vertebral, sacral, cranial, and limb measures (Leamy et al. ‘02, ‘98, Klinenberg et al. ‘04, Kenney-Hunt et. al ‘06, ‘08, Norgard et al. ‘08, ‘09). The observed differences in phenotypes between LG/J and SM/J can be attributed mainly to the QTL for those traits, although differences caused by maternal effects may also contribute to the variation observed between strains (Wolf et al, ‘02, Peripato and Cheverud ‘02, Peripato et al. ‘02). LG/J and SM/J exhibit significant variation in long bone length, differing by 2mm or approximately 13–19% of adult bone length (see below). For adult long bone lengths, heritability estimates and genetic correlations are very high, indicating strong common genetic control over variation in bone elongation processes across the different long bones. Thus, the previously identified 40 QTL for long bone lengths (Norgard et al. ‘08, ‘09) and their interactions must cause the observed differences in LG/J and SM/J adult long bone lengths by acting on specific processes of skeletal development or post-natal growth. At this time the precise timing and mechanisms by which these QTL act is unknown.
Methods
To examine the ontogenetic bases of adult long bone length variation we first describe the patterns of long bone growth and divergence between the parental stains, LG/J and SM/J. We then examine differences in postnatal growth, postnatal allometry, age-specific patterns of heritability within each sex among 10 RI lines, and the patterns of genetic correlation between age-specific traits. After narrowing in on the developmental period when divergence between the strains begins, we examine the cellular histomorphology and dynamics of the proximal tibial growth plate.
Animal Strains
The inbred mouse strains LG/J and SM/J (Jackson Laboratory, Bar Harbor), were used in this study. LG/J was selected for large body size at 60 days and has an average adult weight of ~40 g (Goodale ‘41), while SM/J was selected for small body size at 60 days and has an average adult weight of ~20 g (MacArthur ‘44). Both strains have been maintained by brother-sister mating for the last 60+ years. SM/J animals also maintain forced heterozygosity in the agouti gene region (Aw/a) to offset the low survival of pups born to a/a genotypes (Hrbek et al. ‘06). These two strains are completely homozygous (except for the agouti region in SM/J) and are polymorphic at ~1/3 of tested SNP markers. Males and females were maintained separately at a constant temperature of 21°C and with a 12-hour light-dark cycle. All mice were weaned at three weeks post partum into cages of five animals or fewer and fed Purina PicoLab Rodent Chow 20 (Purina, catalog number 5353) ad libitum. All work was performed with approval by the Washington University IACUC.
The recombinant inbred (RI) lines used in this study were derived from a cross of the LG/J, and SM/J. Creating RI lines from strains exhibiting extreme variation in body size has the advantage of increasing the genetic diversity of the experimental population. Since the initial cross of these parental strains, Cheverud and colleagues have clearly documented relatively high levels of genetic variation in morphological, physiological, and behavioral traits (Hrbek et al. ‘06, Kenney Hunt et al. ‘08, Norgard et al ‘08, ‘09 and reference therein).
The RI strain set formed from the cross of LG/J and SM/J was initiated with 55 strains. These stains were established and maintained using two males and two females per generation from the F2 to the F7 generation. To maximize inbreeding, the RI lines were thereafter maintained strictly by brother-sister mating. At approximately F20, the strains were considered fully inbred and by F30 had reached an inbreeding level of F > 0.9863 (Hrbek et al. ‘06). A gradual loss of strains was observed, associated with increased levels of inbreeding and homozygosity at the agouti locus (Hrbek et al. ‘06). At the time of this study, 10 strains survive, ranging from F35 to F48. To maintain consistency, strain numbers used in this manuscript correspond to the strain identification numbers used in the original cross (Hrbek et al. ‘06).
Specimen collection and whole mount long bone measurements
To determine the timing of morphological divergence, we collected, skeletonized, and measured mouse specimens for one prenatal time point, day E17.5, and four postnatal time points associated with important changes in growth or physiology: at birth; three weeks, when pups are weaned; six and ten weeks, when growth begins to slow and the skeleton is approaching maturity, respectively. Newborn specimens were weighed within six hours of their birth, euthanized with an IP injection of sodium pentabarbitol and fixed immediately in 10% buffered formalin for 4–7 days. Older specimens were euthanized with carbon dioxide and frozen until skeletal preparation. Specimens were cleared and stained using standard methods (Dingerkus and Uhler ‘77). To expedite clearing, we removed excess muscle from the specimen manually. All specimens were then stored in 100% glycerol with thymol until the time of measurement.
We measured four long bones, the femur, tibia, humerus, and radius, for all specimens. The ulna, rather than the radius, was measured for analysis of the parental strains. Eight newborn and embryonic (E17.5) specimens were measured per strain. Sexual dimorphism is not present until after three weeks of age (Kramer et al ‘98), therefore newborns were not sexed and are used in both the male and female analyses of the RI lines. Four to six specimens per sex per strain were measured for later time points. Long bones from post-weaning specimens were dissected and measured using digital calipers to the nearest 0.01mm or measured from scaled digital photographs taken with a Nikon DN100 camera mounted on a Nikon SMZ1000 dissecting microscope and measured using Image J (Rasband ‘97, Abramoff, et al ‘04). Body size was estimated using mass, which was measured weekly on a digital balance to the nearest 0.01gms.
Growth Plate Collection and Processing
To examine the cellular bases of long bone growth variation we also examined the growth dynamics of the proximal tibia growth plate. This growth plate contributes the most to final tibia length and therefore is ideal for these more detailed studies (Digby ‘16, Payton ‘32). Three days prior to sacrifice, 3–5 week male animals (cohort sizes listed in Supplemental Table 2) were injected with 5 mg oxytetracycline (OTC) per kg body weight. Following sacrifice, the growth plate of the left proximal tibia was split longitudinally and embedded in EMbed-812 (Wilsman et al. ‘96). Sections 1 μm thick were visualized at 40X total magnification on a Nikon Eclipse E800 microscope using a Nikon Plan Apo 10X/0.45 objective lens (Nikon, catalog number MRD00100) with a DAPI filter (excitation 358 nm, emission 461 nm).
Growth Plate Histomorphological Measurements
Growth rate of the proximal tibia was estimated by measuring the distance from the OTC signal in the metaphyseal bone to the chondro-osseous junction (COJ) in unstained growth plate sections. Five vertical measurements running from leading edge of the COJ to the leading edge of the OTC were spaced evenly throughout the sample, averaged, and divided by 3 days to generate a growth rate measurement (in μm/day) for a randomly chosen growth plate section. This measurement was repeated three times and averaged to generate the most robust estimate of growth rate.
As a first approximation for the cellular dynamics of long bone growth plate, growth zone heights were measured on polychrome-stained growth plate sections of the proximal tibial growth plate. These measurements are known to positively correlate with rates of long bone growth and serve as good proxies for underlying processes such as rates of mitosis, apoptosis, and hypertrpohy (e.g. Wilsman et al. ‘96, ‘08). Images were captured to encompass the full growth plate, including the proliferative (PZ) and hypertrophic (HTZ) zones (Fig. 3c); the pre-hypertrophic zone was very small in both strains and was not quantified. Heights of the PZ, HTZ, and full growth plate were measured using ImageJ (Rasband ‘97, Abramoff, et al ‘04).
Statistical analyses
Due to the non-linearity of postnatal growth caused by time-specific physiologic processes, we divided the period of postnatal growth into three phases – early (0–3wk), middle (3–6wk), and late growth (6–10wk) – for the purposes of studying the genetics of long bone growth. Multivariate patterns of heritability and correlation were also calculated in a combined analysis of long bone lengths among all ages and sexes. All growth and allometry data used to compare RI lines were log transformed before analysis. To standardize differences in scale, long bone lengths were compared to log((body size)1/3). All statistical analyses were performed in SYSTAT 10.2.
Variation among RI strains and sexes was examined at each age using the two-way mixed model ANOVA:
where an individual’s phenotype (Yij) is the sum of the grand mean (μ), the deviation due to the ith sex, the jth strain, and the interaction between the factors. The interaction term in this analysis can be interpreted as a measure of genetic variation in sexual dimorphism. Sex is considered a fixed factor while Strain is modeled as a random variable. When the interaction term fails to reach significance, it is removed from the model and the analysis run a second time using just the two main effects.
To better understand the developmental bases of adult variation, we also examined variation in growth rate (long bone length vs. time) and allometry (long bone length vs. body size) among the RI strains. Variation in growth rate among the RI strains was examined using the model:
where Age is considered a fixed factor (0, 3, 6, or 10 wks). A significant interaction term implies that there is significant variation in growth rate among the RI strains. Growth allometry was modeled similarly:
As above, significance in the interaction term implies that there are significant differences in growth allometry among the RI strains.
Variance in long bone length among the RI strains (σ2st) represents the total genetic variance across strains including additive, dominance, and epistatic components (Falconer and Mackay ‘97). Trait specific strain variance is calculated by:
where MSst is the mean square for Strain, and MSr is the residual, or error, mean square. When calculated from a mixed-model ANOVA this variance can be considered pooled across the other factors in the model, such as sex. Because sample sizes range from 6–8 per strain per age, n represents the average number of specimens among strains, typically 7.8. From this the broad-sense heritability can be calculated:
or the variance among strains divided by the total phenotypic variation. The variance and broad-sense heritability of the interaction terms is computed as:
where n represents the average number of specimens per strain per age-group, or four to six specimens per sex.
Multivariate analyses examining data across sexes, ages (or weights), strains, and all their interaction terms were also performed. Multivariate analyses of heritability provide a more accurate measure of significance by taking into account the correlations between characters. Due to the lack of sexual information on newborn specimens, they were excluded from this analysis. From these, multivariate heritability and genetic correlations were also calculated and verified with the univariate heritability measures. Similar to the above analyses, this was done as a three-way mixed model ANOVA:
Genetic correlations among long bone measurements at different ages and adult body size were calculated with the average strain-age-specific values for each strain using the Pearson Product Moment Correlation. Significant correlations imply that variation in these traits has a common genetic basis. A one-tailed probability and the Bonferroni, correction for multiple comparisons were used to determine whether these correlations are significantly greater than zero. Correlations were also examined using Spearman Rank Order Correlation.
Variation in growth plate function was also evaluated using a multi-way ANOVA in the LG/J and SM/J parental strains. The contributions to variability due to age, strain, sex, and their two- and three-way interactions were determined by first testing against a full model, with family nested within the three-way interaction to account for environmental maternal effects:
The models describing growth rate and proportions of growth plate are as follows:
Results
Bone growth in the parental strains: whole mount
No significant strain differences in bone lengths or elongation rates were observed in utero or for the first postnatal week (Fig. 3, Supp. Table 1, 2). Between birth and 1 week of age, the humerus and femur diaphyses of both strains grew at ~1.8 mm/wk, while the ulna and tibia diaphyses grew slightly faster at ~2.6 mm/wk. All bones grew faster during the earliest periods, with peak growth occurring between birth and 1 week of age. Family effects were significant from day E17.5 to 1 week of age, indicating that environmental effects (uterine effects, nursing effects, etc.; Fig. 2) play a greater role in generating long bone length variation at these early stages than the genotypic differences between LG/J and SM/J.
At 2 weeks of age, the humerus and femur were significantly longer in LG/J than in SM/J. By weaning (3wks), all long bones were significantly longer in LG/J than in SM/J (Supp. Table 1). During weeks 2 to 5, LG/J bones grew between 0.20 and 0.74 mm/wk faster than SM/J bones, but the timing of peak elongation rate varied between skeletal elements (Fig. 3, Supp. Tables 1, 2). The greatest difference in ulna elongation rate between the strains occurred at 3 weeks (0.74 mm/wk faster in LG/J). Humerus and femur showed the greatest elongation rate difference between strains at 4 weeks (0.51 and 0.64 mm/wk faster in LG/J than SM/J, respectively). Tibia showed the most elongation rate difference at 5 weeks (0.69 mm/wk faster in LG/J at 5 weeks of age). The growth rates for LG/J and SM/J long bones slowed greatly and growth rate differences between the strains became much smaller after 4 weeks as the long bones approached their adult proportions, at around 6 weeks.
RI lines: Quantitative genetic analysis of growth differences
Age-specific long bone length data and their standard deviations were calculated for each RI strain and sex (Fig. 4, Supplementary Tables 3–5). Heritable variation in long bone length was significant at each of the four postnatal time points ranging from 30% to 70% (Table 1). Significant sexual dimorphism was present at all later time points, but significant genetic differences in sexual dimorphism among strains (sex * strain) were only present at 3 weeks (P = 1 × 10⁻¹²). This may be due to sexual dimorphism arising earlier in some strains than others. Variation among strains at birth was calculated with a simplified model not including sex or the interaction term because sex is unknown for these individuals.
Figure 4.
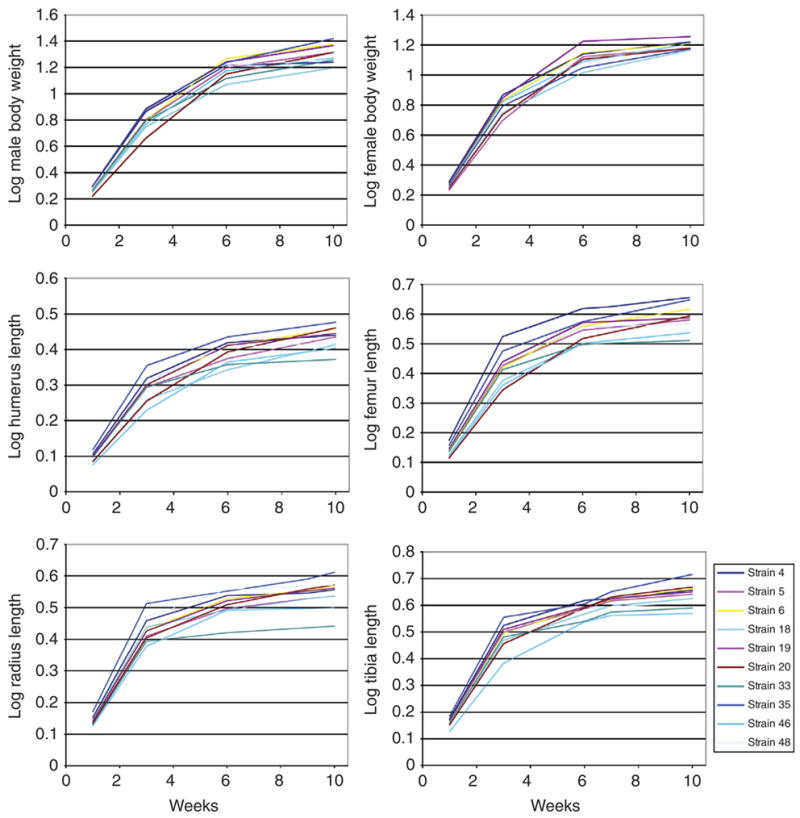
Examples of growth curves for body size and long bone length for male and female individuals of RI strains of mice. Curves plotted with spline curves fit to the average size of all individuals at each age. Take note of the variation among strains within each plot. Significant variation in growth rate was found at early, middle, and late phases.
Table 1. Heritable variation among strains.
Heritable variation among strains (H2st) organized by age and long bone pooling across sexes. Genetic variation in sexual dimorphism (Sexi × Strainj) was only found in three-week-old individuals and was likely the result of dimorphism arising at different times among strains. Significant probabilities highlighted in bold.
| Newborn | σ2p | σ2st | H2st | Pst |
|---|---|---|---|---|
| Femur | 0.003 | 8.9E-04 | 0.36 | 5.4E-05 |
| Tibia | 0.002 | 0.001 | 0.63 | 1.6E-11 |
| Humerus | 0.001 | 5.9E-04 | 0.50 | 6.3E-08 |
| Radius | 0.001 | 7.5E-04 | 0.64 | 3.8E-12 |
| Multivariate test statistic | 1.0E-12 | |||
| 3 week | σ2p | σ2st | H2st | Pst |
| Femur | 0.002 | 0.001 | 0.73 | 1.1E-07 |
| Tibia | 0.001 | 0.001 | 0.77 | 3.5E-09 |
| Humerus | 0.001 | 8.3E-04 | 0.74 | 6.0E-08 |
| Radius | 0.001 | 7.9E-04 | 0.66 | 3.9E-06 |
| Multivariate test statistic | 2.3E-28 | |||
| 6 week | σ2p | σ2st | H2st | Pst |
| Femur | 0.009 | 0.003 | 0.34 | 0.01 |
| Tibia | 8.8E-04 | 5.4E-04 | 0.61 | 4.9E-05 |
| Humerus | 6.3E-04 | 3.0E-04 | 0.48 | 0.001 |
| Radius | 0.001 | 6.9E-04 | 0.67 | 7.4E-06 |
| Multivariate test statistic | 4.1E-16 | |||
| 10 week | σ2p | σ2st | H2st | Pst |
| Femur | 0.004 | 0.002 | 0.50 | 0.001 |
| Tibia | 4.5E-04 | 2.1E-04 | 0.48 | 0.001 |
| Humerus | 7.4E-04 | 4.1E-04 | 0.56 | 3.4E-04 |
| Radius | 4.5E-04 | 1.6E-04 | 0.36 | 0.001 |
| Multivariate test statistic | 3.0E-15 | |||
Elongation rates (mm/week) were calculated for each sex and strain based on the average age-specific values of each long bone (Table 2, Supp. Table 3–5). Consistent with the analysis of the parental strains, the fastest rates of growth occur between birth and three weeks, gradually slowing through the later ages. Considerable variation in long bone growth rate is present among strains and among the different long bones. Multivariate tests confirm significant genetic variation in growth rate during each growth period. Heritable variation in growth rate declines from approximately 50% from birth to three weeks, to about 30% between weeks 3 and 6, to less than 15% between six and ten weeks (Table 2, 4). As can be seen in Fig. 5, growth rates are quite variable, with the relative ordering of strains changing from age to age, especially at earlier ages.
Table 2. Parental strain growth rate.
Results from ANOVA testing for differences in growth rate. Significant variation in growth rate was found at all ages, but only in the forelimb elements between six and ten weeks. Note that heritable variation in growth rate decreases over time.
| 0–3 weeks | σ2p | σ2st | H2st | Pst | σ2sttp | H2sttp | Psttp |
|---|---|---|---|---|---|---|---|
| Femur | 0.001 | 5.3E-04 | 0.48 | 1.0E-09 | 5.7E-04 | 0.50 | 1.2E-10 |
| Tibia | 0.002 | 9.1E-04 | 0.57 | 1.3E-13 | 7.5E-04 | 0.52 | 1.8E-11 |
| Humerus | 0.001 | 6.6E-04 | 0.61 | 1.8E-15 | 4.1E-04 | 0.49 | 2.6E-10 |
| Radius | 0.002 | 0.001 | 0.67 | 1.0E-15 | 7.0E-04 | 0.53 | 5.9E-12 |
| Multivariate test statistic | 2.4E-20 | 5.3E-18 | |||||
| 3–6 week | σ2p | σ2st | H2st | Pst | σ2sttp | H2stwt | Pstwt |
| Femur | 0.001 | 5.7E-04 | 0.15 | 5.6E-13 | 0.34 | 0.34 | 5.8E-06 |
| Tibia | 0.001 | 5.9E-04 | 0.41 | 1.4E-14 | 0.31 | 0.31 | 2.3E-05 |
| Humerus | 8.2E-04 | 4.1E-04 | 0.16 | 9.1E-11 | 0.30 | 0.30 | 4.0E-05 |
| Radius | 9.6E-04 | 5.4E-04 | 0.35 | 1.4E-13 | 0.43 | 0.43 | 2.1E-08 |
| Multivariate test statistic | 1.2E-13 | 1.2E-13 | |||||
| 6–10 week | σ2p | σ2st | H2st | Pst | σ2sttp | H2stwt | Pstwt |
| Femur | 4.8E-04 | 1.3E-04 | 0.28 | 1.1E-04 | . | 0.20 | |
| Tibia | 3.2E-04 | 5.3E-05 | 0.16 | 0.01 | 0.15 | ||
| Humerus | 4.9E-04 | 1.7E-04 | 0.35 | 3.1E-06 | 5.4E-05 | 0.15 | 0.02 |
| Radius | 3.7E-04 | 8.6E-05 | 0.23 | 8.2E-04 | 4.3E-05 | 0.13 | 0.03 |
| Multivariate test statistic | 4.3E-06 | 2.9E-02 | |||||
Table 4. RI line growth and allometry MANOVA.
Results from the multivariate analysis of variance for growth (A) and allometry (B) among the RI lines showing the multivariate heritability and probability for each. Significant values are highlighted in bold.
| Growth | H2st | Pst | H2sttp | Psttp |
|---|---|---|---|---|
| Femur | 0.37 | 4.30E-07 | 0.12 | 0.03 |
| Tibia | 0.48 | 9.10E-11 | 0.16 | 0.006 |
| Humerus | 0.48 | 1.00E-09 | 0.17 | 1.30E-04 |
| Radius | 0.46 | 1.00E-09 | 0.27 | 0.01 |
| Multivariate test statistic | 4.20E-22 | 1.70E-10 | ||
| Allometry | H2st | Pst | H2stwt | Pstwt |
| Femur | 0.32 | 1.10E-05 | 0.23 | 6.40E-04 |
| Tibia | 0.41 | 1.20E-10 | 0.28 | 1.10E-06 |
| Humerus | 0.19 | 3.10E-03 | . | 0.08 |
| Radius | 0.44 | 4.00E-09 | 0.36 | 5.50E-07 |
| Multivariate test statistic | 1.80E-14 | 1.70E-10 | ||
Figure 5.

Examples of allometric variation for the male femur (left) and tibia (right) among the RI lines plotted as the expected values at birth, three, six, and ten weeks against scale corrected body size. Significant allometric variation was not detected in the femur. Significant allometric variation was found in the middle phase of tibia growth.
RI lines: Allometric variation
Genetic variation in allometry (H2stwt) is generally lower than that found for growth rate, in part because the long bone lengths vary with body size in a coordinated fashion (Fig. 5, Table 3, 4). During the early phase of growth, no significant genetic variation was found in the allometry of any long bone. In the late phase, genetic variation in allometry only accounts for a small amount of total variation for the radius (H2stwt= 0.14). However, significant genetic variation in allometry was found for the tibia and radius during the middle phase of growth (H2stwt=0.30) indicating that a significant portion of long bone elongation is locally regulated. Genetic variation in allometry is significant in each growth period using the multivariate test. Inspection of the canonical correlations reveals that the radius has a different allometric pattern than the other long bones and, therefore, is likely driving the significance of this multivariate pattern.
Table 3. RI line allometry.
Results from ANOVA testing for differences in allometry. Significant variation was rare and, when found, contributed relatively little to heritable variation (<30%).
| 0–3 weeks | σ2p | σ2st t | H2st | Pst | σ2stwt | H2stwt | Pstwt |
|---|---|---|---|---|---|---|---|
| Femur | 0.002 | 7.1E-04 | 0.37 | 4.0E-07 | . | . | 0.81 |
| Tibia | 0.001 | 6.9E-04 | 0.48 | 8.9E-11 | . | . | 1 |
| Humerus | 0.001 | 6.1E-04 | 0.46 | 1.0E-09 | . | . | 0.68 |
| Radius | 0.001 | 5.0E-04 | 0.46 | 1.0E-09 | . | . | 0.35 |
| Multivariate test statistic | 8.4E-13 | 3.5E-04 | |||||
| 3–6 week | σ2p | σ2st t | H2st | Pst | σ2stwt | H2stwt | Pstwt |
| Femur | 3.8E-04 | 2.0E-05 | 0.15 | 0.01 | . | . | 0.18 |
| Tibia | 3.9E-04 | 1.1E-04 | 0.41 | 9.9E-08 | 1.1E-04 | 0.28 | 1.1E-04 |
| Humerus | 4.0E-04 | 3.4E-05 | 0.16 | 0.01 | . | . | 0.08 |
| Radius | 4.2E-04 | 1.1E-04 | 0.35 | 2.3E-06 | 1.1E-04 | 0.26 | 2.3E-04 |
| Multivariate test statistic | 7.9E-12 | 2.1E-08 | |||||
| 6–10 week | σ2p | σ2st t | H2st | Pst | σ2stwt | H2stwt | Pstwt |
| Femur | 3.6E-04 | 3.8E-05 | . | 0.06 | . | . | 0.09 |
| Tibia | 2.4E-04 | 8.4E-06 | . | 0.25 | . | . | 0.32 |
| Humerus | 4.0E-04 | 6.5E-06 | . | 0.35 | . | . | 0.40 |
| Radius | 2.6E-04 | 3.4E-05 | 0.13 | 0.03 | 0.14 | 0.14 | 0.02 |
| Multivariate test statistic | 0.02 | 0.03 | |||||
The slope of the allometric regression informs us about the relationship between body size and limb length. When plotted against scale-corrected body size, a slope of one, or isometry, implies that the growth of the body and long bone is proportional. From 0–3 weeks, the long bones consistently have slopes significantly greater than 1.0 (1.4 < k < 1.8). Long bones grow approximately isometrically from 3–6 weeks (0.75 < k <1.15, significance for difference in isometry varies) and significantly less than isometry from 6–10 weeks (0.20 < k < 0.55). This indicates that the skeleton is growing significantly faster than body size early but significantly slower after six weeks (Fig. 5).
RI lines: Genetic correlations age-specific traits
The genetic correlation among long bone elements is greatest between long bones of the same age (r >0.9, Table 5). Weaker, but still high, correlations (r >0.8) were found among long bones of six and ten week old individuals. Moderate to high correlations (0.5 to 0.8) were found among the variation at three weeks and variation at later time points. Correlations between newborns and later ages were generally weak (r <0.4) and were never significantly greater than a correlation of zero. Males and females exhibit similar patterns.
Table 5. Genetic correlations.
Genetic correlations among long bones and adult body size. Note that the highest correlations are among long bones of the same age, genetic correlations tend to lessen with increasing time, and that variation in newborns does not correlate with variation at any age. Significant values surpassing the one tailed test (P > 0.55) are highlighted in bold. Values also surpassing the Bonferroni level of significance for multiple measurements (P > 0.89) are also italicized.
| Newborn femur | 3 week femur | 6 week femur | 10 week femur | Newborn humerus | 3 week humerus | 6 week humerus | 10 week humerus | Newborn radius | 3 week radius | 6 week radius | 10 week radius | Newborn tibia | 3 week tibia | 6 week tibia | 10 week tibia | 10 week Body weight | |
|---|---|---|---|---|---|---|---|---|---|---|---|---|---|---|---|---|---|
| Newborn Femur | 0.31 | 0.16 | −0.15 | 0.92 | 0.30 | 0.19 | 0.04 | 0.93 | 0.25 | −0.01 | −0.33 | 0.86 | 0.18 | 0.42 | −0.04 | −0.18 | |
| 3 week femur | 0.39 | 0.76 | 0.40 | 0.43 | 0.94 | 0.66 | 0.42 | 0.47 | 0.91 | 0.52 | 0.31 | 0.38 | 0.94 | 0.63 | 0.60 | 0.21 | |
| 6 week femur | 0.15 | 0.71 | 0.72 | 0.25 | 0.71 | 0.92 | 0.84 | 0.33 | 0.63 | 0.90 | 0.75 | 0.22 | 0.79 | 0.87 | 0.86 | 0.59 | |
| 10 week femur | 0.25 | 0.82 | 0.95 | −0.25 | 0.34 | 0.63 | 0.87 | −0.06 | 0.36 | 0.57 | 0.79 | −0.26 | 0.46 | 0.42 | 0.93 | 0.81 | |
| Newborn humerus | 0.92 | 0.37 | 0.09 | 0.20 | 0.43 | 0.29 | 0.06 | 0.88 | 0.31 | 0.20 | −0.29 | 0.95 | 0.28 | 0.57 | −0.05 | −0.18 | |
| 3 week humerus | 0.46 | 0.92 | 0.65 | 0.71 | 0.50 | 0.63 | 0.42 | 0.39 | 0.96 | 0.52 | 0.32 | 0.31 | 0.94 | 0.63 | 0.59 | 0.01 | |
| 6 week humerus | 0.21 | 0.72 | 0.92 | 0.87 | 0.19 | 0.72 | 0.77 | 0.26 | 0.55 | 0.89 | 0.56 | 0.31 | 0.65 | 0.83 | 0.72 | 0.50 | |
| 10 week humerus | 0.34 | 0.83 | 0.86 | 0.92 | 0.40 | 0.84 | 0.84 | 0.11 | 0.35 | 0.82 | 0.83 | 0.00 | 0.46 | 0.70 | 0.91 | 0.70 | |
| Newborn radius | 0.93 | 0.48 | 0.33 | 0.44 | 0.88 | 0.48 | 0.41 | 0.49 | 0.32 | 0.12 | −0.17 | 0.83 | 0.33 | 0.52 | 0.06 | −0.09 | |
| 3 week radius | 0.43 | 0.88 | 0.67 | 0.77 | 0.44 | 0.88 | 0.60 | 0.83 | 0.47 | 0.37 | 0.27 | 0.18 | 0.91 | 0.45 | 0.57 | −0.03 | |
| 6 week radius | −0.14 | 0.42 | 0.80 | 0.71 | −0.10 | 0.43 | 0.89 | 0.68 | 0.10 | 0.31 | 0.73 | 0.19 | 0.57 | 0.87 | 0.72 | 0.55 | |
| 10 week radius | 0.14 | 0.81 | 0.81 | 0.87 | 0.25 | 0.74 | 0.75 | 0.91 | 0.35 | 0.80 | 0.60 | −0.34 | 0.50 | 0.55 | 0.87 | 0.71 | |
| Newborn tibia | 0.86 | 0.36 | 0.14 | 0.22 | 0.95 | 0.49 | 0.25 | 0.39 | 0.83 | 0.36 | 0.01 | 0.21 | 0.20 | 0.55 | −0.11 | −0.17 | |
| 3 week tibia | 0.45 | 0.94 | 0.77 | 0.85 | 0.42 | 0.94 | 0.73 | 0.90 | 0.48 | 0.94 | 0.44 | 0.80 | 0.41 | 0.66 | 0.70 | 0.21 | |
| 6 week tibia | 0.30 | 0.87 | 0.93 | 0.95 | 0.31 | 0.81 | 0.92 | 0.94 | 0.49 | 0.75 | 0.74 | 0.90 | 0.36 | 0.87 | 0.64 | 0.37 | |
| 10 week tibia | 0.38 | 0.83 | 0.85 | 0.92 | 0.39 | 0.72 | 0.79 | 0.89 | 0.60 | 0.77 | 0.56 | 0.93 | 0.36 | 0.81 | 0.94 | 0.69 | |
| 10 week body weight | −0.27 | 0.21 | 0.59 | 0.81 | 0.14 | 0.67 | 0.91 | 0.77 | 0.38 | 0.59 | 0.76 | 0.80 | 0.23 | 0.72 | 0.94 | 0.87 |
Bone growth in the parental strains: histomorphological analysis
To analyze the cellular dynamics of a growing long bone we examined the growth plate of the proximal tibia for LG/J and SM/J mice at 3, 4, and 5 weeks of age, the period of maximum difference in elongation rate between the strains. The proximal tibial growth rate was approximately 35–40 μm/day greater in LG/J than in SM/J throughout this period (Fig. 6, Table 6), with the SM/J proximal tibia growing, on average, at only ~75% the rate of LG/J proximal tibia. Growth rate decelerated with age for both strains, by ~16% at 4 weeks and ~32% at 5 weeks relative to the 3 week growth rate. The linear decrease in growth rate in both strains during this period suggests that the fastest growth rates occur at or before 3 weeks of age, consistent with previous analyses.
Figure 6.

The proximal tibial growth rates (μm/day) of the LG/J (dotted line) and SM/J (solid line) strains of mice from 3–5 weeks of age are plotted. Growth rates were determined by oxytetracycline injection and subsequent histological measurement of the proximal tibiae of animals at 3, 4, and 5 weeks of age (n = 5–7 animals, listed in Table 7).
Table 6. Histomorphometry.
Characteristics of the LG/J vs. SM/J proximal tibial growth plate. Growth plate characteristics are listed by strain and age (3, 4, or 5 weeks of age) for male animals.
| Strain | 3 weeks | N | 4 weeks | N | 5 weeks | N | Multivariate significance across ages |
|---|---|---|---|---|---|---|---|
| Total Growth Plate | |||||||
| SM/J | 254 ± 11 | 6 | 231 ± 7 | 5 | 212 ± 12 | 6 | |
| LG/J | 350 ± 9 | 6 | 345 ± 15 | 6 | 271 ± 30 | 7 | |
| 3.60E-12 | 8.99E-13 | 1.16E-05 | 1.35E-07 | ||||
| p-value | |||||||
| Proliferative Zone Height | |||||||
| SM/J | 156 ± 6 | 6 | 145 ± 7 | 5 | 142 ± 12 | 6 | |
| LG/J | 200 ± 6 | 6 | 190 ± 10 | 6 | 162 ± 17 | 7 | |
| 1.82E-11 | 7.90E-08 | 0.003 | 1.70E-08 | ||||
| p-value | |||||||
| Hypertrophic Zone | |||||||
| SM/J | 101 ± 6 | 6 | 89 ± 4 | 5 | 70 ± 4 | 6 | |
| LG/J | 151 ± 6 | 6 | 152 ± 6 | 6 | 110 ± 17 | 7 | |
| 5.40E-12 | 1.46E-10 | 5.00E-09 | 6.19E-06 | ||||
| p-value | |||||||
Consistent with the proximal tibia growth rates, total growth plate heights in LG/J animals were ~72% greater than in SM/J animals, with a greatest differences at 3 and 4 weeks (~100 μm). Differences at 5 weeks were considerably less, only ~50μm, and are associated with the reduction in growth rate. When strain-based differences were ignored, growth plate height decreased 5% at 4 weeks and 20% at 5 weeks, relative to 3 week heights, indicating that reduction in growth plate height occurs rapidly as mice approach skeletal maturity. In both strains PZ and HTZ height decreased between 3 and 5 weeks (Figure 8, Table 6). We observed little to no decrease in total growth plate, PZ, or HTZ heights between 3 and 4 weeks of age in LG/J animals (Figure 7). But, all three measures gradually decrease in SM/J mice over this time. SM/J growth zone heights were, on average, only 80% of LG/J PZ heights and 63% of LG/J HTZ heights. In particular, it appeared that LG/J growth plates decreased in size at a slower rate than those from the SM/J mice (Fig. 7). Taken together these results suggest that the degree to which chondrocytes hypertrophy, as indicated by HTZ height contributes a great deal to long bone length variation between these strains.
Figure 7.

A section of the proximal tibia of a 3-week-old LG/J male used to determine the heights of the growth plate and growth zones. A section is shown with (A) and without (B) lines drawn at the reserve-proliferation boundary (R-P; top line), proliferative-hypertrophic boundary (P-H; middle line), and chondro-osseous junction (COJ; lower line). The heights (μm) of the proximal tibial growth plates of LG/J and SM/J strains of mice from 3–5 weeks of age (n = 5–7) are illustrated (C). The height of the bar represents the total growth plate height, the heights of the light gray portion of the bars represent the heights of the hypertrophic zone, and the heights of the dark gray portions of the bars represent the heights of the proliferative zone. Numerical values and cohort sizes for this data is given in Table 7.
Discussion
Long bones of adult LG/J and SM/J inbred mouse strains vary by approximately 13% in total length. The developmental basis of this variation, while complex, appears isolated to a relatively narrow window of ontogeny between three and six weeks of age. The observation of significant family effects at younger ages (< 2 weeks) is not surprising and indicates that maternal or general environmental differences can potentially play an important role in skeletal development at early stages in the mouse (Fig. 2). Exactly how and to what extent levels of parental attention and neonatal nutrition affect growth at early ages is unknown for these strains, but their effects on bone length appear to decline by 2–3 weeks of age. Heritable, genetic variation is present at all postnatal stages, but only variation generated between 3 and 6 weeks actually correlates with adult morphology. In most cases, sexually dimorphic differences in bone length were not observed in these strains prior to 3 weeks of age. Significant variation in the rate of bone growth is present and highly significant at all stages of development but appears most significant to the generation of adult variation between 3 and 5 weeks of age. Mechanistically, it appears that differences between LG/J and SM/J are caused by two processes: 1) LG/J maintains faster initial whole bone elongation rates than SM/J, beginning around 1–2 weeks of age, and 2) LG/J delays the linear reduction in proximal tibial growth rate and growth zone heights observed in SM/J mice from 3–5 weeks.
Murine growth and development
Genetic studies of murine growth in total body size (mass) have typically found a low correlation between early post-natal body weight and adult body weight (e.g. Falconer et al. ‘78, Cheverud et al. ‘83, Riska et al. ‘84, Atchley and Zhu ‘97). Our results for long bone length are consistent with these studies and with previous longitudinal studies of murine growth in the LG/J by SM/J intercross (e.g. Cheverud et al. ‘96, Kramer et al. ‘98, Vaughn et al. ‘99). Further illustrating the physiological and genetic dissociation between early and late development, Cheverud et al. (‘96) and Vaughn et al. (‘99) discovered distinct QTLs responsible for variation in early and late phases of growth in the LG/J by SM/J intercross. Given that selection for increased or decreased body size was performed at 60 days (8.5wks) in these strains, there is no a priori reason to assume the selection affected developmental processes at any particular time. Selection simply acted on the developmental variation with the strongest genetic correlations to body size at 8.5 weeks.
In previous work on bone lengths in LG/J and SM/J, 40 unique genomic regions (QTL) associated with multiple or individual adult long bone lengths were discovered (Kenney-Hunt et al. ‘06, Norgard et al. ‘08, ‘09). QTL mapping in a phenotypically normal population, such as the intercross derived from LG/J and SM/J, leads to identification of QTL with very small effects on the phenotype (<10% the total phenotypic variance or about 0.25 SD units), allowing identification of genetic regions that modulate bone growth and elongation. Based on our results, most of these QTL are predicted to affect whole body size, general skeletal growth, or endochondral ossification rather than early embryonic development.
Previous studies on mammalian growth plates have indicated that cellular enlargement in the hypertrophic zone contributes most to daily elongation in the growth plate, with hypertrophic cell volume and shape changes during growth deceleration a major cause of the differential growth observed between proximal and distal radial and tibial growth plates (Breur et al. ‘91, Wilsman et al. ‘96a, ‘08, Stokes et al. ‘02). Given the close relation of hypertrophy to growth plate elongation, it is probable that the observed length differences between LG/J and SM/J are caused at least in part by differential regulation of hypertrophy, with evidence provided by the greater than 50μm difference in hypertrophic zone heights observed from 3–5 weeks between LG/J and SM/J. The contributions of proliferation, although smaller, are no less important; changes in the duration of G1 are also correlated with differential growth (Wilsman et al. ‘96b). Given that proliferative zone heights are ~50 μm greater in LG/J at 3 weeks and then decrease to roughly the same height as in SM/J by 5 weeks, proliferation most likely also plays a role in growth differences between strains. A limitation of this study is the indirect relationship of growth plate zone heights to kinetic activity or linear growth; an increase in growth rate may be coupled with a decrease in growth plate height (Hall ‘05). Limitations aside, the combination of measuring whole bone lengths, proximal tibial growth rate, and proximal tibial histomorphology provides a preliminary glimpse into the kinetics involved in modulating bone length between the LG/J and SM/J strains. This work has set the stage for more detailed analysis of growth kinetics at 3–5weeks of age where we are now examining the relative contributions to growth of both hypertrophic and proliferative chondrocytes, including cell cycle duration, matrix synthesis, and cellular shape change and enlargement. To elucidate the molecular bases of this variation, we are also examining the differential regulation of circulating growth factors and their downstream targets. Once complete, these studies should provide a thorough understanding of the developmental origins of adult variation in long bone length.
Mammalian long bone variation and the response to natural selection
The genetic correlation among age specific traits allows us to predict the developmental stage that would respond to natural selection if it were to act on adult morphology. While heritable variation is present at all developmental stages, only developmental processes acting between three and five weeks would respond if natural selection were to act on adult limb length. Contrary to the prediction of Hall (‘01), early development does not appear to correlate with adult limb length variation between LG/J and SM/J. While our analysis is limited to a single species and population we can use these results to predict the how limb length variation has evolved among rodents and other mammalian taxa. For example, Rolian (‘08) suggested that variation in length among long bones in outbred CD-1 mice is the result of variable numbers of proliferating chondrocytes early in development (prior to birth). Consistent with this observation, Rolain (‘08) also suggested that long bone length variation between Meriones unguiculatus, the Mongolian gerbil, and CD-1 mice, is the due to an increase in the frequency of cell division. The differences in our findings may reflect differences among mouse strains or simply differences in our methodology: cross sectional comparisons between long bones versus pseudo-longitudinal genetic analysis. It will be interesting to further explore variation among other mouse strains and rodent species to test these conflicting observations. Consistent with both sets of observations, Chiroptera, the bats, reprogram early limb patterning and, later, increase levels of chondrocyte hypertrophy to generate their extremely elongate long bones. (Sears et al. ‘06, Ray and Capecchi ‘08, Cretekos et al ‘08, Farnum et al ‘08a, b, Hockman et al. ‘08, ‘09), although the precise sequence of developmental evolution has not yet been determined.
The genetic correlations among the different long bone lengths are quite high, generally above 90%, consistent with previous studies in the Advanced Intercross population formed from the same parental strains (Kenney-Hunt et al, ‘06, Norgard et al, ‘08, ‘09). The level of morphological integration is quite high indicating a common set of genetic variants affecting the lengths of all the limb long bones. This suggests that the genetic factors responsible for the observed variation are either in general growth factors and/or in local growth plate responses to those factors. It also suggests that these local responses are similar at each growth plate and that growth dynamics studied at any one growth plate are likely to be similar to those operating at all long bone growth plates.
The strong integration observed among the long bones would constrain the independent evolution of fore- and hindlimbs under differential selection on the two limbs. In order for independent adaptation of the limbs, the observed strong correlations must be overcome or reduced. Indeed, species that have differentially adapted limbs often have lower levels of long bone integration across limbs (Hallgrimsson et al, ‘02; Hallgrimsson and Young, ‘05; Rolian, ‘09). Pavlicev et al (‘08) showed that there is genetic variation in the level of integration between limb bone length and body weight in the LG/J by SM/J Advanced Intercross Line. With independent selection on fore- and hindlimb lengths, this variation in integration (Wagner et al, ‘07; Pavlicev et al, ‘10).
Conclusion and prospective
Great progress has been made towards understanding the developmental and molecular bases of morphological evolution (e.g. Carroll ‘01, Brakefield ‘03, Carroll ‘08, Moczek ‘09, Wagner and Lynch ‘10). Some authors have declared that this progress has led to the next great synthesis of biological disciplines, bringing together experimental developmental biology and evolutionary theory, fields which have been largely separated since the early 20th century (Carroll ‘01, Whitefield ‘08). However, evolutionary-developmental biology has been slow to embrace population genetics and the analysis of quantitative traits, two hallmarks of traditional evolutionary theory. In fact, quantification of experimental results remains rare in most experimental studies of development (Cooper and Albertson ‘08). If both evolutionary and developmental biologists are to embrace this proposed synthesis in the coming years, explicit incorporation of these factors is critical.
The Atchley-Hall model, with the incorporation of ontogenetic variation, provides a useful conceptual and analytical framework to study the developmental bases of quantitative variation. Analytically, this model provides a detailed approach to study the quantitative genetics of ontogenetic variation. With a basic understanding of development this framework can be easily applied to most structures and organs. Unfortunately, this approach is not widely applicable to non-model species. Conceptually, however, its power is not lost. First, it is important to determine the time in development when variation associated with adult morphology arises (Fig. 1). As we have shown, early development does not always correlate with variation in adult morphology, which appears to be the assumption in many studies of comparative developmental biology. Narrowing the timing of divergence will also allow for better predictions of the potential sources of environmental variation (Fig. 2). As we, and others, have shown, early mammalian development is susceptible to variability in the mother’s environment. Later processes, while less affected by maternal effects, are more prone to external forces that may induce a phenotypic plasticity as a response.
Levels of gene expression can vary greatly with limited, downstream phenotypic effect (Yucel and Small ‘06, Oleksiak et al ‘02; ‘05, Crawford and Oleksiak ‘07). Only 30–50% of expression variation is heritable (narrow-sense) and only for 10–50% of the genes known to have variable expression (reviewed in Stamatoyannopoulos ‘04, Gibson and Weir ‘05). Therefore, once the period of divergence has been narrowed, it is then useful to examine which cellular-level processes (the “development units”) occurring at that time contribute to patterns of variation. Variation in rates of long bone elongation, for example, can result from many different processes (Fig. 1). Once these cellular level processes are better understood it may be possible combine mapping and candidate gene approaches to dissect the molecular regulation causing the variation. Without such a conceptual breakdown it would be nearly impossible to convincingly dissect the effects of the numerous QTL on long bone length variation between LG/J and SM/J mouse strains. Our analyses have shown that many of the previously mapped QTL are likely to affect global skeletal growth and that very little of the variation is due solely to genetic variation altering locally acting signaling molecules. Therefore, later, more detailed studies should examine the ways in which global signaling molecules become locally interpreted.
We have documented that variation in long bone length is the result of variation in postnatal growth processes, not early morphogenesis as predicted (Hall ‘03). This research is an important step towards understanding the genetic and molecular basis of morphological variation in murine long bone length. If selection were to act solely on adult morphology in these mice, the response to selection would only be visible during the middle phase of growth, not during embryogenesis. If we consider one of the objectives of evo-devo to better understand the developmental bases of evolutionary change, not just to understand the evolution of development, then more studies such as this are necessary in the future.
Supplementary Material
Acknowledgments
This work supported by Award Number R01 AR053224 from the National Institute of Arthritis and Musculoskeletal and Skin Diseases
The authors would like to thank Dr. Cornelia E. Farnum for technical advising and comments on the manuscript and C. Idleburg for sectioning. This work supported by Award Number R01 AR053224 from the National Institute of Arthritis and Musculoskeletal and Skin Diseases. The content is solely the responsibility of the authors and does not necessarily represent the official views of the National Institute of Arthritis and Musculoskeletal and Skin Diseases or the National Institutes of Health. E.A.N. also supported by a Monticello College Foundation Olin Fellowship for Women and a Ford Foundation Diversity Dissertation Fellowship.
References
- Abramoff MD, Magelhaes PJ, Ram SJ. Image Processing with ImageJ. Biophotonics International. 2004;11:36–42. [Google Scholar]
- Atchley WR, Hall BK. A model for development and evolution of complex morphological structures. Biological Reviews. 1991;66:101–157. doi: 10.1111/j.1469-185x.1991.tb01138.x. [DOI] [PubMed] [Google Scholar]
- Atchley WR, Zhu J. Developmental quantitative genetics, conditional epigenetic variability and growth in mice. Genetics. 1997;147:765–776. doi: 10.1093/genetics/147.2.765. [DOI] [PMC free article] [PubMed] [Google Scholar]
- Barham G, Clarke N. Genetic regulation of embryological limb development with relation to congenital limb deformity in humans. J Child Orthop. 2008;2:1–9. doi: 10.1007/s11832-008-0076-2. [DOI] [PMC free article] [PubMed] [Google Scholar]
- Brakefield PM. The power of evo-devo to explore evolutionary constraints: experiments with butterfly eyespots. Zool. 2003;106:283–290. doi: 10.1078/0944-2006-00124. [DOI] [PubMed] [Google Scholar]
- Breur G, VanEnkevort B, Farnum C, Wilsman N. Linear relationship between the volume of hypertrophic chondrocytes and the rate of longitudinal bone growth in growth plates. J Orthop Res. 1991;9:348–359. doi: 10.1002/jor.1100090306. [DOI] [PubMed] [Google Scholar]
- Butterfield NC, McGlinn E, Wicking C. The molecular regulation of vertebrate limb patterning. Curr Top Dev Biol. 2010;90:319–41. doi: 10.1016/S0070-2153(10)90009-4. [DOI] [PubMed] [Google Scholar]
- Carroll SB, Grenier JK, Weatherbee SD. From DNA to Diversity: Molecular Genetics and the Evolution of Animal Design. Blackwell Scientific; Malden, Mass: 2001. [Google Scholar]
- Carroll SB. Evo-devo and an expanding evolutionary synthesis: A genetic theory of morphological evolution. Cell. 2008;134:25–36. doi: 10.1016/j.cell.2008.06.030. [DOI] [PubMed] [Google Scholar]
- Cheverud JM, Rutledge J, Atchley W. Quantiative genetics of development: genetic correlations among age-specific trait values and the evolution of ontogeny. Evolution. 1983;37:895–907. doi: 10.1111/j.1558-5646.1983.tb05619.x. [DOI] [PubMed] [Google Scholar]
- Cheverud J, Routman E, Duarte F, van Swinderen B, Cothran K, Perel C. Quantitative Trait Loci for Murine Growth. Genetics. 1996;142:1305–1319. doi: 10.1093/genetics/142.4.1305. [DOI] [PMC free article] [PubMed] [Google Scholar]
- Cooper WJ, Albertson RC. Quantification and variation in experimental studies of morphogenesis. Dev Biol. 2008;321:295–302. doi: 10.1016/j.ydbio.2008.06.025. [DOI] [PubMed] [Google Scholar]
- Crawford DL, Oleksiak MF. The biological importance of measuring individual variation. J Exp Zool. 2007;210:1613–1621. doi: 10.1242/jeb.005454. [DOI] [PubMed] [Google Scholar]
- Cretekos CJ, Wang Y, Green ED, Martin JF, Rasweiler JJ, 4th, Behringer RR. Regulatory divergence modifies limb length between mammals. Genes Dev. 2008;15:141–51. doi: 10.1101/gad.1620408. [DOI] [PMC free article] [PubMed] [Google Scholar]
- Digby KH. The measurement of diaphyseal growth in proximal and distal directions. J Anat Physiol. 1916;50:187–188. [PMC free article] [PubMed] [Google Scholar]
- Dingerkus G, Uhler L. Enzyme clearing of alcian blue stained whole small vertebrates for demonstration of cartilage. Stain Technol. 1977;52:229–232. doi: 10.3109/10520297709116780. [DOI] [PubMed] [Google Scholar]
- Falconer DS, Gauld I, Roberts R. Cell sizes and cell numbers in organs of mice selected for large and small body size. Genetical Reseach. 1978;31:387–301. doi: 10.1017/s0016672300018061. [DOI] [PubMed] [Google Scholar]
- Farnum CE. Postnatal growth of fins and limbs through endochondral ossification. In: Hall BK, editor. Fins into Limbs. University Of Chicago Press; Chicago IL: 2007. [Google Scholar]
- Farnum CE, Tinsley M, Hermanson JW. Postnatal bone elongation of the manus versus pes: analysis of the chondrocytic differentiation cascade in Mus musculus and Eptesicus fuscus. Cells Tissues Organs. 2008;187:48–58. doi: 10.1159/000109963. [DOI] [PubMed] [Google Scholar]
- Farnum CE, Tinsley M, Hermanson JW. Forelimb versus hindlimb skeletal development in the big brown bat, Eptesicus fuscus: functional divergence is reflected in chondrocytic performance in Autopodial growth plates. Cells Tissues Organs. 2008;187:35–47. doi: 10.1159/000109962. [DOI] [PubMed] [Google Scholar]
- Gibson G, Weir B. The quantitative genetics of transcription. Trends Genet. 2005;21:616–623. doi: 10.1016/j.tig.2005.08.010. [DOI] [PubMed] [Google Scholar]
- Goodale H. Progress report on possibilities in progeny test breeding. Science. 1941;94:442–443. doi: 10.1126/science.94.2445.442. [DOI] [PubMed] [Google Scholar]
- Hall B, Miyake T. All for one and one for all: condensations and the initiation of skeletal development. Bioessays. 2000;22:138–147. doi: 10.1002/(SICI)1521-1878(200002)22:2<138::AID-BIES5>3.0.CO;2-4. [DOI] [PubMed] [Google Scholar]
- Hall BK. Unlocking the black box between genotype and phenotype: cell condensations as morphogenetic (modular) units. Biology and Philosophy. 2003;18:219–247. [Google Scholar]
- Hall B. Bones and Cartilage: Developmental and Evolutionary Skeletal Biology. New York, NY, USA: Elsevier Academic Press; 2005. Form, Polarity, and Long-Bone Growth; pp. 395–408. [Google Scholar]
- Hallgrimsson B, Willmore K, Hall BK. Canalization, developmental stability, and morphological integration in primate limbs. Yearb Phys Anthropol. 2002;119(S35):131–158. doi: 10.1002/ajpa.10182. [DOI] [PMC free article] [PubMed] [Google Scholar]
- Hockman D, Cretekos CJ, Mason MK, Behringer RR, Jacobs DS, Illing N. A second wave of Sonic hedgehog expression during the development of the bat limb. PNAS. 2008;105:16982–7. doi: 10.1073/pnas.0805308105. [DOI] [PMC free article] [PubMed] [Google Scholar]
- Hockman D, Mason MK, Jacobs DS, Illing N. The role of early development in mammalian limb diversification: a descriptive comparison of early limb development between the Natal long-fingered bat (Miniopterus natalensis) and the mouse (Mus musculus) Dev Dyn. 2009;238:965–79. doi: 10.1002/dvdy.21896. [DOI] [PubMed] [Google Scholar]
- Hrbek T, de Brito R, Wang B, Pletscher L, Cheverud J. Genetic characterization of a new set of recombinant inbred lines (LGXSM) formed from the intercross of SM/J and LG/J inbred mouse strains. Mamm Genome. 2006;17:417–429. doi: 10.1007/s00335-005-0038-7. [DOI] [PubMed] [Google Scholar]
- Hunziker E, Schenk R. Physiological mechanisms adopted by chondrocytes in regulating longitudinal bone growth in rats. J Physiol. 1989;414:55–71. doi: 10.1113/jphysiol.1989.sp017676. [DOI] [PMC free article] [PubMed] [Google Scholar]
- Huxley JS. Lincoln Mac Veagh. The Dial Press; New York: 1932. Problems of relative growth. [Google Scholar]
- Kenney-Hunt JP, Vaughn TT, Pletscher LS, Peripato A, Routman E, Cothran K, Durand D, Norgard E, Perel C, Cheverud JM. Quantitative trait loci for body size components in mice. Mamalian Genome. 2006;17:526–537. doi: 10.1007/s00335-005-0160-6. [DOI] [PubMed] [Google Scholar]
- Kenney-Hunt J, Wang B, Norgard E, Fawcett G, Falk D, Pletscher L, Jarvis J, Roseman C, Wolf J, Cheverud J. Pleiotropic patterns of quantitative trait loci for 70 murine skeletal traits. Genetics. 2008;178:2275–2288. doi: 10.1534/genetics.107.084434. [DOI] [PMC free article] [PubMed] [Google Scholar]
- Klingenberg C, Leamy L, Cheverud J. Integration and modularity of quantitative trait locus effects on geometric shape in the mouse mandible. Genetics. 2004;166:1909–1921. doi: 10.1534/genetics.166.4.1909. [DOI] [PMC free article] [PubMed] [Google Scholar]
- Kramer MG, Vaughn TT, Pletscher LS, King-Ellison K, Adams E, Erikson C, Cheverud JM. Genetic variation in body weight gain and composition in the intercross of Large (LG/J) and Small (SM/J) inbred strains of mice. Genetics and Molecular Biology. 1998;21:211–218. [Google Scholar]
- Kronenberg H. Developmental regulation of the growth plate. Nature. 2003;423:332–336. doi: 10.1038/nature01657. [DOI] [PubMed] [Google Scholar]
- Leamy L, Routman E, Cheverud J. Quantitative trait loci for fluctuating asymmetry of discrete skeletal characters in mice. Heredity. 1998;80:509–518. doi: 10.1046/j.1365-2540.1998.00320.x. [DOI] [PubMed] [Google Scholar]
- Leamy LJ, Pomp D, Eisen EJ, Cheverud JM. Pleiotropy of quantitative trait loci for organ weights and limb bone lengths in mice. Physiological Genomics. 2002;10:21–29. doi: 10.1152/physiolgenomics.00018.2002. [DOI] [PubMed] [Google Scholar]
- MacArthur J. Genetics of body size and related characters. I. Selection of small and large races of the laboratory mouse. Am Nat. 1944;78:142–157. [Google Scholar]
- Moczek AP. The origin and diversification of complex traits through micro- and macro-evolution of development: Insights from horned beetles. Curr Top Dev Biol. 2009;86:135–162. doi: 10.1016/S0070-2153(09)01006-0. [DOI] [PubMed] [Google Scholar]
- Norgard E, Jarvis J, Roseman C, Maxwell T, Kenney-Hunt J, Samocha K, Pletscher L, Wang B, Fawcett G, Leatherwood C, Wolf J, Cheverud J. Replication of long-bone length QTL in the F9-F10 LG, SM advanced intercross. Mamm Genome. 2009;20:224–235. doi: 10.1007/s00335-009-9174-9. [DOI] [PMC free article] [PubMed] [Google Scholar]
- Norgard E, Roseman C, Fawcett G, Pavlicev M, Morgan C, Pletscher L, Wang B, Cheverud J. Identification of quantitative trait loci affecting murine long bone length in a two-generation intercross of LG/J and SM/J Mice. J Bone and Miner Res. 2008;223:887–895. doi: 10.1359/JBMR.080210. [DOI] [PMC free article] [PubMed] [Google Scholar]
- Oleksiak MF, Roach JA, Crawford DL. Natural variation in cardiac metabolism and gene expression in Fundulus heteroclitus. Nat Genet. 2005;37:67–72. doi: 10.1038/ng1483. [DOI] [PMC free article] [PubMed] [Google Scholar]
- Oleksiak MF, Churchill A, Crawford DL. Variation in gene expression within and among natural populations. Nat Genet. 2002;32:261–265. doi: 10.1038/ng983. [DOI] [PubMed] [Google Scholar]
- Pavlicev M, Kenney-Hunt JP, Norgard EA, Roseman CC, Wolf JB, Cheverud JM. Genetic variation in pleiotropy: Differential epistasis as a source of variation in the allometric relationship between long bone lengths and body weight. Evolution. 2008;62:199–213. doi: 10.1111/j.1558-5646.2007.00255.x. [DOI] [PubMed] [Google Scholar]
- Pavlicev M, Cheverud JM, Wagner GP. Evolution of adaptive phenotypic variation patterns by direct selection for evolvability. 2010. unpublished manuscript. [DOI] [PMC free article] [PubMed] [Google Scholar]
- Payton CG. The growth in length of the long bones in the madder-fed pig. J Anat. 1932;66:414–425. [PMC free article] [PubMed] [Google Scholar]
- Peripato A, Cheverud J. Genetic influences on maternal care. Am Nat. 2002;160:S173–185. doi: 10.1086/342900. [DOI] [PubMed] [Google Scholar]
- Peripato A, de Brito R, Vaughn T, Pletscher L, Matioli S, Cheverud J. Quantitative Trait Loci for Maternal Performance for Offspring Survival in Mice. Genetics. 2002;162:1341–1353. doi: 10.1093/genetics/162.3.1341. [DOI] [PMC free article] [PubMed] [Google Scholar]
- Rasband WS. ImageJ. U. S. National Institutes of Health; Bethesda, Maryland, USA: 1997. http://rsb.info.nih.gov/ij/ [Google Scholar]
- Ray R, Capecchi M. An examination of the Chiropteran HoxD locus from an evolutionary perspective. Evol Dev. 2008;10:657–70. doi: 10.1111/j.1525-142X.2008.00279.x. [DOI] [PubMed] [Google Scholar]
- Riska B, Atchley W, Rutledge J. A genetic analysis of target growth in mice. Genetics. 1984;107:79–101. doi: 10.1093/genetics/107.1.79. [DOI] [PMC free article] [PubMed] [Google Scholar]
- Rolian C. Developmental basis of limb length in rodents: evidence for multiple divisions of labor in mechanisms of endochondral bone growth. Evol Dev. 2008;10:15–28. doi: 10.1111/j.1525-142X.2008.00211.x. [DOI] [PubMed] [Google Scholar]
- Rolian C, Lieberman D, Hamill J, Scott J, Werbel W. Walking, running and the evolution of short toes in humans. J Exp Biol. 2009;215:713–721. doi: 10.1242/jeb.019885. [DOI] [PubMed] [Google Scholar]
- Rolian CM. Integration and evolvability in primate hands and feet. Evol Biol. 2009;36:100–117. [Google Scholar]
- Schmidt M, Fischer MS. Morphological integration in mammalian limb proportions: dissociation between function and development. Evolution. 2009;63:749–766. doi: 10.1111/j.1558-5646.2008.00583.x. [DOI] [PubMed] [Google Scholar]
- Sears KE, Behringer RR, Rasweiler JJ, Niswander LA. The development of bat flight: Morphologic and molecular evolution of bat forelimb digit. PNAS. 2006;103:6581–6586. doi: 10.1073/pnas.0509716103. [DOI] [PMC free article] [PubMed] [Google Scholar]
- Sears KE. Differences in the timing of prechrondrogenic limb development in mammals: The marsupial-placental dichotomy resolved. Evolution. 2009;63:2193–2200. doi: 10.1111/j.1558-5646.2009.00690.x. [DOI] [PubMed] [Google Scholar]
- Simpson GG. Principles of Animal Taxonomy. Columbia University Press; New York, NY: 1961. [DOI] [PubMed] [Google Scholar]
- Stokes I, Mente P, Iatridis J, Farnum C, Aronsson D. Enlargement of growth plate chondrocytes modulated by sustained mechanical loading. J Bone Joint Surg Am. 2002;84-A:1842–1848. doi: 10.2106/00004623-200210000-00016. [DOI] [PubMed] [Google Scholar]
- Stathopoulos A, Levine M. Genomic regulatory networks and animal development. Dev Cell. 2005;9:449–462. doi: 10.1016/j.devcel.2005.09.005. [DOI] [PubMed] [Google Scholar]
- Vaughn T, Pletscher L, Peripato A, King-Ellison K, Adams E, Erikson C, Cheverud J. Mapping quantitative trait loci for murine growth: a closer look at genetic architecture. Genet Res. 1999;74:313–322. doi: 10.1017/s0016672399004103. [DOI] [PubMed] [Google Scholar]
- Wagner GP, Pavlicev M, Cheverud JM. The road to modularity. Nat Rev Genet. 2007;8:921–931. doi: 10.1038/nrg2267. [DOI] [PubMed] [Google Scholar]
- Wagner GP, Lynch VJ. Evolutionary novelties. Curr Biol. 2010;20:R48–R52. doi: 10.1016/j.cub.2009.11.010. [DOI] [PubMed] [Google Scholar]
- Wilsman N, Farnum C, Leiferman E, Fry M, Barreto C. Differential growth by growth plates as a function of multiple parameters of chondrocytic kinetics. J Orthop Res. 1996a;14:927–936. doi: 10.1002/jor.1100140613. [DOI] [PubMed] [Google Scholar]
- Wilsman N, Farnum C, Green E, Leiferman E, Clayton M. Cell cycle analysis of proliferative zone chondrocytes in growth plates elongating at different rates. J Orthop Res. 1996b;14:562–572. doi: 10.1002/jor.1100140410. [DOI] [PubMed] [Google Scholar]
- Wilsman N, Bernardini E, Leiferman E, Noonan K, Farnum C. Age and Pattern of the Onset of Differential Growth among Growth Plates in Rats. J Orthop Res. 2008;26:1457–1465. doi: 10.1002/jor.20547. [DOI] [PMC free article] [PubMed] [Google Scholar]
- Whitfield J. Biological theory: Postmodern evolution? Nature. 2008;455:281–284. doi: 10.1038/455281a. [DOI] [PubMed] [Google Scholar]
- Wolf J, Vaughn T, Pletscher L, Cheverud J. Contribution of maternal effect QTL to the genetic architecture of early growth in mice. Heredity. 2002;89:300–310. doi: 10.1038/sj.hdy.6800140. [DOI] [PubMed] [Google Scholar]
- Yang Y. Growth and patterning in the limb: signaling gradients make the decision. Sci Signal. 2009;2:pe3. doi: 10.1126/scisignal.253pe3. [DOI] [PubMed] [Google Scholar]
- Young NM, Hallgrimsson B. Serial homology and the evolution of mammalian limb covariation structure. Evolution. 2005;59:2691–2704. [PubMed] [Google Scholar]
- Yucel G, Small S. Morphogens: Precise outputs from a variable gradient. Curr Biol. 2006;16:R29–31. doi: 10.1016/j.cub.2005.12.005. [DOI] [PubMed] [Google Scholar]
Associated Data
This section collects any data citations, data availability statements, or supplementary materials included in this article.