Abstract
This study was performed to quantify the fraction of excreted creatinine not attributable to creatinine filtration for accurately determining the glomerular filtration rate in mice. To measure this we compared creatinine filtration with the simultaneous measurement of inulin clearance using both single-bolus fluorescein isothiocyanate (FITC)-inulin elimination kinetics and standard FITC-inulin infusion. During anesthesia, creatinine filtration was found to be systematically higher than inulin clearance in both male and female C57BL/6J mice. The secretion fraction was significantly less in female mice. Administration of either cimetidine or para-aminohippuric acid, competitors of organic cation and anion transport respectively, significantly reduced the secretion fraction in male and female mice and both significantly increased the plasma creatinine level. Creatinine secretion in both genders was not mediated by the organic cation transporters OCT1 or OCT 2 since secretion fraction levels were identical in FVB wild-type and OCT1/2 knockout mice. Thus, secretion accounts for about 50 and 35% of excreted creatinine in male and female mice, respectively. Increasing plasma creatinine threefold by infusion further increased the secretion fraction. Renal organic anion transporter 1 mRNA expression was higher in male than in female mice, reflecting the gender difference in creatinine secretion. Hence we show that there is a major secretory contribution to creatinine excretion mediated through the organic anion transport system. This feature adds to problems associated with measuring endogenous creatinine filtration in mice.
Keywords: creatinine clearance, drug transporter, gender difference, glomerular filtration rate, ion transport
Endogenous creatinine clearance (Ccr), usually by 24-h urine collection and a single plasma determination, is a practical way to measure glomerular filtration rate (GFR) and it is therefore widely used to assess this important indicator of renal function. The option of genetic manipulation in mice and the need of phenotypic evaluation of ‘new’ animal models have led to an increased use of the Ccr in this species for measurement of GFR. Nevertheless, there are well-recognized problems associated with the use of this technique necessitating careful validation for the intended use. Creatinine secretion is one of the known complications of this technique, as it causes overestimation of the real GFR to various extent.1 Because it suppresses creatinine secretion, cimetidine has been used successfully to increase the accuracy of GFR estimation.2–4 The contribution of secretion to the excretion of creatinine has not been systematically studied in mice. Furthermore, previous evidence suggesting gender differences in creatinine secretion raises the question whether sex is a determinant of Ccr in mice.
The present experiments were performed to establish the magnitude of the secretory creatinine component in two widely used mouse strains (C57BL6/J and FVB), and to investigate which organic transport system mediates creatinine secretion. Our data indicate that creatinine secretion contributes significantly to urinary creatinine excretion, and that the secretory component can be reduced by para-aminohippuric acid (PAH) and cimetidine, competitive inhibitors of organic anion and cation transporters, respectively. In view of earlier evidence with expressed organic cation transporters (OCTs), it was unexpected that absence of the organic cation transporters OCT1 and OCT2 did not affect creatinine secretion. As the renal expression of OCT3 is extremely low, our results suggest a major role for organic anion transporter (OAT)-mediated transport despite the fact that creatinine at physiological pH is a base. OAT1-mediated creatinine uptake could explain the higher rates of creatinine secretion in male than female mice, as OAT1 is expressed in the kidney with male preponderance.
RESULTS
FITC-inulin plasma decay versus Ccr
Fluorescein isothiocyanate (FITC)-inulin clearance (Cin) of C57BL/6J wild-type (WT) male mice derived from plasma decay after bolus injection averaged 248±29 μl/min, a value significantly lower than the simultaneously measured endogenous Ccr of 370±32 μl/min (P<0.05; n = 11). The secreted fraction of creatinine estimated from the Ccr versus Cin averaged 0.32±0.06.
FITC-inulin steady-state infusion clearance versus endogenous Ccr
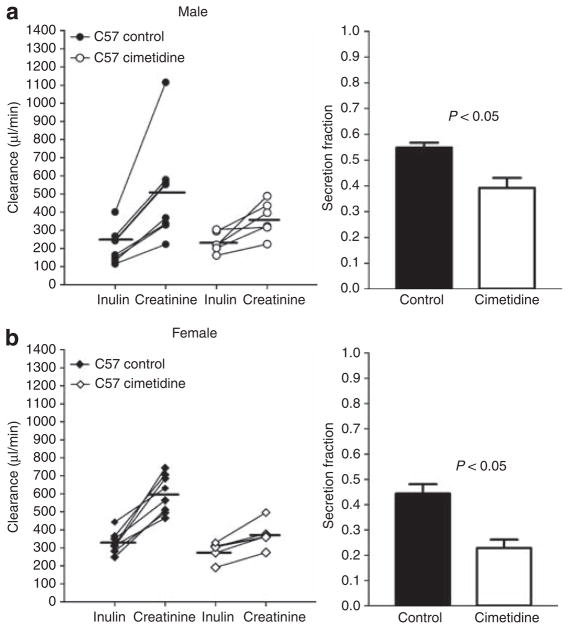
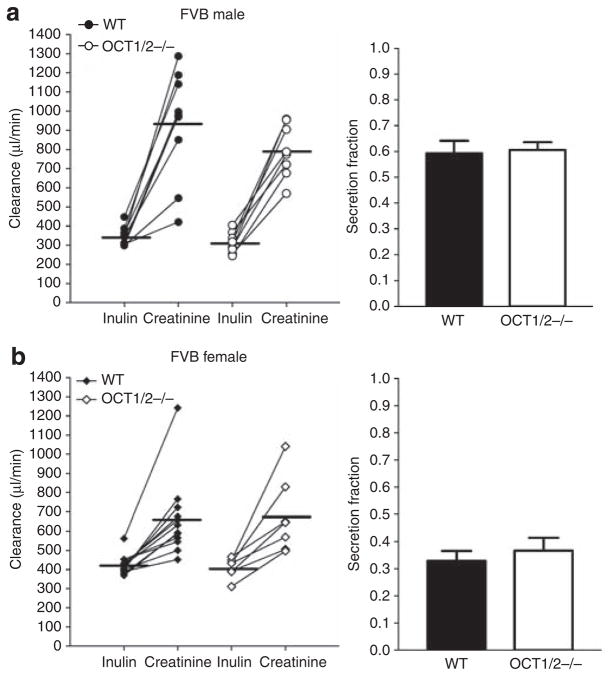
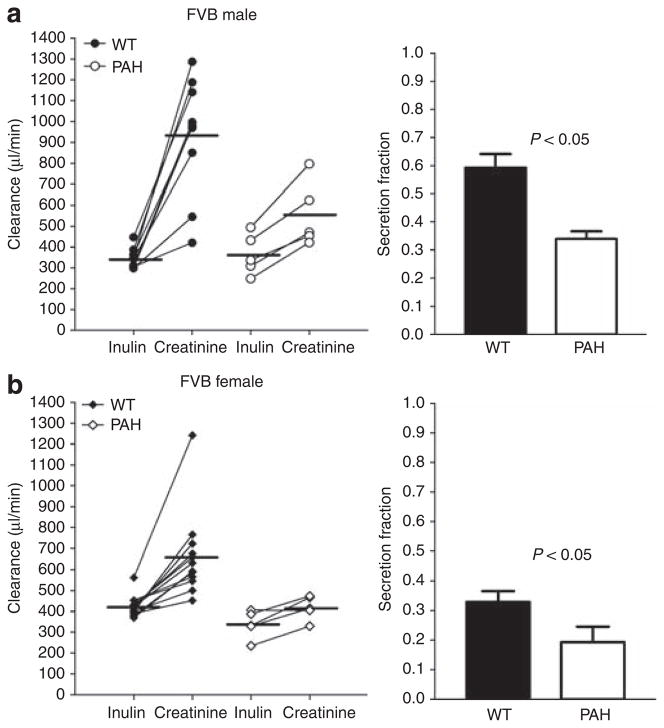
Simultaneous measurements of creatinine and steady-state FITC-Cin are summarized in Figures 1–3. In male C57BL/6J mice (Figure 1), Ccr averaged 508±98 μl/min compared with a Cin of 215±34 μl/min (n = 8; P<0.05) yielding a secretion fraction (SFcr) of 0.56±0.02. In female mice, Ccr was 601±38 μl/min, and Cin was 328±21 μl/min (n = 8; P<0.05). The SFcr was 0.44±0.04, significantly lower than those observed in the male mice (n = 8; P<0.05). Likewise in FVB WT mice (Figures 2 and 3), Ccr exceeded Cin in both male (758±76 vs 345±16 μl/min; n = 9; P<0.05) and female mice (657±55 vs 424±15 μl/min; n = 12; P<0.05), leading to a significantly higher SFcr in male than female mice (0.59±0.05 vs 0.33±0.04; P<0.05).
Figure 1. Inulin and creatinine clearances in male and female C57BL/6J mice: effect of cimetidine.
Left: Comparison between the clearances of inulin and creatinine in male (a; n = 8) and female (b; n = 8) C57BL/6J mice without (closed symbols) and with cimetidine-treatment (open symbols). Lines connect simultaneous clearance measurements from individual animals; horizontal bars indicate mean values. Right: Secretion fractions calculated from the difference between creatinine and inulin clearances as indicated in Materials and Methods section.
Figure 3. Comparison between the clearances of inulin and creatinine in FVB wild-type and Oct1/2 −/− mice.
(a) Inulin and creatinine clearances in male WT (closed symbols; n = 9) and OCT1/2 −/− mice (open symbols; n = 8) and calculated secretion fractions (bars on the right). (b) Inulin and creatinine clearances in female WT (closed symbols; n = 12) and OCT1/2 −/− mice (open symbols; n = 7) and calculated secretion fractions (bars on the right). Lines connect simultaneous clearance measurements from individual animals and horizontal bars are mean values.
Figure 2. Measurements of the clearances of inulin (Cin) and creatinine (Ccr) in FVB wild-type mice without (closed symbols) and during PAH administration (open symbols).
(a) Male mice under control conditions (n = 9) and during PAH administration (n = 5) and calculated SFcr (bars on the right). (b) Female mice without treatment (n = 12) and with PAH treatment (n = 5) and calculated SFcr (bars on the right). Lines connect simultaneous clearance measurements from individual animals and horizontal bars are mean values.
Effect of PAH
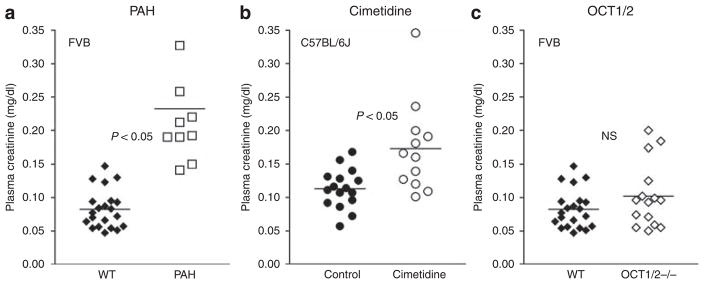
Para-aminohippuric acid was used to determine whether the OAT system participates in the secretion of creatinine. There were no differences in age, body weight (BW), kidney weight, mean arterial blood pressure (MAP), and heart rate between FVB mice before or during PAH administration, but urine flow increased during PAH infusion (Table 1). While Ccr remained higher than Cin, the clearance difference was reduced in both male FVB WT mice (Ccr: 553±70 μl/min, Cin: 364±44 μl/min; n = 5; P<0.05) and female FVB WT mice (Ccr: 418±26 μl/min, Cin: 338±30 μl/min; n = 5; P<0.05; see Figure 1). Calculated SFcr was significantly reduced by PAH from 0.59 to 0.34±0.03 (P<0.05) in male mice, and from 0.33 to 0.19±0.05 (P<0.05) in female mice. The reduction of creatinine secretion was accompanied by a significant increase in plasma creatinine concentration in PAH-treated mice (Figure 4a) from 0.083±0.006 (n = 21) to 0.232±0.029 mg/dl (n = 10; P<0.05) at time point P1 (~45 min after treatment started).
Table 1.
Summary of age, weight, blood pressure, and heart rate in control and cimetidine-treated C57BL/6J mice, and in FVB WT, FVB WT PAH-treated, and OCT1/2 −/− mice
| C57BL/6J | +Cimetidine | FVB WT | +PAH | OCT1/2 −/− | |
|---|---|---|---|---|---|
| N | 16 | 12 | 21 | 10 | 15 |
| Age (months) | 4.0±0.2 | 5.2±0.5 | 3.7±0.1 | 6.3±0.7 | 2.3±0.0 |
| Body weight (g) | 25.8±0.6 | 25.3±1.0 | 26.5±0.9 | 27.5±1.6 | 23.1±0.7 |
| Kidney weight (g) | 0.29±0.01 | 0.28±0.02 | 0.33±0.02 | 0.35±0.03 | 0.29±0.02 |
| Urine flow (ml/min) | 1.32±0.16 | 1.55±0.14 | 1.59±0.15 | 11.0±1.44 | 1.6±0.20 |
| MAP (mm Hg) | 74±2 | 71±3 | 96±3 | 90±4 | 83±3 |
| Heart rate (b.p.m.) | 490±26 | 473±36 | 406±10 | 423±7 | 402±12 |
Abbreviations: FITC, fluorescein isothiocyanate; MAP, mean arterial blood pressure; OCT, organic cation transporter; PAH, para-aminohippuric acid; WT, wild-type. MAP and heart rate were obtained following surgical preparation but before starting FITC-inulin infusion.
Figure 4. Effects of PAH, cimetidine, and genetic deletion of OCT1 and OCT2 on plasma creatinine concentration of FVB mice.
(a) Plasma creatinine concentrations in FVB wild-type mice without (closed symbols; n = 21) and with PAH treatment (open symbols; n = 10); horizontal bars indicate mean values. (b) Plasma creatinine concentrations in C57BL/J wild-type mice (closed symbols; n = 16) before (control) and during treatment with cimetidine; horizontal bars indicate mean values. (c) Plasma creatinine concentrations in FVB wild-type mice (closed symbols; n = 21) and in OCT1/2 −/− (open symbols; n = 15); horizontal bars indicate mean values.
Effect of cimetidine
To determine whether the secretion of creatinine is mediated by the organic cation transport system, we compared Ccr and Cin during intravenous application of the histamine 2-receptor antagonist cimetidine in male and female C57BL/6J mice. Age, BW, kidney weight, MAP, and heart rate were comparable in C57BL/6J mice without or with cimetidine treatment (Table 1). Our results show that Ccr remained higher than Cin, but that the clearance difference was significantly reduced in both male mice (Ccr: 364±39 μl/min, Cin: 234±23 μl/min; n = 6; P<0.05) and female mice (Ccr: 373±29 μl/min, Cin: 286±20 μl/min; n = 6; P<0.05; see Figure 1). Cimetidine reduced the SFcr in male mice from 0.56 to 0.34±0.07 (P<0.05) and in female mice from 0.44 to 0.23±0.03 (P<0.05). Plasma creatinine concentration in mice after receiving cimetidine for ~45 min (time point P1) was 0.173±0.020 mg/dl (n = 12), significantly higher than the mean value of 0.113±0.007 mg/dl (n = 16) in control mice (P<0.05; Figure 4b).
Creatinine secretion in FVB WT and OCT1/2 −/− mice
In an attempt to assess the role of OCT1 and/or OCT2 in creatinine secretion, we compared Ccr and Cin in mice with a null mutation in OCT1 and OCT2 expression (Figure 4). OCT1/2 −/− mice were comparable with WT FVB mice in age, BW, kidney weight, MAP, and heart rate (Table 1). In male OCT1/2-deficient mice, Ccr averaged 793±49 μl/min, and this was significantly higher than the Cin of 312±20 μl/min (n = 8; P<0.05). Similarly, Ccr exceeded Cin in female OCT1/2 −/− mice (677±74 vs 411±20 μl/min; n = 7; P<0.05). SFcr was 0.60±0.03 in male mice and 0.37±0.05 in female mice, and these values were not significantly different from those obtained in FVB WT animals. Plasma creatinine concentrations were not different between OCT1/2 −/− and WT animals (OCT1/2 −/−: 0.102±0.013 mg/dl, n = 15; WT: 0.083±0.006 mg/dl, n = 21; Figure 5c).
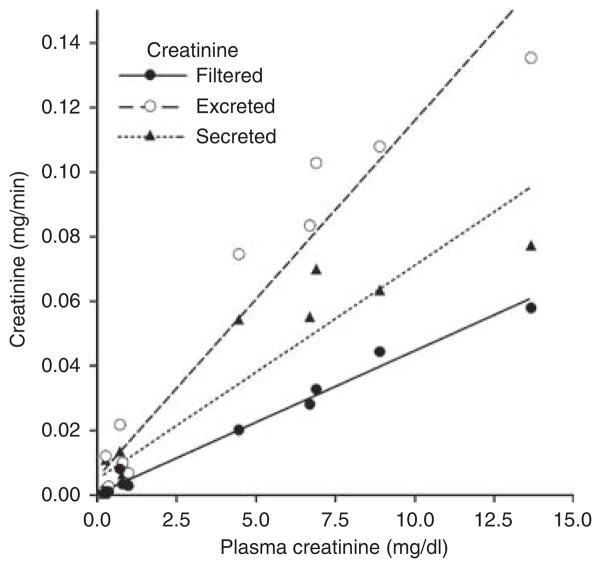
Figure 5. Relationship between plasma creatinine concentration and the filtered, excreted, and secreted amounts of creatinine in CD1 mice; plasma creatinine concentration was changed by infusion of creatinine at 5 μg/min (n = 5) and 50 μg/min (n = 5).
Lines represent linear regressions.
Exogenous Ccr
To determine creatinine secretory capacity, we measured FITC-inulin and Ccr in male CD1 mice after elevating plasma creatinine by infusion over a concentration range that might result from a decline of renal function. The results are summarized in Figure 5. It can be seen that increasing plasma creatinine from 0.265±0.03 mg/dl over 0.69±0.15 mg/dl to 8.1±1.55 mg/dl was followed by a linear increase in filtered creatinine (FITC-inulin × Pcr) as expected. Secreted creatinine (excreted – filtered creatinine) also increased markedly in a way best described by a linear regression line, although at the highest concentration a deviation from this line seems to become evident. Secreted creatinine as percent of excreted creatinine showed a value of 52.7±2.8% at a plasma concentration of 0.265 mg/dl and a value of 68.9±6.1% at a plasma concentration of 0.692 mg/dl (P = 0.054).
Organic ion transporter mRNA expression
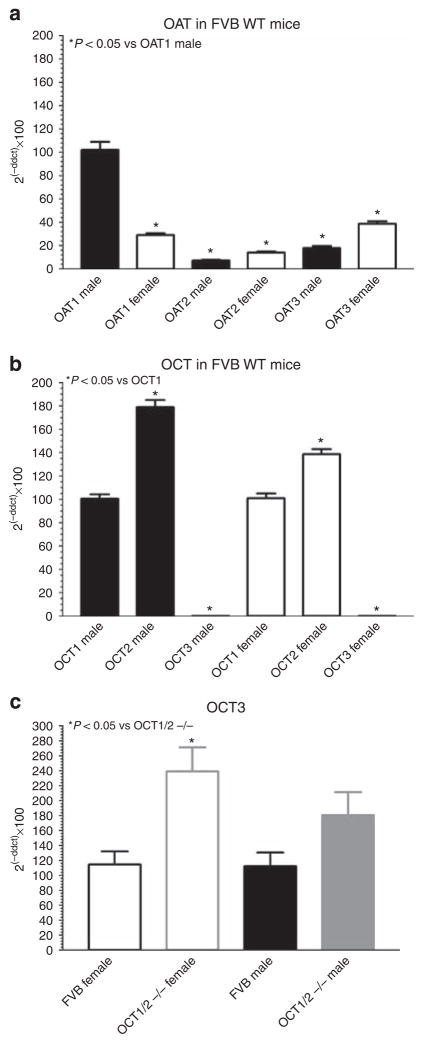
Expression levels of organic ion transporters were determined in FVB WT mice to identify gender differences similar to those seen in the functional studies. Of the three OATs tested (Figure 6a), only the renal expression of OAT1 was lower in female relative to male mice (29±2%; n = 12; P<0.05). In contrast, expression of both OAT2 and OAT3 was higher in female than in male mice.
Figure 6. Expression of organic anion (OAT) and organic cation (OCT) transporter mRNA in male and female FVB mice.
(a) OAT1, OAT2, and OAT3 mRNA quantification in male (closed bars; n = 9) and female FVB mice (open bars; n = 12); mRNA of OAT1 from male mice was used as reference point (100%). (b) OCT1, OCT2, and OCT3 mRNA quantification in male (closed bars; n = 9) and female FVB mice (open bars; n = 12); mRNA of OCT1 was set to 100%. (c) OCT3 mRNA quantification in FVB wild-type mice (female: black open bars, n = 12; male: black closed bar, n = 9) and OCT1/2 −/− mice (female: gray open bar, n = 7; male: gray closed bar, n = 8); mRNA of FVB wild-type mice was set to 100%.
We also determined OCT3 expression to assess whether this transporter may be upregulated in OCT1/2 −/− mice. Consistent with earlier observations OCT3 mRNA was found to be only minimally expressed in the kidney of WT mice in comparison with OCT1 and OCT2 (Figure 6b). Expression levels of OCT3 increased in the OCT1/2 −/− mice in both male and female animals (Figure 6c). Immunoblots with an antibody against OCT3 showed a relative expression (arbitrary densitometric units) of 0.91±0.14 in WT (n = 4) and of 1.29±0.09 in OCT1/2 −/− mice (n = 4; P = 0.07). Similarly, OAT1 protein expression was found to be comparable averaging in relative densitometric units 1.18±0.1 in WT and 1.31±0.27 in OCT1/2−/− mice (n = 4; not significant).
DISCUSSION
In this report, we used simultaneous determinations of Cin and endogenous Ccr in mice to quantify the fraction of excreted creatinine not attributable to filtration. The main finding is that the endogenous Ccr exceeds the Cin by a factor of approximately two, indicating that about half of creatinine excretion is derived from tubular secretion. The unusually large secretory component adds to the list of problems associated with the use of the endogenous Ccr in mice. The high creatinine secretion most likely contributes to the low plasma creatinine levels generally found in mice.
The validity of FITC-inulin as a marker for GFR in mice has been established previously by showing identity of simultaneously measured FITC-inulin and iothalamate clearances.5 As plasma values of creatinine are overestimated when using the Jaffe colorimetric method, all creatinine measurements in this study were performed by an high-performance liquid chromatography (HPLC) separation method. Endogenous Ccr determined by standard clearance methods over 1 h exceeded FITC-Cin, whether determined by single-injection plasma decay or urinary collection techniques. The range of values suggests that 30–60% of total Ccr is due to tubular secretion. Previous data have identified a sexual dimorphism in creatinine transport, as the Ccr/Cin ratio was observed to be higher in male than in female rats; administration of testosterone to female rats elevated this ratio to male values.6,7 In this study, we have confirmed a gender difference in both C57BL/6J and FVB mouse strains, as the difference between Ccr and Cin was consistently higher in male than in female mice. The secreted fraction of creatinine of male mice increased further (from about 53–69%) when plasma creatinine was increased by infusion about threefold. A greater contribution of secretion to excretion is typically noticed under clinical conditions when plasma creatinine increases as a result of a decrease of GFR. Enhanced creatinine secretion at moderate GFR reductions delays the increase of plasma creatinine levels and adds to the imprecision of using plasma creatinine as an index of GFR. Further elevations of plasma creatinine in our studies were associated with reduced SFcrs, although clear transport saturation and attainment of a transport maximum was not achieved.
There have been no previous reports of a similarly high creatinine secretion in mice. Nevertheless, examination of earlier reports suggests partial agreement with the present findings. In female rats, a comparison between 3H-Cin and endogenous Ccr has revealed a secretory fraction of 0.57.8 A SFcr of 0.25 has been found in mice during infusion of both inulin and creatinine, an approach in which the elevated creatinine levels may have saturated creatinine secretion; as a consequence, the relative contribution of secretion to total clearance may have decreased.9 Studies using the colorimetric Jaffe reaction for plasma measurements are probably invalid as they would systematically overestimate plasma creatinine and therefore underestimate Ccr.10,11 In a direct comparison in conscious C57BL/6J mice, 24 h clearances of endogenous creatinine and FITC-inulin administered through implanted osmotic pumps showed a good correlation, but Ccr was markedly higher than Cin.10 From these data, a secretory fraction of about 0.6–0.7 can be estimated assuming that an incomplete urine collection would affect recovery of inulin and creatinine to a comparable extent. In contrast, a negligible tubular SFcr of only 0.06 was recently observed in another study in male C57Bl/6J mice, in which 24 h clearances of creatinine and FITC-inulin were compared.12 The reason for this is unclear, but the drastic differences between similar studies point to unrecognized problems in the application of 24 h clearances to mice.10,12 Although the approach used in our study requires anesthesia and surgery, direct urine collections from the bladder bracketed by plasma determinations provide reliable clearance estimates for the selected experimental conditions. Differences in results are probably not related to the use of different mouse strains, as in our study similarly high SFcrs were observed in C57BL/6J, FVB, and CD1 strains.
Subsequent in vivo studies were performed to identify the basolateral transport system responsible for creatinine uptake. As creatinine with pKa’s of 4.8 and 9.2 is a mono-protonated cation at physiological pH, it was expected that uptake occurred mainly through the organic cation transport system. Consistent with this expectation is the finding that the calculated creatinine SFcr was markedly reduced by the administration of the histamine 2-receptor antagonist cimetidine, a high affinity substrate of OCT transporters. Consistent with previous observations in humans, cimetidine did not alter the clearance of inulin indicating that it did not interfere with GFR and the filtered load of creatinine.2,3 Thus, the decrease in creatinine excretion caused by cimetidine was most certainly due to a reduction of creatinine secretion.13 Competitive inhibition of cimetidine transport by creatinine and vice versa has been demonstrated previously.14,15 Cimetidine and creatinine have been shown to be selective substrates for the OCT2 stably expressed in HEK 293 cells.16,17 Our data show that cimetidine reduced the secretory fraction of creatinine by about 40% in males and 49% in females. As a consequence of reduced secretion, plasma creatinine concentration was found to be significantly increased about 45 min after starting the cimetidine treatment. One can estimate that with complete cessation of creatinine secretion and distribution of the added creatinine in the extracellular space, plasma creatinine would reach 0.34±0.04 mg/dl by 45 min. As the actual plasma concentration in the cimetidine-treated mice was found to be about 50% lower, the increase of plasma creatinine is consistent with a reduction of creatinine secretion by about half.
Despite the evidence supporting a role of OCTs in creatinine secretion, mice with deletion of both OCT1 and OCT2 did not show detectable differences in creatinine secretion compared with WT mice. Thus, neither OCT1 nor OCT2 appear to be responsible for creatinine uptake into the proximal tubule in vivo. This is consistent with absence of measurable differences in plasma creatinine between OCT1/2 −/− and control mice. OCT1 and OCT2 have been shown to be the major cation transporters in the kidney, while OCT3 has comparatively low renal expression levels.18,19 Nevertheless, cimetidine has been found to interfere with organic cation uptake in Caki-1 cells, a cell line of human renal origin that expresses OCT3, but not OCT2.20 There was an upregulation of OCT3 in OCT1/OCT2-deficient mice, but expression levels remained extremely low, probably insufficient to explain normal rates of creatinine uptake in the absence of OCT1 and OCT2. Overall, our results imply that cimetidine may not inhibit creatinine uptake by competing for OCT1 or OCT2 binding.
Previous observations in guinea-pigs have shown that renal creatinine secretion is inhibited by the classical OAT inhibitor probenecid.21 As probenecid and creatinine had identical retention times in our HPLC system, we used the classical organic anion substrate PAH as competitive inhibitor of OATs. Our data show that the reduction of creatinine secretion caused by PAH was similar to that caused by cimetidine. The PAH-induced reduction of creatinine secretion was also accompanied by a significant increase of plasma creatinine. Studies in OAT1 −/− mice have demonstrated that PAH is almost exclusively transported by the OAT1.22 Thus, our data seem to support the notion that creatinine uptake in mice is for the most part mediated by OAT1. Indirect support for this is the higher expression of OAT1 in male than in female mice, a gender difference that parallels our finding of a higher creatinine secretion in males than in females.23 An implication of this conclusion would be that the charge of a substrate does not reliably predict the interaction with a specific transporter. In an extensive in vivo uptake study, Ullrich et al.24,25 have identified a large number of ‘bisubstrates’ that can interact with both the organic anion and organic cation transport systems. This work confirmed in a systematic way previous evidence showing that acidity or basicity are insufficient criteria for predicting specific substrate/transporter interactions.26,27 Of particular interest is the observation that the basolateral uptake of cimetidine is additively blocked by probenecid and tetraethylammonium, blockers of organic anion and cation transporters, respectively.15,24,28
In conclusion, Ccr in mice is about twice as high as the Cin indicating that about half of urinary creatinine excretion is derived from tubular secretion. A reduction of creatinine secretion was caused by both the organic cation cimetidine and the organic anion PAH. Genetic deletion of OCT1 and OCT2 did not affect creatinine secretion. Thus, at least in the absence of OCT-mediated transport the OAT system is mainly responsible for creatinine secretion.
MATERIALS AND METHODS
Animals
Experiments were performed in C57BL/6J mice from our own breeding colony. Mice homozygous for targeted disruption of the OCT genes Slc22a1 and Slc22a2 (OCT1/2−/−) and matched FVB WT mice were obtained from Taconic (Hudson, NY, USA). CD-1 WT mice were purchased from Charles River Laboratories (Wilmington, MA, USA). Animals were kept on standard rodent chow and tap water ad libitum. Animal care and experimentation were approved by the NIDDK Animal Care and Use Committee and carried out in accordance with National Institutes of Health principles as outlined in their Guide for the Care and Use of Laboratory Animals.
Materials
Fluorescein isothiocyanate-inulin, cimetidine, PAH, HEPES, and bovine serum albumin were purchased from Sigma-Aldrich (St Louis, MO, USA). The ~2.5% FITC-inulin solution was prepared as previously described29 and diluted before each experiment with bovine serum albumin 2.25% to a concentration of 0.5% FITC-inulin.
Animal preparation
Mice were injected with thiobutabarbital intraperitoneally (Inactin; 100 mg/kg BW) and ketamine subcutaneously (100 mg/kg BW), and placed on a servo-controlled operating table to maintain core body temperature at 38.0 °C. A tracheotomy was performed and a low flow of 100% oxygen was directed toward the tracheal tube for the whole duration of the experiment. Polyethylene catheters for infusions were inserted into the right jugular vein. Another catheter was inserted into the left femoral artery for continuous measurement of MAP. Urine was collected through an implanted bladder catheter. After the experiment, mice were killed and kidney weights were determined.
FITC-Cin by plasma decay kinetics
A bolus of around ~2.5% FITC-inulin (3.7 μl × g BW) was injected into the retro-orbital plexus of C57BL/6J WT male mice, and blood was collected at 3, 7, 10, 15, 35, 55, and 75 min after injection. Plasma fluorescence was measured as described below. To obtain the Cin, a two phase exponential decay curve was performed and the clearance was calculated using an FITC-inulin standard. Urine collections for Ccr were started 2 min after FITC-inulin injection and continued for 1 h. Ccr was calculated according to the U/P × V principle for the matching plasma and urine samples.
Steady-state FITC-Cin
C57BL/6J WT, FVB WT, and FVB OCT1/2 −/− mice were infused with 0.9% saline (10 μl/g/BW per h), and after the initial measurement of MAP an infusion of 0.5% FITC-inulin was started (0.25 μl/g/BW per min) at least 30 min before the first blood collection. Blood was drawn through the arterial catheter three times at 0 min (P1), 30 min (P2), and 60 min (P3) of the measurement period. In between the blood samples (P1–P2 = Period 1, P2–P3 = Period 2), urine was collected in 10 min intervals (U1 to U3 and U4 to U6) and weighed for volume determination. Cimetidine was administered as a 30 mg/kg BW bolus followed by a maintenance infusion at a rate of 10 mg/kg/BW per h.30 PAH was administered as a 100 mg/kg/BW bolus followed by a maintenance infusion at a rate of 1 mg/kg/BW per min.
To assess the effect of elevating plasma creatinine levels on creatinine secretion, exogenous creatinine (Sigma-Aldrich) was infused at a rate of 10 μl/min to deliver either 5 or 50 μg/min, and clearance measurements were started after 30 min according to the steady-state FITC-Cin protocol (see above). These studies were performed in CD1 mice to broaden the spectrum of mouse strains used in the study.
Fluorescein isothiocyanate-inulin in plasma and urine samples was measured after adding 500 mM HEPES buffer (pH 7.4) in a ND-3300 fluorospectrometer (NanoDrop Technologies, DE, USA). Plasma fluorescence in each urine collection interval was obtained by linear interpolation between bracketing values, and the Cin for each 10 min interval was calculated from urine fluorescence/plasma fluorescence × urine volume. Cin were averaged for periods 1 and 2 for statistical analysis.
Creatinine concentrations (ccr) in plasma and urine were determined by modifying established HPLC methods described previously,10,31 using an Agilent Technologies1100 series pump (Agilent Technologies, Santa Clara, CA, USA) and autosampler, and a 1200 series variable wavelength detector (wavelength 225 nm). Column dimensions were 50 × 2.1 mm, and 5 μm particle size strong cation exchange resin, Zorbax SCX (Agilent Technologies) was used. Column temperature was room temperature, and flow rate was set at 1 ml/min. The mobile phase consisted of 2 l of 5 mM sodium acetate adjusted to pH 4.2 with glacial acetic acid, 80 ml of methanol and 20 ml of acetonitrile (ACN) to make a total volume of 2.1 l. The solution was filtered through 0.22 μm durapore membrane filters (Millipore, Billerica, MA, USA). All reagents were HPLC grade or better. Creatinine was purchased from Sigma-Aldrich and standard solutions were made up in the mobile phase. For sample analysis, 24 μl of cold ACN that had been acidified with 1:200 (vol/vol) of glacial acetic acid was added to 6 μl of plasma/urine to precipitate proteins (1:4 ratio of ACN to plasma). Tubes were vortexed and kept at 4 °C for 15 min followed by centrifugation at 10,000 r.p.m. for 10 min in a refrigerated centrifuge. The supernatant was transferred to a new Eppendorf tube. The ACN and any aqueous phase were evaporated to dryness in a Speed-Vac (Thermo Savant, Holbrook, NY, USA). The residue containing the creatinine was resuspended in 42 μl of HPLC mobile phase and transferred to an autosampler vial. A volume of 30 μl of solution was used for HPLC analysis. The Waters Empower software (Milford, MA, USA) was used for signal collection and calculation of sample concentration.
Creatinine clearances were calculated from Ucr/Pcr × V and averaged for periods 1 and 2 and further used for statistical analysis. To quantify the secretory component of the Ccr, SFcr was calculated from
mRNA quantification
Total RNA was extracted using Trizol Reagent (Invitrogen, Carlsbad, CA, USA) from whole kidneys of FVB WT and FVB OCT1/2 −/− mice. Reverse transcription was performed using SuperScript II (Invitrogen). cDNA levels for OCT1, OCT2, OCT3, OAT1, OAT2, and OAT3 were determined by real-time PCR using the following primer and probe sets (Applied Biosystems, Foster City, CA, USA): Mm00456306_m1 (Oct1, Scl22a1), Mm00457295_m1 (Oct2, Slc22a2), Mm00488294_m1 (Oct3, Slc22a3), Mm00456258_m1 (Oat1, Slc22a6), Mm00460672_m1 (Oat2, Slc22a7), Mm00459534_m1 (Oat3, Slc22a8), and housekeeping gene Mm03024075_m1 (HPRT1, hypoxanthine guanine phosphoribosyl transferase). All primer pairs span an intron.
Immunoblotting
Kidneys were homogenized on ice in 500 μl of chilled 1 × lysis buffer (10 ×) no. 9803 (Cell Signaling Technology, Danvers, MA, USA) supplemented with 1 mM phenylmethylsulfonyl fluoride. Protein in the supernatant after centrifugation at 10,000 × g (30 min at 4 °C) was determined by BCA Protein Assay Reagents A no. 23223 and B no. 1859078 (Thermo Fisher Scientific, Waltham, MA, USA). Protein (150 μg per well) mixed with sample loading buffer was subjected to 10% SDS-polyacrylamide gel electrophoresis gel separation and transferred to a polyvinylidene difluoride membrane (Invitrogen) for immunoblotting. Nonspecific binding sites on the membrane were blocked with 5% defatted milk in phosphate-buffered saline (PBS)-T buffer (PBS with 0.1% Tween 20) at room temperature for 1 h, followed by two washes in PBS-T. The membranes were then incubated with rabbit anti-mouse OAT1 antibody (ABBIOTEC, LLC, CA, USA), goat anti-mouse OCT3 antibody (Santa Cruz Biotechnology, Santa Cruz, CA, USA) in PBS-T buffer containing 5% bovine serum albumin overnight at 4 °C. After five washes in PBS-T, the membranes were incubated with donkey anti-rabbit horseradish peroxidase immunoglobulin-G (Santa Cruz Biotechnolgy), donkey anti-goat horseradish peroxidase immunoglobulin-G (Santa Cruz Biotechnology) for detection of OAT1 and OCT3, respectively. Immunoreactive bands were then detected by enhanced chemiluminescence. The membrane was stripped with stripping buffer (Thermo Fisher Scientific), and re-blotted with actin antibody (Sigma-Aldrich). The densities of specific bands were quantified by Image J.
Statistics
GraphPad Prism (version 3.0, La Jolla, CA, USA) was used for all statistical analyses. A dependent or independent t-test was used for comparison of data values. A P-value of equal or less than 0.05 was considered to indicate significant differences. All averages are expressed as arithmetic mean±s.e.m.
Acknowledgments
This work was supported by the Intramural Research Program of the National Institute of Diabetes and Digestive and Kidney Diseases, National Institutes of Health.
Footnotes
DISCLOSURE
All the authors declare no competing interests.
References
- 1.Miller BF, Winkler AW. The renal excretion of endogenous creatinine in man. Comparison with exogenous creatinine and inulin. J Clin Invest. 1938;17:31–40. doi: 10.1172/JCI100925. [DOI] [PMC free article] [PubMed] [Google Scholar]
- 2.Olsen NV, Ladefoged SD, Feldt-Rasmussen B, et al. The effects of cimetidine on creatinine excretion, glomerular filtration rate and tubular function in renal transplant recipients. Scand J Clin Lab Invest. 1989;49:155–159. doi: 10.3109/00365518909105415. [DOI] [PubMed] [Google Scholar]
- 3.Sansoe G, Ferrari A, Castellana CN, et al. Cimetidine administration and tubular creatinine secretion in patients with compensated cirrhosis. Clin Sci (Lond) 2002;102:91–98. [PubMed] [Google Scholar]
- 4.Zaltzman JS, Whiteside C, Cattran DC, et al. Accurate measurement of impaired glomerular filtration using single-dose oral cimetidine. Am J Kidney Dis. 1996;27:504–511. doi: 10.1016/s0272-6386(96)90160-2. [DOI] [PubMed] [Google Scholar]
- 5.Lorenz JN, Gruenstein E. A simple, nonradioactive method for evaluating single-nephron filtration rate using FITC-inulin. Am J Physiol Renal Physiol. 1999;276:F172–F177. doi: 10.1152/ajprenal.1999.276.1.F172. [DOI] [PubMed] [Google Scholar]
- 6.Harvey AM, Malvin RL. Comparison of creatinine and inulin clearances in male and female rats. Am J Physiol. 1965;209:849–852. doi: 10.1152/ajplegacy.1965.209.4.849. [DOI] [PubMed] [Google Scholar]
- 7.Harvey AM, Malvin RL. The effect of androgenic hormones on creatinine secretion in the rat. J Physiol. 1966;184:883–888. doi: 10.1113/jphysiol.1966.sp007954. [DOI] [PMC free article] [PubMed] [Google Scholar]
- 8.Darling IM, Morris ME. Evaluation of ‘true’ creatinine clearance in rats reveals extensive renal secretion. Pharm Res. 1991;8:1318–1322. doi: 10.1023/a:1015820316660. [DOI] [PubMed] [Google Scholar]
- 9.Stockelman MG, Lorenz JN, Smith FN, et al. Chronic renal failure in a mouse model of human adenine phosphoribosyltransferase deficiency. Am J Physiol. 1998;275:F154–F163. doi: 10.1152/ajprenal.1998.275.1.F154. [DOI] [PubMed] [Google Scholar]
- 10.Dunn SR, Qi Z, Bottinger EP, et al. Utility of endogenous creatinine clearance as a measure of renal function in mice. Kidney Int. 2004;65:1959–1967. doi: 10.1111/j.1523-1755.2004.00600.x. [DOI] [PubMed] [Google Scholar]
- 11.Keppler A, Gretz N, Schmidt R, et al. Plasma creatinine determination in mice and rats: an enzymatic method compares favorably with a high-performance liquid chromatography assay. Kidney Int. 2007;71:74–78. doi: 10.1038/sj.ki.5001988. [DOI] [PubMed] [Google Scholar]
- 12.Takahashi N, Boysen G, Li F, et al. Tandem mass spectrometry measurements of creatinine in mouse plasma and urine for determining glomerular filtration rate. Kidney Int. 2007;71:266–271. doi: 10.1038/sj.ki.5002033. [DOI] [PubMed] [Google Scholar]
- 13.Shemesh O, Golbetz H, Kriss JP, et al. Limitations of creatinine as a filtration marker in glomerulopathic patients. Kidney Int. 1985;28:830–838. doi: 10.1038/ki.1985.205. [DOI] [PubMed] [Google Scholar]
- 14.Urakami Y, Kimura N, Okuda M, et al. Transcellular transport of creatinine in renal tubular epithelial cell line LLC-PK1. Drug Metab Pharmacokinet. 2005;20:200–205. doi: 10.2133/dmpk.20.200. [DOI] [PubMed] [Google Scholar]
- 15.Gisclon LG, Giacomini KM. Inhibition of cimetidine transport by creatinine in luminal membrane vesicles prepared from rabbit kidney. Drug Metab Dispos. 1988;16:331–332. [PubMed] [Google Scholar]
- 16.Grundemann D, Liebich G, Kiefer N, et al. Selective substrates for non-neuronal monoamine transporters. Mol Pharmacol. 1999;56:1–10. doi: 10.1124/mol.56.1.1. [DOI] [PubMed] [Google Scholar]
- 17.Urakami Y, Kimura N, Okuda M, et al. Creatinine transport by basolateral organic cation transporter hOCT2 in the human kidney. Pharm Res. 2004;21:976–981. doi: 10.1023/b:pham.0000029286.45788.ad. [DOI] [PubMed] [Google Scholar]
- 18.Alnouti Y, Petrick JS, Klaassen CD. Tissue distribution and ontogeny of organic cation transporters in mice. Drug Metab Dispos. 2006;34:477–482. doi: 10.1124/dmd.105.006932. [DOI] [PubMed] [Google Scholar]
- 19.Lee WK, Reichold M, Edemir B, et al. The organic cation transporters OCT1, 2, and 3 mediate high affinity transport of the mutagenic vital dye ethidium in the kidney proximal tubule. Am J Physiol Renal Physiol. 2009;296:F1504–F1513. doi: 10.1152/ajprenal.90754.2008. [DOI] [PubMed] [Google Scholar]
- 20.Glube N, Langguth P. Caki-1 cells as a model system for the interaction of renally secreted drugs with OCT3. Nephron Physiol. 2008;108:p18–p28. doi: 10.1159/000115040. [DOI] [PubMed] [Google Scholar]
- 21.Arendshorst WJ, Selkurt EE. Renal tubular mechanisms for creatinine secretion in the guinea pig. Am J Physiol. 1970;218:1661–1670. doi: 10.1152/ajplegacy.1970.218.6.1661. [DOI] [PubMed] [Google Scholar]
- 22.Eraly SA, Vallon V, Vaughn DA, et al. Decreased renal organic anion secretion and plasma accumulation of endogenous organic anions in OAT1 knock-out mice. J Biol Chem. 2006;281:5072–5083. doi: 10.1074/jbc.M508050200. [DOI] [PubMed] [Google Scholar]
- 23.Buist SC, Klaassen CD. Rat and mouse differences in gender-predominant expression of organic anion transporter (Oat1-3; Slc22a6-8) mRNA levels. Drug Metab Dispos. 2004;32:620–625. doi: 10.1124/dmd.32.6.620. [DOI] [PubMed] [Google Scholar]
- 24.Ullrich KJ, Rumrich G, David C, et al. Bisubstrates: substances that interact with renal contraluminal organic anion and organic cation transport systems. I. Amines, piperidines, piperazines, azepines, pyridines, quinolines, imidazoles, thiazoles, guanidines and hydrazines. Pflugers Arch. 1993;425:280–299. doi: 10.1007/BF00374179. [DOI] [PubMed] [Google Scholar]
- 25.Ullrich KJ, Rumrich G, David C, et al. Bisubstrates: substances that interact with both, renal contraluminal organic anion and organic cation transport systems. II. Zwitterionic substrates: dipeptides, cephalosporins, quinolone-carboxylate gyrase inhibitors and phosphamide thiazine carboxylates; nonionizable substrates: steroid hormones and cyclophosphamides. Pflugers Arch. 1993;425:300–312. doi: 10.1007/BF00374180. [DOI] [PubMed] [Google Scholar]
- 26.Dantzler WH, Brokl OH. Verapamil and quinidine effects on PAH transport by isolated perfused renal tubules. Am J Physiol. 1984;246:F188–F200. doi: 10.1152/ajprenal.1984.246.2.F188. [DOI] [PubMed] [Google Scholar]
- 27.Gisclon LG, Boyd RA, Williams RL, et al. The effect of probenecid on the renal elimination of cimetidine. Clin Pharmacol Ther. 1989;45:444–452. doi: 10.1038/clpt.1989.53. [DOI] [PubMed] [Google Scholar]
- 28.Ullrich KJ, Rumrich G. Renal contraluminal transport systems for organic anions (paraaminohippurate, PAH) and organic cations (N1-methyl-nicotinamide, NMeN) do not see the degree of substrate ionization. Pflugers Arch. 1992;421:286–288. doi: 10.1007/BF00374841. [DOI] [PubMed] [Google Scholar]
- 29.Qi Z, Whitt I, Mehta A, et al. Serial determination of glomerular filtration rate in conscious mice using FITC-inulin clearance. Am J Physiol Renal Physiol. 2004;286:F590–F596. doi: 10.1152/ajprenal.00324.2003. [DOI] [PubMed] [Google Scholar]
- 30.Carr RA, Pasutto FM, Foster RT. Influence of cimetidine coadministration on the pharmacokinetics of sotalol enantiomers in an anaesthetized rat model: evidence supporting active renal excretion of sotalol. Biopharm Drug Dispos. 1996;17:55–69. doi: 10.1002/(SICI)1099-081X(199601)17:1<55::AID-BDD938>3.0.CO;2-#. [DOI] [PubMed] [Google Scholar]
- 31.Yuen PS, Dunn SR, Miyaji T, et al. A simplified method for HPLC determination of creatinine in mouse serum. Am J Physiol Renal Physiol. 2004;286:F1116–F1119. doi: 10.1152/ajprenal.00366.2003. [DOI] [PubMed] [Google Scholar]


