

Abstract
In vivo imaging of engraftment and immunorejection of transplanted islets is critical for further clinical development, with 1H MR imaging of superparamagnetic iron oxide-labeled cells being the current premier modality. Using perfluorocarbon nanoparticles, we present here a strategy for non-invasive imaging of cells using other modalities. To this end, human cadaveric islets were labeled with rhodamine-perfluorooctylbromide (PFOB) nanoparticles, rhodamine-perfluoropolyether (PFPE) nanoparticles or Feridex® as control and tested in vitro for cell viability and c-peptide secretion for 1 week. 19F MRI, computed tomography (CT) and ultrasound (US) imaging was performed on labeled cell phantoms and on cells following transplantation beneath the kidney capsule of mice and rabbits. PFOB and PFPE-labeling did not reduce human islet viability or glucose responsiveness as compared with unlabeled cells or SPIO-labeled cells. PFOB- and PFPE-labeled islets were effectively fluorinated for visualization by 19F MRI. PFOB-labeled islets were acoustically reflective for detection by US imaging and became sufficiently brominated to become radiopaque allowing visualization with CT. Thus, perfluorocarbon nanoparticles are multimodal cellular contrast agents that may find applications in real-time targeted delivery and imaging of transplanted human islets or other cells in a clinically applicable manner using MRI, US or CT imaging.
Keywords: cell tracking, molecular imaging, fluorine MRI, ultrasound imaging, X-ray imaging, islet cell, diabetes
1. INTRODUCTION
Islet transplantation is a promising method of restoring insulin secretion in patients with type I diabetes mellitus by replacing destroyed beta cells with cadaveric islets (1). A recent multinational trial examining the efficacy of the predominant islet transplantation protocol, the ‘Edmonton protocol’, suggested that islet transplantation can successfully restore long-term endogenous insulin production and glycemic stability but nevertheless insulin independence is usually not sustainable (2,3). It has become increasingly clear that our current methods of measuring the variable rates of graft function, namely patient blood glucose, C-peptide and glycosylated hemoglobin levels, are necessary but not sufficient to obtain an overall picture of successful transplantation (4). For instance, it is not clear whether the observed decline in insulin independence is caused by islet cell destruction via immune-mediated processes, by a normal decline in insulin secretion islets post-transplantation, or by other factors such as islet apoptosis (5). These questions can only be answered if the fate of individual islets can be assessed non-invasively.
Non-invasive cellular imaging using clinical imaging modalities could potentially elucidate some of the current unknowns in islet cell transplantation. Imaging transplanted islets in vivo represents a major challenge, as islets comprise only a small fraction of the total cellular volume in the liver after intraportal transplantation. Further, these islet cell clusters, measuring about 50–200 μm in diameter and containing approximately 2000 cells per islet, are randomly distributed throughout the relatively large network of hepatic microvasculature.
Owing to its high resolution and excellent soft tissue contrast, magnetic resonance imaging (MRI) has been the primary modality to visualize grafted islets. To this end, cells are commonly labeled with superparamagnetic iron oxide particles (SPIOs), enabling the visualization of initial engraftment and graft rejection (6–12). Using clinical SPIO formulations, the technique has recently been introduced in type I diabetic patients (13). However, a disadvantage of using contrast agents such as SPIO that provide hypointensity is that there can be many other sources of iron-induced hypointense contrast, e.g. blood clots, hemosiderosis or magnetic susceptibility artifacts. Insulin resistance syndrome (IRS) (14) and type 2 diabetes (15) are often associated with hepatic iron overload. Thus, the development of alternative contrast agents is desirable, in particular those that can also be used with other clinical imaging modalities.
Although 19F MRI with fluorinated tracer molecules was described three decades ago (16), it has been recently reintroduced for 19F molecular and cellular MRI (17–21), enabling ‘hot’ spot MRI without endogenous background signal (22). Unlike perfluoropolyether (PFPE, Fig. 1a), perfluorocarbons that contain bromine such as perfluorooctylbromide (PFOB, Fig 1e) are visible on X-ray. To this end, PFOB has been used as a liver-specific X-ray (23) or ultrasound (US) (24) contrast agent. We hypothesized that PFOB nanoparticles could potentially be used as a platform for multimodal cell tracking. In this study, we assessed the feasibility of imaging PFPE and PFOB-labeled human cadaveric islets using 19F MRI and PFOB-labeled islets for computed tomography (CT), and ultrasound imaging. We further compared the functional propertices of perfluocarbon-labeled cells to that of cells labeled with Feridex®. We report here on the use of PFPE for 19F MRI and PFOB for 19F MRI, CT and US imaging of human pancreatic islets.
Figure 1.

Physicochemical properties. Molecular structure (a, e), 19F NMR spectroscopic profile (b, f), zeta potential (c, g) and size distribution (d, h) of PFPE (a–d) and PFOB (e–h) nanoparticles. Note the single 19F NMR narrow peak for PFPE, and the triplet spectroscopic profile for PFOB.
2. METHODS
2.1. Perfluorocarbon nanopartices and cell labeling
PFOB (Sigma Co.) was emulsified at 40% v/v in a mixture of 5% lecithin and 0.1% rhodamine-phosphatidylethanolamine followed by 10 min sonication at 40% maximum power. PFPE emulsions were prepared as previously described (17). Size and ξ-potential were determined by dynamic light scattering and laser Doppler anemometry, respectively, using a Zetasizer 3000 (Malvern Instruments, Southborough, MA, USA). Size measurements were performed at 25°C at a scattering angle of 90°.
Fresh human cadaveric islets were provided by the National Islet Cell Resource Center Distribution Program. Islets were cultured in RPMI 1640 medium (Gibco), supplemented with 10% fetal calf serum and 1% penicillin–streptomycin–L-glutamine (all reagents from Sigma Co) in a humidified incubator at 37°C and a 5% CO2 atmosphere. Islets were labeled with the SPIO formulation Feridex® (Berlex Laboratories) by overnight incubation at 25 μg/ml without the use of transfection agents, and then washed three times to remove extracellular contrast agent. For perfluorocarbon labeling of islets, 8 μl of emulsion was added per ml of culture medium, and this mixture was sonicated again at 40% power. The resulting mixture was filtered through a 0.22 μm filter, added to the islets, and cells were incubated overnight.
2.2. Assessment of intracellular labeling
For viability and functional in vitro tests of labeled cells, the media was replaced every 3 days. SPIO (Feridex®)-labeled islets were washed and cultured in normal medium. In order to detect ferric iron uptake, SPIO-labeled islets were fixed with 2% glutaraldehyde and stained for ferric iron using Prussian Blue staining (25). Immunofluorescent staining with anti-dextran monoclonal antibody was used to detect the dextran coating of Feridex® (26). Immunofluorescence analysis was performed using Olympus BX51 and IX71 epifluorescence microscopes equipped with an Olympus DP-70 digital acquisition system. Frozen sections (5 μm thick) of washed, pelleted labeled islets were fixed in 4% paraformaldehyde for 5 min. Sections were first blocked in 5% donkey serum, 1% BSA and 0.1% triton X-100 for 30 min at room temperature and then incubated overnight at 4°C with anti-insulin antibody (Dako guinea pig-anti swine insulin, 1:500). After washing, sections were incubated with secondary antibody (donkey anti-guinea pig conjugated to Alexa 488, Invitrogen, 1:1000) for 1 h at room temperature. Sections were counterstained with DAPI.
2.3. Cell viability and c-peptide secretion
The viability of labeled human islets was determined using a fluorescence viability assay at days 1 and 7 post-labeling. Medium-sized islets of similar size cultured in microwell inserts (membrane pore diameter 12 μm; Millicell PCF) were chosen for sampling at each time point. For each time point and labeling condition, 30 islets were evaluated from 10 fields of view for viability by qualitative means, estimating the percentage of viable cells in each islet. Cells were incubated for 30 min with 10 mM Newport Green (NG, Sigma, St Louis, MO, USA) and then for 10 min with 5 mM propidium iodide (PI, Sigma, St Louis, MO, USA), which only stains dead cells.
To assess the insulin secretion response of labeled islets, a static incubation assay was performed at days 1 and 7 post-labeling. One hundred islets were placed in a culture insert (membrane pore diameter 12 μm; Millicell PCF) in six-well plates. Islets were subjected to a stepwise increase in glucose, from 3 to 6 mM D-glucose in RPMI 1640 medium, followed by incubation for 1.5 h. The resulting insulin secretion was determined using an ultrasensitive human c-peptide ELISA (Alpco Diagnostics). All viability and insulin secretion analyses were performed in 10 replicates.
2.4. Pulse-chase 19F-NMR experiments
Cell lysates of islets were prepared by addition of ice-cold RIPA buffer (Thermo Scientific) to pelleted islets for 10 min. Lysates were prepared from islets 1, 3 and 7 days post PFPE labeling. Samples were diluted 1:1 with deionized water and placed in a 5 mm NMR sample tube (535-PP-7, Wilmad Laboratory) with a coaxial insert (WGS-5BL, Wilmad) that contained a solution of 1.35 M trifluoroacetic acid (TFA).19F-NMR experiments were performed at 22°C on an 11.7 T Varian INOVA system using a broadband probe tuned to fluorine. For each sample the probe was tuned and manually shimmed. A simple excite-detect pulse sequence [64 transients, 10 μs, 90° pulse, 41.67 μs dwell time, 12 000 acquisition points, 5 s pre-delay (TR = 5.5 s)] was used. Spectra were processed using 32k zero-filling and 5 Hz exponential line broadening. The concentration of PFPE in each sample was calculated based upon the peak integral ratio of PFPE to the known TFA concentration taking into account the volume of the coaxial insert.
2.5. Imaging of labeled islet phantoms
For 1H MR imaging, Feridex®- labeled islets were suspended in 2% gelatin at a density of 50 islets/ml gel. A 3T Philips Achieva MR scanner equipped with a six-element cardiac phased-array receiver coil was used for phantom imaging. A T2*-weighted gradient echo sequence with the following parameters was used: repetition time (TR) = 7.0 ms; echo time (TE) = 2.3 ms; flip angle (FA) = 15°; field of view (FOV) = 22 cm; matrix = 512 × 512; slice thickness = 1 mm. For micro-CT imaging, 10 islets were suspended in 4% gelatin. For each scan, 1024 projections were obtained at 0.70° steps for a 360° rotation with voltage and current of 50 kVp and 600 mA, respectively. Acquisition time for each view was 1 s. Scanning was performed in a clockwise direction with an X-ray tube to detector distance of 269 mm and an X-ray tube to center of rotation (COR) distance of 225 mm.
For 19F MR imaging, 10, 50, 100 and 200 PFOB-labeled islets were suspended as point sources in 4% gelatin in 15 ml conical tubes. An 11.7 T Bruker Avance System equipped with a single channel proton probe tunable to fluorine was used. For each sample, the probe was tuned to fluorine, locked on D2O, and manually shimmed on the lock signal. A simple one-pulse sequence (one accumulation, 10 μs 90° pulse, 10.62 μs dwell time, and 8k acquisition points) was used to collect the spectra. The offset for imaging experiments with PFOB was set to the center line of the group of lines with a range of 10 ppm placed at highfield in the spectrum (see Fig. 1f). To select the PFPE nanoparticles, the center frequency was chosen to be that of the single PFPE peak (see Fig. 1b). The PFOB nanoparticles were specifically imaged by exciting either the single peak near the crown ether (CE) (i.e. 600 Hz below CE) with a narrow bandwidth (900 Hz) or the triplet (i.e. 2000 Hz from CE).
For ultrasound imaging, after 4 days in culture, cells were incubated with 8 μl of emulsion per milliliter of culture medium. For phantom creation, PFOB-labeled islets were suspended in 4% gelatin. Different numbers of islets (10–200) were injected directly into the gelatin bed poured into a glass incubation chamber. Sonography was performed using a Micromaxx ultrasound machine (Sonosite) equipped with a L25E 13-6 MHz transducer probe. Gray-scale imaging was performed with a center probe frequency of 6.00 MHz, a dynamic range of 55 dB, and a persistence setting of 2. Gray-scale gain was adjusted for baseline imaging.
2.6. Renal subcapsular transplantation of islets in mice
In recipient C57/Bl6 mice (n = 3), 2000 PFOB-labeled islets were grafted beneath the renal capsule of the left kidney. The animals were anesthetized with an intra-peritoneal injection of a mixture of ketamine (50 mg/kg) and acepromazine (5 mg/kg). The right kidney was exposed through an abdominal incision and encapsulated islet cells were implanted under the renal capsule. The incision was sutured, and the animals were allowed to recover or were sacrificed for ex vivo imaging. The uninjected right kidney served as a control.
2.7. Renal subcapsular transplantation of islets in rabbits
Rabbits (n = 2) were pre-anesthetized with a mixture of intramuscular acepromazine (1 mg/kg) and ketamine hydrochloride (20 mg/kg). Intravenous (i.v.) access was established via a marginal ear vein and the animal was induced using sodium pentothal i.v. (15–40 mg/kg to effect). The animal was intubated and general anesthesia was maintained using i.v. barbiturates or inhalational anesthesia, e.g. isoflurane. Once a surgical plane of anesthesia was achieved, a midline incision was made and the kidney of the rabbit was exposed. To help ensure islets remained localized within the transplanted section of the kidney capsule, an aliquot of 10 000 PFPE-labeled islets in cooled Matrigel (BD Biosciences) was injected directly using a 20 gauge needle beneath the capsule of the left kidney. The site of injection was sealed with 2-octyl cyanocrylate (Dermabond, UCGI) after needle removal. After transplantation, the rabbit’s abdomen was closed using an interrupted suture technique for the muscle layer and a continuous pattern for the subcuticular layer using absorbable sutures.
2.8. In vivo CT imaging
CT images were obtained using a Gamma Medica XSPECT scanner 24 h after subcapsular injection of PFOB-labeled islets. Mice were placed on an animal bed and anesthetized with 2.5% isoflurane throughout the imaging procedure. For each scan, 1024 projections with 1024 × 1024 pixels were obtained at 0.70° steps for a 360° rotation with voltage and current of 50 kVp and 600 mA, respectively. Acquisition time for each view was 1 second. Scanning was performed in a clockwise direction with an X-ray tube to detector distance of 269 mm and an X-ray tube to COR distance of 225mm. Image reconstruction was performed using the manufacturer software. Segmentation and 3D reconstruction was performed using the imaging software Amira.
2.9. Fluorine MRI
Twenty-four hours after subcapsular injection of PFOB-labeled islets in mice, the kidney was fixed with 4% paraformaldehyde overnight and then embedded in gelatin. MR imaging was performed using a 9.4 T MRI Scanner (Bruker BioSpin MRI GmbH), using a home-built RF solenoid probe tunable to 19F and 1H frequencies. 19F MR images were obtained using a multi-slice (10 ×1 mm slices) fast spin echo sequence (TE = 47 ms; TR = 1079 ms; NA = 64; FOV = 2.5 ×2.5 cm and matrix = 64 ×32). 32). The fluorine images were overlaid on 1H MR images obtained with a multi-slice SE sequence (TR = 1000 ms, TE = 15 ms, matrix = 128 ×128, 1 mm slice thickness, FOV = 2.5 ×2.5 cm).
Three hours after subcapsular injection of 10 000 PFPE-labeled islets in a rabbit, MR imaging was performed using a Siemens 3 T Trio clinical scanner. To this end, a custom fluorine coil was used that consisted of a phased-array with four coil elements. Scout proton MR images were obtained using a surface coil (Body Matrix, Siemens, Erlangen, Germany) followed by manual shimming using the body coil. The custom fluorine coil was then used to obtain fluorine images using a 3D steady-state free precession (TrueFISP) pulse sequence using the following parameters: TE = 2.1 ms; TR = 4.1 ms; NSA = 32; 1.5 ×1.5 ×2.0 mm voxel size, FOV = 672 ×250 mm, 1002 Hz bandwidth, 70° flip angle, and an acquisition time of about 12 min. To calibrate signal intensity, PCR tubes (Eppendorf) containing various dilutions of PFPE nanoparticles in deionized water were affixed with surgical paper tape to multiple areas of the surface coil.
2.10. In vivo ultrasound imaging
Eight-week-old nu/nu mice obtained from Charles River (n = 5) were injected intramuscularly with 1, 5, 10 and 25 islets in the hind limb using a 25 gage needle. Anesthesia was maintained with 2.5% isoflurane. Islets were imaged using a Visualsonics Vevo 2100 ultrasound machine equipped with a 32MHz MS 400 probe with ultrasound gel as the interphase media.
2.11. Statistical analysis
Statistical testing for significant differences in glucose responsiveness over time and amongst labeling methods was performed using a cross-sectional, time-series linear regression model using a generalized least squares random effects estimator (xtreg, Stata Corporation, College Station, TX, USA), which allows for corrections for the correlated nature of the time-series data. In our study, we looked at interactions of labeling method and time. A p-value <0.05 was considered statistically significant. The p-values are given for differences between labeling method and time as well as the interaction between labeling method and time. Values are reported as mean ± standard deviation and time. Regression coefficients and standard errors are reported. B-values represent the coefficient of the regression with respect to the interaction between labeling and day, with SE values being the standard error of this coefficient in the regression.
3. RESULTS
3.1. Physicochemical properties
The 19F NMR spectroscopic profiles of our PFPE and PFOB nanoparticle preprarations were confirmed to exhibit the characteristic single (Fig. 1b) and multiple fluorine (Fig. 1f) peaks. For PFPE nanoparticles, the Zeta potential was determined to be 79.6 ± 14.7 mV (Fig. 1c), with an average particle diameter of 169.4 nm (Fig. 1d). For PFOB, these values were 72.8 ± 3.0 mV and 213.4 nm, respectively (Fig. 1g, h).
3.2. In vitro functionality and labeling of human islets
Human islets were labeled with Feridex®, PFPE and PFOB, and compared with unlabeled islets for viability and glucose responsiveness at days 1 and 7 (Fig. 2). Using a microfluoretic viability assay, there was a pattern of decreasing viability of islets in culture at day 7 (B = −0.036, SE = 0.004, p <0.001) relative to day 1 (Fig. 2a). However, PFOB- and PFPE-labeled islets showed a smaller decline in viability at day 7 (B = 0.014, SE = 0.006, p = 0.03 PFOB and B = 0.017, SE = 0.006, p = 0.006 PFPE) relative to unlabeled islets. There was no difference in the pattern of viability decline between unlabeled and Feridex®-labeled islets.
Figure 2.

Viability and insulin secretion of labeled islets in vitro. The viability (a) and glucose stimulation index (b) for labeled islets (Feridex®-labeled, striped bars; PFOB-labeled, gray bars; and PFPE-labeled islets, black bars) remained unaltered as compared with unlabeled islets (open bars), except for an increase of viability with both fluorinated compounds at day 7. Asterisks indicate statistically significant differences (p <0.05). (c) 19F NMR pulse-chase experiments. PFPE-labeled islets were labeled and sampled for up to 7 days after placing in culture in order to determine the amount of label retention. (d) Relative 19F NMR signal intensity at 3 T with varying concentrations of PFPE. (e) PFPE content in various islet numbers as calculated by comparing signal in islets to standard curve created in (d).
Islets were incubated in solutions of 3 and 6 mM glucose to determine whether specific differences in insulin secretion upon glucose stimulation occurred (Fig. 2b). The glucose stimulation index, defined as the difference in insulin secretion at 6 mM glucose to insulin secretion at 3 mM glucose, was measured after days 1 and 7. The stimulation index values (mean ± SD) at day 1 were 1.95 ± 0.2, 2.17 ± 0.3, 2.53 ± 0.3 and 1.97 ± 0.4 for Feridex®-labeled, PFOB-labeled, PFPE-labeled and unlabeled control islets, respectively. Over the time points studied, the stimulation index improved from day 1 to day 7 (B = 0.3, SE = 0.12, p = 0.008). The glucose stimulation index for labeled islets was similar to unlabeled islets except for PFOB-labeled islets, which showed a slight improvement in glucose responsiveness (B = 0.6, SE = 0.13, p <0.001).
19F NMR pulse-chase experiments demonstrated a gradual decline in concentration of PFPE in labeled islets by day 7 post-labeling, at which time point 71% of the initial amount of intracellular PFPE was retained (Fig. 2c).
Using phantoms with known amounts of PFPE, the acquired 19F NMR signal intensity was found to be linear with concentration (Fig. 2d). The observation that the 19F signal was also linear with the number of labeled islets (Fig. 2e) enables a quantitative assessment of the number of labeled cells.
Feridex®-labeling resulted in a dispersed, inhomogeneous pattern of iron oxide uptake by a minority of islet cells (Fig. 3a, b). PFPE and PFOB-labeling, on the other hand, demonstrated uptake of fluorinated labels by nearly all islet cells (Fig. 3c, d). Anti-insulin immunostaining of PFOB-labeled islets showed a positive staining for insulin production in and around cells that contained PFOB (Fig. 3d).
Figure 3.
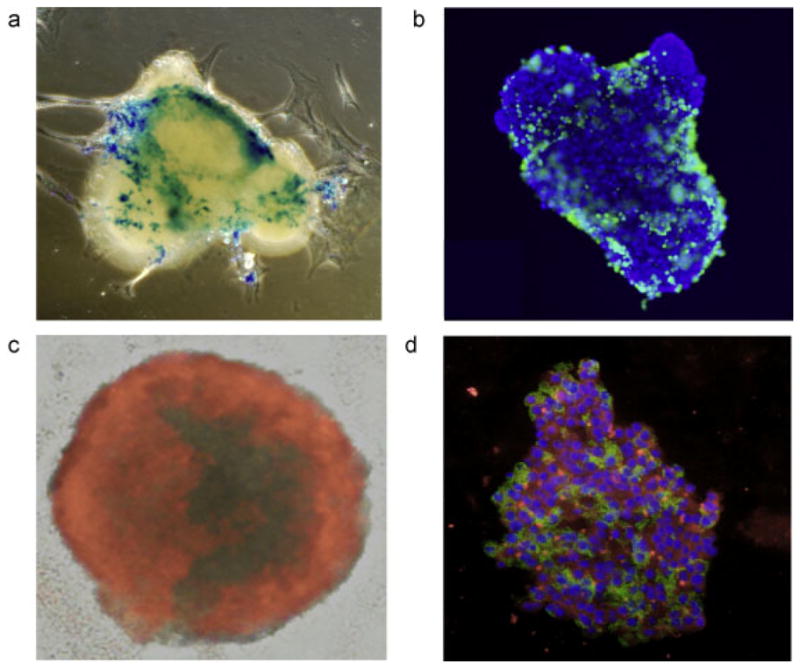
Microscopic appearance of labeled islets. Prussian Blue staining (a, blue = ferric iron in iron oxide) and anti-dextran immunostaining (b, green = dextran coat of Feridex®, blue = DAPI nuclear counterstain) of Feridex®-labeled human islets reveal scattered inhomogeneous staining of cells. (c) When labeled with PFPE/rhodamine, all cells exhibit uptake and positive staining of label. (d) Immunostaining of PFOB/rhodamine (red)-labeled islet cells demonstrates functional insulin production (green, with DAPI blue nuclear counterstain).
3.3. Sensitivity of MR, CT and ultrasound imaging for labeled islet phantoms
Human islets were labeled with Feridex® and dispersed in gelatin at a density of 50 islets/ml. Individual, single Feridex® -labeled islets were easily visualized in images of gelatin samples (Fig. 4a). PFOB-labeled islets became sufficiently radiopaque to be detected using micro-CT (Fig. 4b). The sensitivity of 19F MR at 9.4T (Fig. 4c) and 3T 19F MR imaging (Fig. 4d) of PFPE-labeled islets and ultrasound (Fig. 4e) imaging was found to be somewhat lower, with a minimum threshold for detection of ~10 islets.
Figure 4.

Sensitivity of multimodality imaging of labeled human islets. (a) 1H MR imaging of Feridex®-labeled islets at 50 islets/ml gel demonstrates clear detection of hypointense single islets (inset). (b) Micro-CT of 10 PFOB-labeled islets. (c) 9.4 T 19F MR imaging of PFPE-labeled islets. From left to right, phantom contains 10, 50, 100 and 200 islets. (d) 3 T 19F MR imaging of PFPE-labeled islets. On top from left to right phantom containing 500, 1000, 2000, 3000 and 4000 μg of PFPE. On bottom from left to right 500, 1000, 1500, 2000 and 2500-PFPE labeled islets. (e) Ultrasound imaging of PFOB-labeled islets. From left to right, phantom contains 10, 50, 100 and 200 islets. (f) In vivo ultrasound imaging of PFOB-labeled islets transplanted intramuscularly in a nude mouse with point injections of 1, 5, 10 and 25 islets.
3.4. Animal imaging studies
All animal studies were approved by our Institutional Animal Care and Use Committee. Using an ultrasound device and probe optimized for small animal imaging, single islets could be detected after subcutaneous transplantation with increasing signal from increasing islet clusters (Fig. 4f). When 2000 PFOB-labeled islets were injected into the subcapsular region of the kidney in normal mice, individual islets were clearly detected by micro-CT as radiopacities with similar Hounsfield units to bone (Fig. 5a, b). After subcapsular renal injection of 2000 PFOB-labeled islets in mice, a clear 19F hot spot signal could be detected although not at the single islet level at 9.4 T (Fig. 5c, d). At 3 T after subcapsular renal injection of 2000 PFPE-labeled islets a signal corresponding to 3470 μg of PFPE was detected (Fig. 5e). Similarly after 10 000 PFPE-labeled islets were transplanted under the kidney capsule of a rabbit, islets could be clearly visualized at 3 T in vivo (Fig. 5f).
Figure 5.
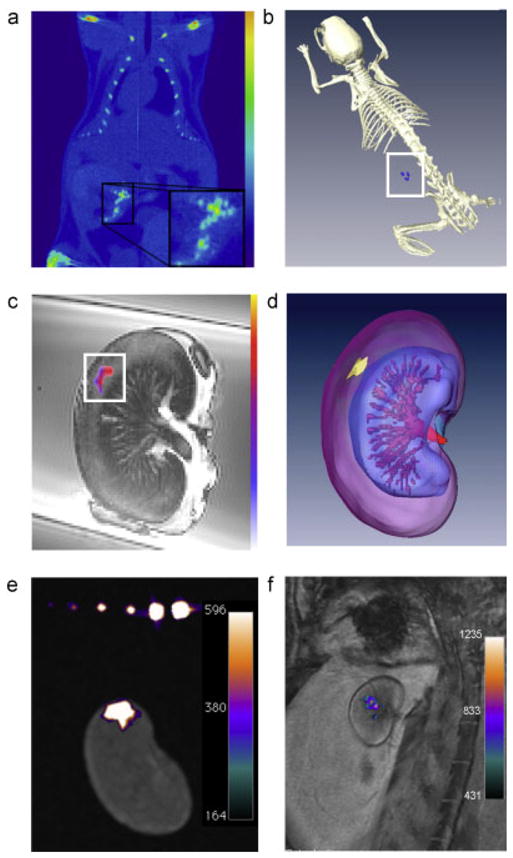
Multimodality imaging of labeled human islet transplants. (a) In vivo single plane micro-CT image of a mouse containing a renal subcapsular transplant of 2000 islets (inset). (b) In vivo 3D reconstruction image. Note that the density of PFOB radiopacity of labeled islets in the 3D reconstructed image is of a similar scale as that for bone. (c) Single-plane 9.4 T 19F/1H MR overlay image of mouse kidney containing a subcapsular transplant of 2000 human PFOB-labeled islets. (d) 9.4 T 19F/1H 3D reconstruction image. (e) Ex vivo 3 T 19F/1H image of a mouse transplanted with 2000 PFPE-labeled islets. The signal corresponds to 3470 μg PFPE. (f) In vivo 3 T 19F/1H image of a rabbit transplanted with 10 000 PFPE-labeled islets under the kidney capsule demonstrates clear visualization of cell transplants. The signal corresponds to 14 153 μg PFPE.
4. DISCUSSION
With MR imaging, it is possible to track the delivery and biodistribution of magnetically labeled cells (25). In diabetes research, magnetic labeling of islet cells has been performed in rodents (6,8–11,27) and humans (13) for MR monitoring of islet grafting. This has allowed a precise determination of the spatial distribution of islets after intraportal infusion in the liver or subcapsular kidney transplantation in rodents. Moreover, assessment of graft rejection in syngeneic grafts vs allografts was possible (6,8). Only in the allogeneic group did the number of hypointensities gradually decrease, i.e. ~35% of the initial signal, suggesting destruction of the allogeneic, but not the syngeneic cells (8).
Recently, MRI cell tracking using Feridex®/Endorem® has been introduced into the clinic (13,28,29). These initial clinical trials have proven that MRI cell tracking utilizing SPIOs is a clinically safe and feasible procedure. In the first patient study (28), Endorem® and 111Indium oxine-labeled dendritic cells, primed with melanoma antigens, were used as cancer vaccines to boost the immune system of melanoma patients. To this end, cells were injected in draining lymph nodes under ultrasound guidance. While the main aim of the study was to determine cell migration to nearby lymph nodes, a surprising finding was that the dendritic cells were not correctly injected in the target lymph node in half the patients. Only with MRI, and not radionuclide imaging, could it be shown that cells were accidentally injected into either the surrounding muscles or perinodal fat rather than the draining lymph node. These results demonstrate the importance of MR labeling, not only in assessing cell biodistribution and migration following injection, but also the potential to guide targeting of the injections in real-time using MR-compatible devices.
As opposed to SPIOs that create signal voids on T2*-weighted MR scans, perfluorocarbons can be used in conjunction with 19F MRI to create a ‘positive hot spot’ signal (22). The use of fluorinated contrast agents, therefore, represents a different approach to cellular labeling and cell tracking (17–20). Because there is negligible endogenous fluorine signal, any signal detected by 19F MRI must originate from the fluorinated contrast agents used for labeling cells. The hot spot fluorine can be superimposed on anatomical 1H MR images taken during the same session to provide soft tissue anatomy and precise organ localization (Fig. 5). Both PFPE and PFOB are attractive in terms of theoretical safety as they are biologically inert and are not broken down, unlike most metal-based contrast agents. Instead, they leave the body in gaseous phase by exhalation. PFOB is marketed both as LiquiVent® (Alliance Pharmaceuticals) (30), an oxygen carrying liquid drug, and Oxygent® (Alliance Pharmaceuticals), a blood substitution agent.
As compared with PFOB, PFPE is preferred for use as a 19F MR contrast agent as all its fluorine atoms are chemically equivalent yielding a single peak on NMR spectroscopy (compare Fig. 1b and Fig. 1f). This contrasts to the 19F NMR spectrum of PFOB, where eight resonance peaks are observable, one for each chemically equivalent 19F nucleus. Thus, as an 19F MR contrast agent, PFPE has a higher sensitivity, but due to the lack of bromine it lacks radiopacity and, thus, unlike PFOB, cannot be used as a CT contrast agent. Indeed, PFOB-labeled islets proved to be detectable with CT after transplantation in the subcapsular space of the kidney (Fig. 5). Yet, they were still sufficiently fluorinated to be detected by 19F MRI at a density of 2000 labeled islets (Fig. 5). Here, we have shown that, in vitro, micro-CT detection of PFOB-labeled islets is feasible (Fig. 4). In addition, since PFOB is visible with ultrasound (24,31), we were able to detect PFOB-labeled cells in phantoms at a threshold of ~10 islets, and in vivo at the near-single islet level (Fig. 4). The combination of ultrasound, CT, and 19F MRI visibility makes PFOB an ideal contrast agent for multimodal cell tracking.
A secondary aim of this study was to assess whether perfluorocarbon labeling would inhibit the secretory activity and overall viability of cultured purified islets before transplantation. A previous study has shown that labeling pancreatic islet cells with SPIO led to a significant decrease in insulin secretion as compared with unlabeled cells(6). PFOB and PFPE did not appear to impede cellular function and viability. Our comparison studies showed that there was a slight benefit in glucose responsiveness of PFOB-labeled islets when compared with unlabeled islets (Fig. 2). Interestingly, our islet viability data showed that there is a statistically significant increase in viability in PFOB- and PFPE-labeled islets compared with unlabeled islets (Fig. 2). Since the culture media was supplemented with perfluorocarbons, we cannot determine whether this enhanced viability was due to the presence of extra- or intracellular PFOB. Perfluorocarbons have been shown to act as an oxygen sink facilitating an increase in gas exchange. For this reason, perfluorocarbons have been used as successful blood substitution agents in clinical trials, as they have a high oxygen solubility coefficient and maintain high oxygen partial pressures for extended times. Furthermore, these agents can serve as oxygen ‘reservoirs’ for harvested organs in pancreas transplantation studies (32–36).
Summarized, this study represents a first attempt at functional cell labeling with a radiopaque and acoustic fluorinated MR contrast agent for detection with X-ray, ultrasound imaging and MRI. CT and ultrasound imaging systems are widely available, and its application for imaging of cells will significantly expand the use of image-guided cell injections for visualization of cells at the target site in real-time. At present, this has been limited to MR-guided procedures (37–39). As superimposition of CT and MRI scans, using hybrid X-ray/MR imaging systems (40,41), becomes more prevalent, multimodal contrast agents such as PFOB nanoparticles and newer PFC agents (42) may provide researchers and clinicians more flexibility to accurately monitor the injection and engraftment of transplanted cells in vivo using different imaging modalities. Our finding that 10 000 labeled islets (which is only 2.5% of the amount of islets given to type I diabetes patients) (2) can be detected at 3 T using a clinical setting supports further investigations.
References
- 1.Robertson RP, Davis C, Larsen J, Stratta R, Sutherland DE. Pancreas and islet transplantation for patients with diabetes. Diabetes Care. 2000;23(1):112–116. doi: 10.2337/diacare.23.1.112. [DOI] [PubMed] [Google Scholar]
- 2.Shapiro AM, Ricordi C, Hering BJ, Auchincloss H, Lindblad R, Robertson RP, Secchi A, Brendel MD, Berney T, Brennan DC, Cagliero E, Alejandro R, Ryan EA, DiMercurio B, Morel P, Polonsky KS, Reems JA, Bretzel RG, Bertuzzi F, Froud T, Kandaswamy R, Sutherland DE, Eisenbarth G, Segal M, Preiksaitis J, Korbutt GS, Barton FB, Viviano L, Seyfert-Margolis V, Bluestone J, Lakey JR. International trial of the Edmonton protocol for islet transplantation. New Engl J Med. 2006;355(13):1318–1330. doi: 10.1056/NEJMoa061267. [DOI] [PubMed] [Google Scholar]
- 3.Ryan EA, Bigam D, Shapiro AM. Current indications for pancreas or islet transplant. Diabetes Obes Metab. 2006;8(1):1–7. doi: 10.1111/j.1463-1326.2004.00460.x. [DOI] [PubMed] [Google Scholar]
- 4.Merani S, Shapiro AM. Current status of pancreatic islet transplantation. Clin Sci (Lond) 2006;110(6):611–625. doi: 10.1042/CS20050342. [DOI] [PubMed] [Google Scholar]
- 5.Bonner-Weir S. Life and death of the pancreatic beta cells. Trends Endocrinol Metab. 2000;11(9):375–378. doi: 10.1016/s1043-2760(00)00305-2. [DOI] [PubMed] [Google Scholar]
- 6.Jirak D, Kriz J, Herynek V, Andersson B, Girman P, Burian M, Saudek F, Hajek M. MRI of transplanted pancreatic islets. Magn Reson Med. 2004;52(6):1228–1233. doi: 10.1002/mrm.20282. [DOI] [PubMed] [Google Scholar]
- 7.Caruthers SD, Neubauer AM, Hockett FD, Lamerichs R, Winter PM, Scott MJ, Gaffney PJ, Wickline SA, Lanza GM. In vitro demonstration using 19F magnetic resonance to augment molecular imaging with paramagnetic perfluorocarbon nanoparticles at 1.5 Tesla. Invest Radiol. 2006;41(3):305–312. doi: 10.1097/01.rli.0000199281.60135.6a. [DOI] [PubMed] [Google Scholar]
- 8.Kriz J, Jirak D, Girman P, Berkova Z, Zacharovova K, Honsova E, Lodererova A, Hajek M, Saudek F. Magnetic resonance imaging of pancreatic islets in tolerance and rejection. Transplantation. 2005;80(11):1596–1603. doi: 10.1097/01.tp.0000183959.73681.b9. [DOI] [PubMed] [Google Scholar]
- 9.Tai JH, Foster P, Rosales A, Feng B, Hasilo C, Martinez V, Ramadan S, Snir J, Melling CW, Dhanvantari S, Rutt B, White DJ. Imaging islets labeled with magnetic nanoparticles at 1.5 Tesla. Diabetes. 2006;55(11):2931–2938. doi: 10.2337/db06-0393. [DOI] [PubMed] [Google Scholar]
- 10.Evgenov NV, Medarova Z, Dai G, Bonner-Weir S, Moore A. In vivo imaging of islet transplantation. Nat Med. 2006;12(1):144–148. doi: 10.1038/nm1316. [DOI] [PubMed] [Google Scholar]
- 11.Evgenov NV, Medarova Z, Pratt J, Pantazopoulos P, Leyting S, Bonner-Weir S, Moore A. In vivo imaging of immune rejection in transplanted pancreatic islets. Diabetes. 2006;55(9):2419–2428. doi: 10.2337/db06-0484. [DOI] [PubMed] [Google Scholar]
- 12.Frangioni JV, Hajjar RJ. In vivo tracking of stem cells for clinical trials in cardiovascular disease. Circulation. 2004;110(21):3378–3383. doi: 10.1161/01.CIR.0000149840.46523.FC. [DOI] [PubMed] [Google Scholar]
- 13.Toso C, Vallee JP, Morel P, Ris F, Demuylder-Mischler S, Lepetit-Coiffe M, Marangon N, Saudek F, James Shapiro AM, Bosco D, Berney T. Clinical magnetic resonance imaging of pancreatic islet grafts after iron nanoparticle labeling. Am J Transplant. 2008;8(3):701–706. doi: 10.1111/j.1600-6143.2007.02120.x. [DOI] [PubMed] [Google Scholar]
- 14.Mendler MH, Turlin B, Moirand R, Jouanolle AM, Sapey T, Guyader D, Le Gall JY, Brissot P, David V, Deugnier Y. Insulin resistance-associated hepatic iron overload. Gastroenterology. 1999;117(5):1155–1163. doi: 10.1016/s0016-5085(99)70401-4. [DOI] [PubMed] [Google Scholar]
- 15.Fernandez-Real JM, Lopez-Bermejo A, Ricart W. Cross-talk between iron metabolism and diabetes. Diabetes. 2002;51(8):2348–2354. doi: 10.2337/diabetes.51.8.2348. [DOI] [PubMed] [Google Scholar]
- 16.Holland GN, Bottomley PA, Hinshaw WS. 19F magnetic resonance imaging. J Magn Reson. 1977;28:133–136. [Google Scholar]
- 17.Ahrens ET, Flores R, Xu H, Morel PA. In vivo imaging platform for tracking immunotherapeutic cells. Nat Biotechnol. 2005;23(8):983–987. doi: 10.1038/nbt1121. [DOI] [PubMed] [Google Scholar]
- 18.Partlow KC, Chen J, Brant JA, Neubauer AM, Meyerrose TE, Creer MH, Nolta JA, Caruthers SD, Lanza GM, Wickline SA. 19F magnetic resonance imaging for stem/progenitor cell tracking with multiple unique perfluorocarbon nanobeacons. Faseb J. 2007;21(8):1647–1654. doi: 10.1096/fj.06-6505com. [DOI] [PubMed] [Google Scholar]
- 19.Srinivas M, Morel PA, Ernst LA, Laidlaw DH, Ahrens ET. Fluorine-19 MRI for visualization and quantification of cell migration in a diabetes model. Magn Reson Med. 2007;58(4):725–734. doi: 10.1002/mrm.21352. [DOI] [PubMed] [Google Scholar]
- 20.Janjic JM, Srinivas M, Kadayakkara DK, Ahrens ET. Self-delivering nanoemulsions for dual fluorine-19 MRI and fluorescence detection. J Am Chem Soc. 2008;130(9):2832–2841. doi: 10.1021/ja077388j. [DOI] [PubMed] [Google Scholar]
- 21.Tran TD, Caruthers SD, Hughes M, Marsh JN, Cyrus T, Winter PM, Neubauer AM, Wickline SA, Lanza GM. Clinical applications of perfluorocarbon nanoparticles for molecular imaging and targeted therapeutics. Int J Nanomed. 2007;2(4):515–526. [PMC free article] [PubMed] [Google Scholar]
- 22.Bulte JW. Hot spot MRI emerges from the background. Nat Biotechnol. 2005;23(8):945–946. doi: 10.1038/nbt0805-945. [DOI] [PubMed] [Google Scholar]
- 23.Mattrey RF, Long DM, Multer F, Mitten R, Higgins CB. Perfluoroctylbromide: a reticuloendothelial-specific and tumor-imaging agent for computed tomography. Radiology. 1982;145(3):755–758. doi: 10.1148/radiology.145.3.7146408. [DOI] [PubMed] [Google Scholar]
- 24.Mattrey RF, Scheible FW, Gosink BB, Leopold GR, Long DM, Higgins CB. Perfluoroctylbromide: a liver/spleen-specific and tumor-imaging ultrasound contrast material. Radiology. 1982;145(3):759–762. doi: 10.1148/radiology.145.3.7146409. [DOI] [PubMed] [Google Scholar]
- 25.Bulte JW, Arbab AS, Douglas T, Frank JA. Preparation of magnetically labeled cells for cell tracking by magnetic resonance imaging. Meth Enzymol. 2004;386:275–299. doi: 10.1016/S0076-6879(04)86013-0. [DOI] [PubMed] [Google Scholar]
- 26.Walczak P, Kedziorek DA, Gilad AA, Lin S, Bulte JW. Instant MR labeling of stem cells using magnetoelectroporation. Magn Reson Med. 2005;54(4):769–774. doi: 10.1002/mrm.20701. [DOI] [PubMed] [Google Scholar]
- 27.Koblas T, Girman P, Berkova Z, Jirak D, Kriz J, Dovolilova E, Zacharovova K, Hajek M, Saudek F. Magnetic resonance imaging of intrahepatically transplanted islets using paramagnetic beads. Transplant Proc. 2005;37(8):3493–3495. doi: 10.1016/j.transproceed.2005.09.142. [DOI] [PubMed] [Google Scholar]
- 28.de Vries IJ, Lesterhuis WJ, Barentsz JO, Verdijk P, van Krieken JH, Boerman OC, Oyen WJ, Bonenkamp JJ, Boezeman JB, Adema GJ, Bulte JW, Scheenen TW, Punt CJ, Heerschap A, Figdor CG. Magnetic resonance tracking of dendritic cells in melanoma patients for monitoring of cellular therapy. Nat Biotechnol. 2005;23(11):1407–1413. doi: 10.1038/nbt1154. [DOI] [PubMed] [Google Scholar]
- 29.Zhu J, Zhou L, XingWu F. Tracking neural stem cells in patients with brain trauma. New Engl J Med. 2006;355(22):2376–2378. doi: 10.1056/NEJMc055304. [DOI] [PubMed] [Google Scholar]
- 30.Wakabayashi T, Tamura M, Nakamura T. Partial liquid ventilation with low-dose perfluorochemical and high-frequency oscillation improves oxygenation and lung compliance in a rabbit model of surfactant depletion. Biol Neonate. 2006;89(3):177–182. doi: 10.1159/000088874. [DOI] [PubMed] [Google Scholar]
- 31.Schutt EG, Klein DH, Mattrey RM, Riess JG. Injectable micro-bubbles as contrast agents for diagnostic ultrasound imaging: the key role of perfluorochemicals. Angew Chem Int Edn Engl. 2003;42(28):3218–3235. doi: 10.1002/anie.200200550. [DOI] [PubMed] [Google Scholar]
- 32.Ramachandran S, Desai NM, Goers TA, Benshoff N, Olack B, Shenoy S, Jendrisak MD, Chapman WC, Mohanakumar T. Improved islet yields from pancreas preserved in perflurocarbon is via inhibition of apoptosis mediated by mitochondrial pathway. Am J Transplant. 2006;6(7):1696–1703. doi: 10.1111/j.1600-6143.2006.01368.x. [DOI] [PubMed] [Google Scholar]
- 33.Ricordi C, Fraker C, Szust J, Al-Abdullah I, Poggioli R, Kirlew T, Khan A, Alejandro R. Improved human islet isolation outcome from marginal donors following addition of oxygenated perfluorocarbon to the cold-storage solution. Transplantation. 2003;75(9):1524–1527. doi: 10.1097/01.TP.0000058813.95063.7A. [DOI] [PubMed] [Google Scholar]
- 34.Brandhorst D, Iken M, Brendel MD, Bretzel RG, Brandhorst H. Long-term preservation of the pig pancreas by a one-layer method for successful islet isolation. Transplant Proc. 2005;37(1):229–230. doi: 10.1016/j.transproceed.2004.12.058. [DOI] [PubMed] [Google Scholar]
- 35.Takahashi T, Tanioka Y, Matsuda T, Toyama H, Kakinoki K, Li S, Hiraoka K, Fijino Y, Suzuki Y, Kuroda Y. Impact of the two-layer method on the quality of isolated pancreatic islets. Hepatogastroenterology. 2006;53(68):179–182. [PubMed] [Google Scholar]
- 36.Bergert H, Knoch KP, Meisterfeld R, Jager M, Ouwendijk J, Kersting S, Saeger HD, Solimena M. Effect of oxygenated perfluorocarbons on isolated rat pancreatic islets in culture. Cell Transplant. 2005;14(7):441–448. doi: 10.3727/000000005783982873. [DOI] [PubMed] [Google Scholar]
- 37.Barnett BP, Arepally A, Karmarkar PV, Qian D, Gilson WD, Walczak P, Howland V, Lawler L, Lauzon C, Stuber M, Kraitchman DL, Bulte JW. Magnetic resonance-guided, real-time targeted delivery and imaging of magnetocapsules immunoprotecting pancreatic islet cells. Nature Med. 2007;13(8):986–991. doi: 10.1038/nm1581. [DOI] [PubMed] [Google Scholar]
- 38.Karmarkar PV, Kraitchman DL, Izbudak I, Hofmann LV, Amado LC, Fritzges D, Young R, Pittenger M, Bulte JW, Atalar E. MR-trackable intramyocardial injection catheter. Magn Reson Med. 2004;51(6):1163–1172. doi: 10.1002/mrm.20086. [DOI] [PubMed] [Google Scholar]
- 39.Dick AJ, Guttman MA, Raman VK, Peters DC, Pessanha BS, Hill JM, Smith S, Scott G, McVeigh ER, Lederman RJ. Magnetic resonance fluoroscopy allows targeted delivery of mesenchymal stem cells to infarct borders in swine. Circulation. 2003;108(23):2899–2904. doi: 10.1161/01.CIR.0000095790.28368.F9. [DOI] [PMC free article] [PubMed] [Google Scholar]
- 40.Fahrig R, Heit G, Wen Z, Daniel BL, Butts K, Pelc NJ. First use of a truly-hybrid X-ray/MR imaging system for guidance of brain biopsy. Acta Neurochir (Wien) 2003;145(11):995–997. doi: 10.1007/s00701-003-0138-7. discussion 997. [DOI] [PubMed] [Google Scholar]
- 41.Ganguly A, Wen Z, Daniel BL, Butts K, Kee ST, Rieke V, Do HM, Pelc NJ, Fahrig R. Truly hybrid X-ray/MR imaging: toward a streamlined clinical system. Acad Radiol. 2005;12(9):1167–1177. doi: 10.1016/j.acra.2005.03.076. [DOI] [PubMed] [Google Scholar]
- 42.Neubauer AM, Sim H, Winter PM, Caruthers SD, Williams TA, Robertson JD, Sept D, Lanza GM, Wickline SA. Nanoparticle pharmacokinetic profiling in vivo using magnetic resonance imaging. Magn Reson Med. 2008;60(6):1353–1361. doi: 10.1002/mrm.21795. [DOI] [PMC free article] [PubMed] [Google Scholar]