

Abstract
Hyperpolarized (hp) 131Xe with up to 2.2% spin polarization (i.e., 5000-fold signal enhancement at 9.4 T) was obtained after separation from the rubidium vapor of the spin-exchange optical pumping (SEOP) process. The SEOP was applied for several minutes in a stopped-flow mode, and the fast, quadrupolar-driven T1 relaxation of this spin I = 3/2 noble gas isotope required a rapid subsequent rubidium removal and swift transfer into the high magnetic field region for NMR detection. Because of the xenon density dependent 131Xe quadrupolar relaxation in the gas phase, the SEOP polarization build-up exhibits an even more pronounced dependence on xenon partial pressure than that observed in 129Xe SEOP. 131Xe is the only stable noble gas isotope with a positive gyromagnetic ratio and shows therefore a different relative phase between hp signal and thermal signal compared to all other noble gases. The gas phase 131Xe NMR spectrum displays a surface and magnetic field dependent quadrupolar splitting that was found to have additional gas pressure and gas composition dependence. The splitting was reduced by the presence of water vapor that presumably influences xenon-surface interactions. The hp 131Xe spectrum shows differential line broadening, suggesting the presence of strong adsorption sites. Beyond hp 131Xe NMR spectroscopy studies, a general equation for the high temperature, thermal spin polarization, P, for spin nuclei is presented.
Keywords: 131Xe, Xenon-131, Xe-131, Hyperpolarization, Hyperpolarized, Noble gases, Spin polarization, Spin-exchange optical pumping, Nuclear electric quadrupole moment, Quadrupolar relaxation, 129Xe, Nuclear magnetic resonance, Xenon-129, Krypton-83, 83Kr
1. Introduction
In contrast to the extensive body of literature reporting nuclear magnetic resonance (NMR) studies with the spin I = 1/2 isotope 129Xe (110.5 MHz resonance frequency at 9.4 T, 26.4% natural abundance) [1–14], the only other NMR active stable isotope of this noble gas, 131Xe, has attracted much less attention since its first reported NMR observation in 1954 [15]. The 131Xe isotope (32.8 MHz resonance frequency at 9.4 T, 21.2% natural abundance) has a spin I = 3/2 and thus possesses a nuclear electric quadrupole moment (Q = −11.4 fm2) [16]. The electric quadrupole moment of the 131Xe nucleus is susceptible to interactions with electric field gradients (EFGs) and therefore serves as a sensitive probe for environmentally induced distortions of its large surrounding electron cloud [14]. Unless high concentrations of paramagnetic substances are present, these quadrupolar interactions are the dominant cause of 131Xe nuclear spin relaxation in all phases. Further, 131Xe coherent quadrupolar interactions can be induced when the xenon atoms are contained within an anisotropic environment.
1.1. 131Xe quadrupolar relaxation in solids, liquids and dissolved phase
In solid, natural abundance xenon, Warren and Norberg [17,18] found that 131Xe had a very short longitudinal relaxation time of T1 ≈ 200 ms at temperatures close to the melting point (161 K). However, the T1 increased monotonically by more than three orders of magnitude with decreasing temperature and reached T1 = 390 s at 9 K. The relaxation times in liquid xenon show the opposite trend compared to the solid and increase from T1 ≈ 40 ms at 161 K to T1 ≈ 80 ms at 250 K and 3 MPa. Later work [19] determined T1 = 110 ms at conditions just below the critical point, i.e. 298 K and 5.8 MPa. The 131Xe relaxation behavior of xenon dissolved in various solvents was subject to experimental and computational studies in the past (see [20] for a review). Longitudinal relaxation in polar solvents is quite fast (T1 < 10 ms) due to the electric field gradient fluctuations induced by the solvent molecule dipoles. Even in non-polar solvents, the 131Xe T1 relaxation times are typically below 50 ms.
1.2. 131Xe quadrupolar relaxation the gas phase
In gas phase, it was theoretically predicted by Staub and later confirmed experimentally by Brinkmann et al. [21] that the 131Xe longitudinal relaxation time (T1) is inversely proportional to the gas density, ρ, with
| (1) |
1 amagat is the density of the specific gas at standard pressure and temperature of 101.325 kPa and 273.15 K. For xenon the atomic number density of one amagat is reported with 2.7048 × 1025 m−3 [22]. (Note that in literature the amagat is often alternatively defined as the density of an ideal gas at standard pressure and temperature resulting to the slightly different value of 2.6868 × 1025 m−3.) Brinkmann’s result was obtained at a temperature of 298 K and 0.76 T magnetic field strength. In later theoretical work, Adrian [23], considered separately the relaxation dependence on van der Waals and exchange contributions during binary collisions. He obtained for the gas at room temperature but also noted a temperature dependence of the 131Xe relaxation. From these equations, a 131Xe gas-phase relaxation time of T1 ≈ 22–25 s would be expected at ambient pressure (∼1 amagat). However the equations above do not take into account 131Xe interactions with the surrounding container walls that accelerate the apparent gas-phase relaxation. The earlier works also do not consider relaxation caused by the formation of Xe–131Xe van der Waals complexes that leads to a gas density independent relaxation term [24–27] at the field strengths and gas pressures used in this work.
1.3. 131Xe quadrupolar coherence
Like the longitudinal relaxation, the spectral features observed in 131Xe NMR are dominated by this isotope’s high nuclear spin and large nuclear quadrupole moment. If 131Xe is placed in an anisotropic environment, for instance when dissolved in a liquid crystal, a triplet is observed in the NMR spectrum that displays resonance line splittings in the kHz regime. The triplet in liquid crystalline phase is caused by interactions of the nuclear quadrupole moment with the electric field gradient (EFG) induced by the anisotropic solvent (see [28] for a review). Even the surfaces of macroscopic containers can cause a 131Xe quadrupolar splitting that can be detected in the gas phase. This splitting was originally observed in spin-exchange optical pumping experiments at low magnetic fields of a few mG (see below) [29–35]. However, the effect of surface orientation and temperature on the gas phase 131Xe quadrupolar splitting can also be observed in thermally polarized high-field NMR spectroscopy [36,37].
1.4. Magnetic field induced 131Xe quadrupolar splitting
Another unique property of 131Xe is that a quadrupolar splitting pattern of a few Hz can also be generated in the bulk gas phase, independent of the presence of surfaces [19]. The effect is caused by high magnetic fields, , that generate an electric field gradient (EFG) in atoms located within this field. The EFG is a result of interactions of the external magnetic field with the magnetization of the xenon electron cloud. The EFG tensor orientation is always aligned with , thus leading to a quadrupolar splitting, reminiscent of the much stronger splittings in liquid crystals. As was shown previously with thermally polarized 131Xe [19], this “high-field’ quadrupolar splitting displays a quadratic dependence upon . Theoretical papers following the initial experimental observation agree with the quadratic magnetic field dependence of the splitting, but disagreed about the presence of an additional linear term [38,39]. At current, a magnetic field dependent splitting has only been observed with the noble gas isotope 131Xe, due to its unique combination of a large and easily distortable electron cloud, spherical symmetry of the unbound noble gas atoms, ‘high resolution grade’ NMR linewidth in the gas phase, and its large nuclear electric quadrupole moment at a relatively small spin I = 3/2 value.
1.5. 131Xe in materials
Quadrupolar interactions are highly sensitive to anisotropy of the local environment and solution-phase thermally polarized 131Xe NMR spectroscopy has been used to probe a variety of systems including liquid crystals contained in microchannels [40], bicelles [41], and macromolecules [42]. 131Xe NMR spectroscopy has even been applied to characterize xenon compounds [43,44]. Spectroscopic 131Xe studies of surfaces have also been performed at low temperatures [45] and in variety of porous materials [46–50]. Thermally polarized 131Xe magnetic resonance imaging (MRI) with liquefied xenon provided a contrast sensitive to surface adsorbed water in aerogels [51].
Unfortunately, the low gyromagnetic ratio and often kHz-broad linewidths of 131Xe lead to exceedingly small NMR signal-to-noise ratios when thermally polarized gas is used. As a result, the surface-specific insights provided by this isotope have primarily been confined to extremely high surface to volume ratio environments that generate rapid T1 relaxation or systems that can withstand xenon at high pressures. In contrast, the relatively long relaxation times observed in the gas phase and in the presence of low surface to volume materials make thermally polarized 131Xe NMR unpractical, in particular at low gas densities.
However, these conditions are ideal for studies employing hyperpolarized (hp) 131Xe that provides orders of magnitude of signal enhancement but also requires long relaxation times in order to preserve the hyperpolarization. Systems with longitudinal 131Xe relaxation times substantially shorter than T1 = 1 s do not permit meaningful applications of hyperpolarized 131Xe NMR, unless interfaces of theses systems to the bulk gas phase were to be studied.
1.6. Hyperpolarized (hp) 131Xe
Like all NMR active noble gas isotopes, high non-equilibrium nuclear spin polarization can be generated in gaseous 131Xe through alkali metal vapor spin-exchange optical pumping (SEOP) [52,53]. The fundamental details of hp 131Xe production have been explored in some detail by Volk [29,54], Happer [30–32], Pines [33], Mehring [34], and their respective co-workers. Luo et al. have also studied 131Xe SEOP using cesium in high magnetic fields at 11.7 T [55]. Optically detected NMR experiments using SEOP were applied in the past to study the influence of the glass container surfaces on the gas-phase hp 131Xe relaxation and were used to investigate xenon adsorption phenomena on glass surfaces [29–35]. The shape of macroscopic containers with centimeter-sized dimensions was found to cause an anisotropy in the effective electric field gradient that can lead to a small quadrupolar splitting, typically in the Hz regime or less. Following earlier work with 201Hg and 83Kr [56,57], the 131Xe splitting was observed at low magnetic fields in the gas phase contained in cylindrical cells [29–35]. The splitting was strongly dependent on the aspect ratio of the cell dimensions and the cell orientation within the magnetic field. However, this type of splitting was averaged out in cells with spherical symmetry if macroscopic gas diffusion allowed the xenon atoms to sample surface segments with different orientations during the relevant NMR timescale. In an intriguing experiment, Mehring and co-workers used optical detection of the hp 131Xe quadrupolar splitting in a rotating glass cell to construct a gyroscope that utilized geometric quantum-phase [58–60] (see Refs. [61,62] for further theoretical work). More recently, Kitching and co-workers studied the crossover regime between pure nuclear quadrupolar resonance and quadrupolar perturbed Zeeman effect at low magnetic field strengths [63] using optically detected hp 131Xe.
Previously, the hyperpolarized 131Xe was never separated form the reactive alkali metal vapor, thus limiting its application to non-reactive systems. The work presented here is concerned with the production of alkali metal free hp 131Xe and the peculiarities of 131Xe SEOP are explored. Transfer of the resulting hp 131Xe into high magnetic field NMR detectors enabled the study of the effects of gas composition and density on the spectral features and longitudinal relaxation of 131Xe. Additionally, the absence of alkali metal in the hp gas mixture was exploited to investigate the influence of surface adsorbed water vapor upon the 131Xe quadrupolar splitting and surface induced longitudinal relaxation. Finally, a general treatment of polarization and signal intensity observed hyperpolarized spin I > 1/2 nuclei is provided.
2. Experimental
2.1. Spin-exchange optical pumping (SEOP)
SEOP was carried out in a cylindrical Pyrex glass cell (length = 125 mm, inner diameter = 27 mm) containing 1–2 g of rubidium (99.75%; Alfa Aesar, Ward Hill, MA). The Pyrex glass cell was used without treatment of the internal glass surface due to fast quadrupolar relaxation of 131Xe on silane coated surfaces [31,64]. The highest spin polarization for 131Xe was obtained when the front end of the cell was kept at approximately 453 K while a temperature of 393 K proved to be best for 129Xe. The temperature was maintained through a flow of hot air that was temperature regulated by a controller monitoring the front of the SEOP cell that was approximately 5 K hotter than the back end of the cell. Illumination through the front window of the SEOP cell was provided by two 30 W COHERENT (Santa Clara, CA) continuous wave diode array solid-state lasers. Each laser delivered 20 W of 794.7 nm circularly polarized light after losses in the fiber optics and polarizing optics.
The duration of the stopped-flow SEOP was typically 5–10 min. This time period was longer than needed for the SEOP process itself but was required for equilibrium rubidium vapor pressure to recover after the shuttling procedure. The gas pressure in the pumping cell ranged from 120 kPa to 460 kPa, depending on the desired final pressure in the NMR detection cell. For the SEOP build-up experiments and for the relaxation measurements a pressure of 150 kPa was used. Hp gas was rapidly transferred into the NMR probe by pre-evacuating the detection cell to less than 0.1 kPa. The SEOP cell was then opened, and the gas pressures in the SEOP cell and the detection cell were allowed to equalize. Rubidium vapor was separated from the hp gas by an air-cooled filter, containing loosely packed glass wool located inside the transfer line between the pumping cell and the detection cell. The magnetic field necessary for optical pumping was provided either by the fringe field of the superconducting magnet (0.05 T for 9.4 T, 0.004 T for 11.7 T, and 0.04 T for 14.1 T) or by a Helmholtz coil pair (2.0 × 10⁻³ T).
2.2. Gas mixtures
Three gas mixtures used in this work were composed of naturally abundant, research grade gases provided by Airgas (Radnor, PA), with purities of 99.995% for Xe, 99.9997% for N2, and 99.9999% for He. The gas mixtures used in this study were 5% Xe, 5% N2, and 90% He (mixture I); 20% Xe, 5% N2, and 75% He (mixture II); and 93% Xe and 7% N2 (mixture III).
2.3. NMR measurements
High resolution 131Xe spectra were obtained at 11.7 T and 14.1 T, using a Varian INOVA 500 MHz spectrometer and a Chemagnetics Infinity 600 MHz spectrometer, respectively. Commercial 10 mm broadband probes tuned to 131Xe frequency at either field strength (41.23 MHz and 49.47 MHz at 11.7 T and 14.1 T, respectively) were used. The length of a π/2 pulse was 24.5 μs at 11.7 T and 35 μs at 14.1 T. The gas samples were shimmed using an external D2O standard for the field lock channel. The D2O was located between the walls of the outer tube (10.0 mm outer diameter, 9.1 mm inner diameter; Wilmad-LabGlass, Vineland, NJ) and a hp gas containing inner detection tube (custom-built medium wall NMR 8 mm outer diameter, 6 mm inner diameter, for 11.7 T; 5 mm outer diameter, 4.2 mm inner diameter for 14.1 T; Wilmad-LabGlass, Vineland, NJ).
Polarization build-up and relaxation data were collected at 9.4 T using a Chemagnetics CMX II 400 MHz spectrometer and a custom built probe tuned to the 131Xe frequency at 32.81 MHz. The length of π/2 pulse was 35 μs. A 15 mm outer diameter, 12.6 mm inner diameter Pyrex glass sample tube was used as sample holder. No resistive magnetic field shimming was provided because resolved quadrupolar lineshapes were not required for these experiments. T1 measurements were performed using a series of 16 equally spaced, medium flip angle (12.3°) radiofrequency (RF) pulses to probe the hp 131Xe polarization decay as a function of time.
To collect polarization build-up curves, SEOP cell conditions such as temperature, pressure, and illumination were initially maintained in the absence of magnetic field for 5–10 min to ensure that no non-equilibrium polarization was present. The magnetic field was then turned on for a period of time, tp, after which the hp 131Xe was delivered via pressure-equalization into the previously evacuated detection cell, and signal was acquired using a π/2 pulse. The signal enhancements for hp 131Xe were referenced to the thermal signal obtained from a sample containing only 810 kPa of natural abundance 131Xe. The applied 15 s recycle delay was sufficient to restore the full polarization after each pulse because the pure gas-phase relaxation time T1 for 131Xe at 810 kPa, obtained through Eq. (1), is approximately 3 s and is further reduced by interactions with the glass container wall and the formation of van der Waals complexes.
2.4. Co-adsorbing water experiments
For the addition of co-adsorbing water vapor, a vessel filled with 10 ml of liquid water and 3.1 kPa of water vapor was connected to the shuttle system. After the shuttling system was evacuated following the SEOP procedure described in Section 2.1, the water vessel was opened and allowed the system to be filled with water vapor. The vessel was then closed again and delivery of hp 131Xe gas was carried out on top of the approximate 3.1 kPa water vapor (see Fig. 1 for details).
Fig. 1.

Experimental setup for production and delivery of hp 131Xe. Following polarization build-up in the SEOP cell and evacuation of the detection cell, the hp gas valve was opened briefly (with the release valve open and all other valves closed) to release some un-polarized xenon gas from the cold trap region of the pump cell that was not illuminated by the laser. After removal of un-polarized gas, the hp 131Xe was then shuttled into the sample cell for detection (hp gas and sample cell valve open, all other valves closed). After detection the vacuum valve was opened (hp gas valve closed) to re-evacuate the detection cell to less than 0.1 kPa. Air-cooled glass wool used to aid in the separation of Rb from the hp gases is not shown but was located in the transfer line near the detection region. Attached to the delivery line between the SEOP cell and the detection cell was a vessel containing only water liquid and H2O vapor. The water vapor was transferred into the detection cell for selected experiments as described in the main text. D2O shown in the sample region was used for shimming and locking for selected experiments.
2.5. Data analysis
T1 values for hp 131Xe were calculated by nonlinear least-squares fitting of the 131Xe signal intensity as a function of time and number of applied medium flip angle radio frequency pulses. Since each data point in T1 measurements was an average of four replicate measurements, the errors reported in this work were calculated as standard deviations. Quadrupolar splittings, 2νQ, and linewidths were obtained from 131Xe NMR spectra after deconvolution by multi-peak fitting routine using Lorentzian functions. Data analysis and simulations of the polarization curves were performed using Igor Pro, Version 6.11 from Wavemetrics, OR, USA.
3. Results and discussion
3.1. Separation of hp 131Xe from Rb vapor
As detailed in the introduction, spin-exchange optical pumping of 131Xe has been explored previously, but these studies focused exclusively on phenomena within the SEOP cells. Although the separation of hp 3He, hp 129Xe (both spin I = 1/2) [5,65,66], and more recently hp 83Kr (I = 9/2) [64,67–69] from the SEOP alkali metal vapor is well developed, the separation of the hp 131Xe from the alkali metal vapor has never been reported. The major obstacle for producing alkali metal free hp 131Xe are the large nuclear electric quadrupole interactions found with this isotope. Quadrupolar interactions caused by binary gas-phase collisions [21,26], the formation of gas-phase van der Waals complexes, [24–27], and brief periods of adsorption on surfaces [68] lead to fast longitudinal relaxation that diminishes the level of hyperpolarization. In contrast to 129Xe, which has a T1 time on the order of hours at ambient pressure and temperature [70], a T1 time below 5 s was observed in this work for gas-phase hp 131Xe at a pressure of 120 kPa (using mixture III (93% Xe) at 9.4 T in a 12.6 mm inner diameter glass cell). This value is much shorter than the value of T1 ≈ 23 s that was expected from the pure gas-phase relaxation given by Eq. (1) [21] because of the relatively large surface to volume ratio in the NMR detection tubes and because of relaxation contributions arising from van der Waals complexes. This fast longitudinal relaxation makes the production and work with hp 131Xe more problematic than with hp 83Kr, that exhibits T1 times of around 150 s under similar conditions [25,26]. Despite the larger nuclear electric quadrupole moment of 83Kr (Q = 25.9 fm2) compared to 131Xe (Q = −11.4 fm2) [16], the xenon isotope typically experiences faster quadrupolar driven relaxation under similar conditions due to it’s larger and more easily distortable electron cloud and its smaller nuclear spin value.
Because the T1 for 131Xe in the solid phase is extremely short (at 77 K a T1 slightly above 1 s was observed [17]), freezing the hp-noble gas at liquid nitrogen temperatures – a method frequently used for 129Xe separation from the SEOP buffer gases 4He and N2 [71,72] – would completely destroy the non-equilibrium 131Xe polarization. Therefore, cryogenic hp 131Xe concentration was not used for any of the experiments described in this work. Rather, the stopped-flow delivery method [64,67–69] depicted in Fig. 1 was applied to efficiently separate the Rb vapor, while avoiding strong depolarization during the gas transfer. The hp 131Xe was shuttled after 5–10 min of SEOP through transfer tubing to the pre-evacuated detection cell through pressure-equalization as described in Section 2. Fig. 2 shows the first high field hp 131Xe NMR spectrum obtained through stopped-flow SEOP and subsequent rubidium vapor separation.
Fig. 2.

Gas phase NMR spectra collected at 11.7 T of 129Xe (A and B) and 131Xe (C and D). Also indicated are the associated energy levels at thermal, high temperature equilibrium (A and C) and after optical pumping using the transition Δm = −1 (B and D). (A) 129Xe NMR spectrum of xenon at 400 kPa (partial pressure) of pure xenon and 100 kPa (partial pressure) oxygen using 250 transients. (B) Hyperpolarized 129Xe NMR spectrum with 10 kPa (partial pressure) xenon from a 200 kPa, 5% xenon gas mixture after a single stopped-flow delivery. Note that the scale of (A) is threefold enlarged compared to (B) in this figure. (C) Thermal 131Xe NMR spectrum after 1260 transients with a partial pressure of 93 kPa of xenon from a 100 kPa, 93% xenon gas mixture and (D) hyperpolarized 131Xe NMR spectrum after a single stopped-flow delivery using 10 kPa xenon partial pressure of a 200 kPa, 5% xenon gas mixture. The scale of (D) is 10-fold enlarged compared to (C). All hyperpolarized spectra are collected with one transient. When correcting for xenon partial pressures and number of transients, enhancements of 33,000 (corresponding to 37% spin polarization) and 1500 (i.e. 0.8% spin polarization) were achieved for 129Xe and 131Xe, respectively. Note, that up to 2.2% 131Xe spin polarization was obtained in later experiments shown in Fig. 4. The differences in the relative phase are due to the positive gyromagnetic ratio of 131Xe, as discussed in Section 3.3. All spectra were recorded using xenon with natural abundance isotope distribution.
3.2. Linewidth of the 131Xe triplet
The spectra of 131Xe and 129Xe obtained from thermally polarized and hyperpolarized (hp) samples are depicted in Fig. 2. The remarkable appearance of a 131Xe triplet in the gas phase is discussed in the introduction and in more detail examined below (see Section 3.6).
The observed linewidth for the 131Xe center transition was 0.3 Hz and was approximately constant (deviations < 0.1 Hz) for all the pressures and gas compositions used in this work. A sixfold broader linewidth of 1.8 Hz was observed for the 129Xe spectra. A 3.4-fold linewidth ratio is expected from the difference in the gyromagnetic ratios γ for the two xenon isotopes if spectral line broadening is dominated by the magnetic field inhomogeneity. Quadrupolar interactions were likely to be responsible for the observed 131Xe differential line broadening between the 131Xe center transition and the satellite transitions. Unlike the center transition, the linewidth of the 131Xe satellite transitions increased with increasing pressure. The satellite transitions shown in Fig. 2D displayed 0.8 Hz and 0.6 Hz linewidths, respectively at higher and lower ppm values.
Differential line broadening can be produced by different relaxation rates for the satellite transition compared to the center transition [73]. However, this would require that the extreme narrowing condition (τcω0)2 ≪ 1 is violated and thus requires long correlation times for 131Xe at magnetic fields of 9.4–14 T. The duration of binary, gas-phase collisions is on the order of a few picoseconds, and short-lived Xe–Xe van der Waals molecules have life times of around 10−10 s at 1 amagat xenon density [27]. Similarly, the correlation times resulting from surface adsorption are dictated by the average adsorption time, τa. The value of τa for xenon atoms on glass surfaces at 300 K can be estimated to be ∼10−10 s from the expression τa = τ0exp(−E/kBT), where E = 0.12 eV is the desorption activation energy xenon on borosilicate glasses [34] and assuming τ0 = 10−12 s. Although none of the correlation times associated with these events are long enough to cause biexponential relaxation, it is possible however that strong xenon adsorption sites are present on the Pyrex surface. The prolonged correlation times at these locations may lead to a violation of the extreme narrowing condition and thus to differential line broadening.
An additional hint for surface interactions as the source for the satellite broadening is the differential broadening between the two satellite transitions. Such differential broadening may be the result of paramagnetic – quadrupolar cross correlation that was observed recently by Jerschow and co-workers by 23Na NMR in the presence of paramagnetic contrast agents [74]. The only source for paramagnetism in the sample used for the spectra in Fig. 2 was on the Pyrex surface [75]. Other causes for differential line broadening may be CSA-quadrupolar cross-correlation effects during prolonged surface adsorption. Alternatively, the lineshape may be inhomogeneously broadened by differences in EFG experienced by the xenon atoms in various parts of the container that were not averaged by gas diffusion at the gas pressures used. Although the precise mechanism of the satellite broadening remains speculative thus far, it likely originated from interactions with the Pyrex surface that were scaled down by exchange with the gas phase where the NMR signal was observed. A ‘scaling down’ of surface effects also takes place for quadrupolar splitting that is on the order of 6 MHz on a Pyrex surface [35] but that is observed as a few Hz splitting in the gas phase.
3.3. Relative phase and the sign of γ
Another distinctive feature shown in Fig. 2 is that thermally polarized 131Xe and hyperpolarized 131Xe signals were 180° out of phase with respect to each other while both 129Xe spectra possessed the same phase. This observation warrants a more detailed explanation. 131Xe is unique among the stable (i.e., non-radioactive) noble gas isotopes because it is the only isotope with a positive gyromagnetic ratio γ. Therefore, according to Em = −γmzℏB0, the energy level Em with the highest possible positive z-quantum number, mz = +3/2, constitutes the ground state for 131Xe. Vice versa, 3He, 21Ne, 83Kr and 129Xe have negative gyromagnetic ratios, and the respective ground state is the one with the most negative mz quantum number. The sign of γ determines the sign of the coherence generated by a 90° pulse () and thus can be important in magnetization transfer or coherence transfer NMR experiments. However the appearance of single-pulse NMR spectra is typically not affected by the sign of γ except for a 180° phase difference that is difficult to detect between nuclei with different resonance frequencies. This is different in SEOP experiments since the relative sign of γ determines how the energy levels are pumped when using either σ− or σ+ circular polarized light. Therefore, it has consequences even for the outcome of a one-pulse NMR experiments, because the negative γ affects the spin population before the radiofrequency-pulse is applied.
This effect is depicted in Fig. 2 where the energy levels and the spin population are sketched for the two isotopes. In SEOP the sign of Δm in the nuclear spin transitions depends only on the choice of either σ− or σ+ circular polarized light for the pumping process and is independent of the sign of γ. Although the sign of γ does not affect Δm itself, it still has consequences on the population of the energy levels. For 129Xe, the optical pumping transition Δm = −1 pumps the higher energy spin state (mz = +1/2) down to the lower energy spin state (mz = −1/2) and thereby causes a reduction in the spin-temperature. In contrast, the same optical pumping transition, Δm = −1, pumps low energy spin states in the 131Xe system into higher energy spin states leading to an inverted spin population distribution. The phase difference between the thermally polarized spectrum and the hp-spectrum of either isotope is straightforward to compare: when Δm = −1 optical pumping was applied, no phase difference was observed for 129Xe whereas a 180° relative phase shift was observed for 131Xe.
3.4. Polarization of spin I ⩾ 1/2 nuclei
At high temperature thermal equilibrium (T ≫ |γ|ℏB0/kB), the polarization P of a macroscopic ensemble of separate spins I can be described by
| (2) |
The maximum possible signal enhancement over the thermal equilibrium at a given field strength and temperature, , is the inverse of the polarization P, assuming ‘Boltzmann-type’ population distribution in the hyperpolarized state. As detailed in the Appendix and demonstrated in Fig. 3, this is true for any temperature or polarization P even if Eq. (2) is no longer valid. Fig. 3 shows the thermal polarization P obtained through Eq. (A2) [or calculated through Eqs. (A8), (A4), and (A9)] at 9.4 T field strength as a function of the spin temperature T for all stable, NMR active noble gas isotopes. Remarkably, the spin temperature dependence of the polarization P is almost identical for all three quadrupolar noble gas isotopes. This is not surprising in the case of 131Xe and 21Ne since both isotopes have the same spin and similar gyromagnetic ratios. However, in the case of 83Kr the effect of the smaller gyromagnetic ratio (compared to 131Xe and 21Ne) is compensated by its higher (I = 9/2) spin. For comparison, the behavior of a fictitious spin I = 3/2 isotope with the same gyromagnetic ratio as 83Kr is also shown in Fig. 3.
Fig. 3.

Thermal equilibrium polarization P of spin active noble gas isotopes and a fictitious Kr isotope with spin I = 3/2 obtained from Eq. (A2). (A) Thermal equilibrium polarization curves as a function of temperature displayed at temperatures up to 0.05 K. (B) Semi-logarithmic plot of thermal equilibrium polarization curves as a function of temperature extended out to 3 K. To reach 1% polarization for hyperpolarized samples at 300 K and 9.4 T, the following enhancements are needed when compared to thermally polarized samples for each nuclei: 410 for 3He; 1121 for 129Xe; 2373 for 21Ne; 2206 for 83Kr; 2270 for 131Xe; and 4855 for the fictitious isotope with spin I = 3/2 and the same gyromagnetic ratio as 83Kr. For the three quadrupolar isotopes (21Ne, 83Kr, 131Xe) nearly identical polarization curves arise.
The thermal polarization for 131Xe at 9.4 T magnetic field strength and 300 K is and therefore a signal enhancement of times the thermal equilibrium signal at 9.4 T and 300 K corresponds to 100% polarization. For comparison, the thermal polarization for 83Kr is (), and for 129Xe is ().
3.5. Polarization build-up of 131Xe
Using the stopped-flow optical pumping method, 131Xe signal enhancements on the order of 5000 times greater than thermal signal at B0 = 9.4 T, 150 kPa, and 297 K were achieved (i.e. approximately 2.2% spin polarization) when mixture I was used. The 131Xe polarization build-up reached a steady-state relatively quickly compared to other noble gas isotopes (3He, 129Xe and, 83Kr – at similar SEOP conditions). The time dependence for the hp 131Xe polarization build-up is shown in Fig. 4 for the three different mixtures (5%, 20% and 93% Xe) under 40 W of σ− circularly polarized 794.7 nm laser light. To monitor the 131Xe polarization build-up, the magnetic field at the SEOP cell was initially switched off, while the cell was maintained under constant laser illumination at a constant temperature (453 K) and pressure (150 kPa) for 5–10 min. This procedure produced a ‘starting point’ at stable SEOP conditions but with no hyperpolarized 131Xe present and allowed for regeneration of the rubidium vapor after the shuttling procedure. The magnetic field of a pair of Helmholtz coils was then turned on for incremented time period, tp, after which the hp 131Xe was transferred to the sample cell where it was detected. The polarization value was obtained from the hp 131Xe signal intensities through comparison to the thermal signal of 131Xe described in the experimental section.
Fig. 4.
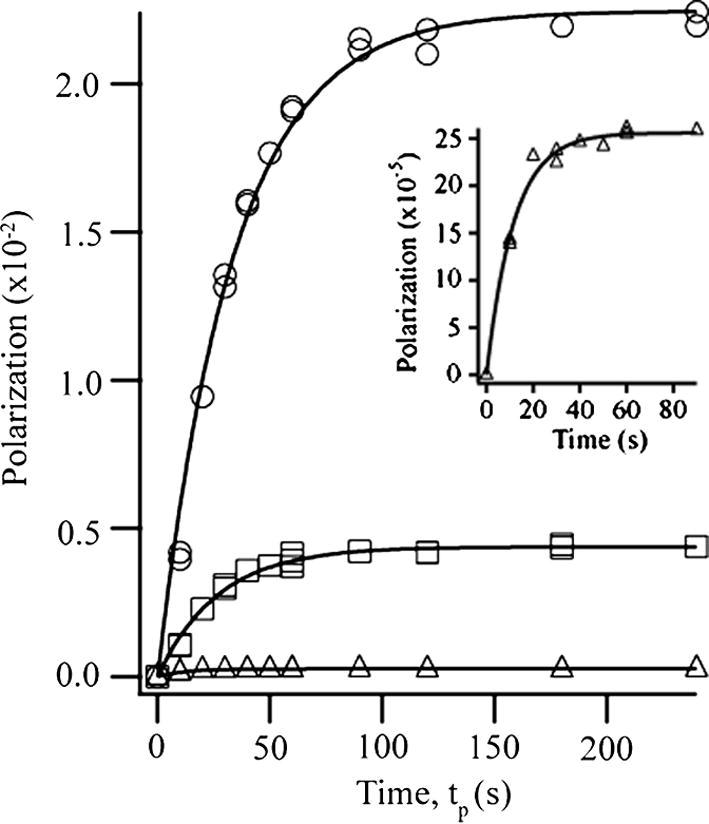
Build-up of hp 131Xe spin polarization P as a function of SEOP time, tp, at 2 × 10⁻³ T. Optical pumping was carried out for mixtures I (5% Xe, open circle), II (20% Xe, open square), and III (93% Xe, open triangle) under 40 W laser illumination in a pair of Helmholtz coils. Data were collected at 9.4 T after a stopped-flow delivery cycle of duration tp. Inset: magnification of short-time polarization build-up for mixture III. The curves are fits of the data to Eq. (4), and the fitting parameter, A lead to the following maximum polarization P values: mixture I, 2.24 ± 0.03%: mixture II, 0.438 ± 0.007%; and mixture III 0.0256 ± 0.0005%.Values for the rate constant B are: mixture I, 0.030 ± 0.001 s−1; mixture II, 0.037 ± 0.002 s−1; mixture III, 0.085 ± 0.006 s−1.
The time dependent build-up of hyperpolarization is described as [72]:
| (3) |
where γse is the Rb–Xe spin exchange rate and Γ = 1/T1 is the quadrupolar driven fast self-relaxation rate of 131Xe. The destruction of Rb spin polarization by collisions with inert gas atoms is described by the sum of the products of the rate constants, , with their corresponding gas atom number densities [Mi]. The optical pumping rate per Rb atom, γop, depends on experimental parameters such as laser power, SEOP cell design, and SEOP temperature that were kept constant for all build-up experiments reported here. However only a reduced form of Eq. (3) was used for fitting of the experimental data since γse and Γ were unknown under the SEOP conditions used in this work:
| (4) |
The lower the xenon concentration used in the gas mixture, the larger was the resulting pre-exponential parameter A. The steady-state polarization (i.e. at infinite long SEOP times) determined through A was 2.24 ± 0.03 for mixture I (5% xenon), 0.438 ± 0.007 for mixture II (20% xenon), and 0.0256 ± 0.0005 for mixture III (93% xenon). The ratios between the values obtained for A were 1:0.20:0.011 for mixture I, II, and III respectively. A strong polarization dependence on the xenon density [Xe] is expected from Eq. (3) and from the large rubidium depolarization rate constant for xenon [72,76]. The strong polarization dependence on [Xe] is well known for 129Xe SEOP, however the approximately 100-fold reduction of the 131Xe polarization between mixtures I to III exceeds significantly the effect previously observed with SEOP of the spin I = 1/2 isotope [77]. If the xenon self relaxation Γ is omitted in Eq. (3) and if one neglects the effects of nitrogen and helium (note that ) [72,76], the steady-state polarization reached after long SEOP times is described by . For , the dependence upon the xenon density is .
This proportionality describes approximately the observations of previous work with 129Xe SEOP [77], where the same laser and similar SEOP cells had been used under continuous flow conditions. It was found that exceeds γop by about one order of magnitude. For the mixtures I, II and III one would therefore expect a ratio for A of 1:0.25:0.054, i.e. an approximately 20-fold reduction in polarization between I and III. The 100-fold reduction found with 131Xe suggest that, in contrast to 129Xe, the relaxation rate constant Γ in Eq. (3) cannot be neglected for 131Xe in mixture III. The term γse/(γse + Γ) contributes roughly with a factor of five to the polarization difference between mixtures III and I, while it contributes relatively little to the polarization difference between mixtures II and I.
The value for Γ can be estimated from Eq. (1) and increases approximately 18 times from 0.18 × 10⁻² s−1, to 0.72 × 10⁻² s−1, and to 3.3 × 10⁻² s−1 for mixture I, II and III respectively, at the xenon density found at 150 kPa total pressure and 453 K SEOP temperature. However, the contributions from the other gases to the 131Xe relaxation are neglected. Previous work with hp 83Kr spectroscopy [26] has shown that other inert gases contribute quite substantially to the observed relaxation, but the estimate made above is probably reasonable for mixture III due to its high xenon concentration. There are however further problems: Eq. (1) is valid for T = 298 K only [23] and in addition the relaxation will be affected by the wall relaxation and by van der Waals complexes in the gas phase [25]. Nevertheless, the values above, in particular for mixture III, will be used for some further considerations.
The spin exchange rate γse is a function of xenon density dependent term and a xenon density independent term [78]:
| (5) |
were the rate constant γRbXe describes xenon spin exchange during Rb–Xe van der Waals complexes and 〈σv〉 is the spin exchange cross section for binary collisions. The precise values of γRbXe and 〈σv〉 are uncertain for 131Xe under the SEOP conditions used in this work. However, Eq. (5) states that γse is reduced with increasing xenon density until it assumes the form γse = [Rb]〈σv〉, while Eq. (1) states that Γ increases with increasing xenon density. As stated above, the term γse/(γse + Γ) in Eq. (3) does not seem to contribute substantially to the polarization change between mixtures I and II but contributes with a fivefold reduction in the expected polarization between mixture I and III. It can be concluded that Γ > γse at xenon partial pressures somewhere above 30 kPa (i.e. mixture II at 150 kPa total pressure).
Based on the observations and assumptions made above, one can conclude that for mixture III γse/(γse + Γ) ≈ 0.2 and hence Γ ≈ 4γse. From the fitting parameter B = γse + Γ that was determined as (8.5 ± 0.6) × 10−2 s−1 for mixture III one can conclude that γse ≈ 1.7 × 10⁻² s−1 and estimate Γ ≈ 6.8 × 10⁻² s−1 for the 93% xenon mixture. This Γ value is about twice as large as the rate constant expected form Eq. (1). However, an increase of the 131Xe T1 relaxation by a factor of two due to surface contributions and van der Waals complexes in the pump cell is not unreasonable, as can be illustrated by the following estimate: In the Section 3.1 a 131Xe T1 ≈ 5 s in the 12.6 mm inner diameter NMR tube was found. From the simplified expression one obtains T1(surface)−1 ≈ 16 × 10−2 s−1 for this NMR tube neglecting contributions from van der Waals complexes. This value is too high but the relaxation time due to surface interactions scales directly with the surface to volume ratio [64] and the (uncoated) pump cell has a 27 mm inner diameter leading to T1(surface)−1 ≈ 8 × 10⁻² s−1 – a value close to that for Γ found above. In addition, the 131Xe surface contribution to the relaxation is expected to be further reduced by the elevated temperature [67] and by the presence of rubidium metal [32].
In summary, 131Xe polarization is strongly dependent on the xenon density, most significantly due to rubidium depolarization. However, the 131Xe polarization is further affected by the xenon density dependent quadrupolar relaxation. The consequences of the combined effects is that high density SEOP is even more inefficient for 131Xe than for 129Xe. This inefficiency is illustrated in Fig. 5 where a distinct decrease in optical pumping efficiency was observed in mixture II and mixture III as the pressure was increased. At 100 kPa pressure used for these experiments only 0.03% polarization was generated with mixture III, and the signal was barely observable at higher pressures. However, at the lowest xenon concentration (mixture I), the applied pressure had a negligible effect on the SEOP conditions. The likely source for the pressure independence was that the polarization diminishing effect at increasing pressure was compensated by the competing effect of the increasing SEOP efficiency due to improvement of γop that can be caused by the broadening of the rubidium adsorption linewidth [72,76,77].
Fig. 5.

Collection of hp 131Xe gas phase NMR spectra at various gas compositions (i.e. xenon partial pressures) and total gas pressures. Hp 131Xe gas was contained in an 8 mm (6.5 mm inner diameter) plain NMR tube at 11.7 T field strength and 289 K. Magnification factors, total pressure (Ptot), partial pressure of xenon (PXe) and quadrupolar splitting (2νQ) are presented beside each spectrum. Spectra with identical xenon concentration are grouped within a row. For each row, the total pressure increases from the left to the right.
3.6. Influence of pressure and concentration on quadrupolar splitting of 131Xe
A dependence of the quadrupolar splitting on both the total pressure of the sample and the gas composition was observed with hp 131Xe at 11.7 T. In Fig. 5 the hp 131Xe spectra are shown for mixtures I and II (5% and 20% xenon, respectively) with pressures ranging from 100 to 400 kPa and for mixture III (93% xenon) with pressures ranging from 25 to 100 kPa. Hp spectra for mixture III at pressures higher than 100 kPa were not recorded due to the low spin polarization obtained at these conditions.
The quadrupolar splitting varies from the smallest observed value of 2.40 Hz at 400 kPa in mixture II to the largest value of 3.05 Hz at 100 kPa of mixture I. The quadrupolar splitting of 131Xe observed in mixture I decreased slightly over the pressure range of 100–400 kPa. At 100 kPa the quadrupolar splitting is 3.05 Hz and it decreased to 2.71 Hz at 400 kPa, a change of 0.34 Hz. Mixture II showed a greater decrease in quadrupolar splitting than was observed in mixture I over the same pressure range. The quadrupolar splitting was 3.00 Hz at 100 kPa and 2.40 Hz at 400 kPa, for an overall change of 0.60 Hz, almost double the change observed in mixture I. The quadrupolar splitting observed in mixture III decreased from 2.91 Hz at 25 kPa to 2.54 Hz at 100 kPa, a change of 0.37 Hz over the pressure range.
A pressure dependence of the 131Xe quadrupolar splitting was predicted in earlier work considering much lower xenon densities, in particular with respect to the xenon free path length and the xenon diffusion, that are not applicable at the pressures used in this work [31]. Later experimental work found no influence of the nitrogen buffer gas partial pressure between 2.6 kPa and 32 kPa on the 131Xe quadrupolar splitting [32]. The pressure dependence of the 131Xe spectra observed in Fig. 5 may have been caused by changes in quadrupolar splitting arising from the interactions with the glass surface. Noble gases at ambient temperature will exhibit a very low surface coverage rate θ that is dependent on xenon density [Xe] as described by the Henry isotherm. This would predict a constant θ/[Xe] and hence alternating xenon densities should not have affected the splitting observed in the gas phase. However, this picture would change in the presence of strong xenon adsorption sites caused by defects on the surface that may experience xenon coverage rates close to saturation at the pressure used in this work. The relative contribution of these sites to the observed quadrupolar splitting would be reduced with increasing pressure. As noted above, the presence of strong adsorption sites also may be a possible explanation of the observed differential line broadening.
3.7. The effect of H2O vapor on 131Xe relaxation and quadrupolar splitting
The addition of co-adsorbing molecules was used to demonstrate that the gas phase quadrupolar splitting is indeed influenced by changing surface interactions. The 131Xe quadrupolar splitting observed at 14.1 T in a 5 mm NMR tube at 100 kPa and 290 K without the presence of water vapor was 5.24 Hz as shown in Fig. 6A. Upon the addition of 3.1 kPa of water vapor as described in the experimental section, the splitting was reduced to 4.46 Hz as shown in Fig. 6B. The effect of the water vapor was completely reversible as demonstrated by evacuating the NMR tube and flushing with dry nitrogen at least three times. Following this treatment, quadrupolar splittings within 0.2 Hz of the values obtained prior to addition of water vapor were observed.
Fig. 6.

Hp 131Xe NMR spectra collected from a 5 mm (4.1 mm inner diameter) plain NMR tube (A) in the absence of water vapor and (B) with 3.1 kPa of H2O. Both spectra were collected at a pressure of 100 kPa of mixture I (5% xenon) at 14.1 T with 131Xe frequency of 49.47 Hz. (A) The measured quadrupolar splitting was 5.24 Hz. (B) The measured quadrupolar splitting was 4.46 Hz under conditions identical to (A) except for the admission of water vapor (3.1 kPa) prior to hp 131Xe delivery.
The reduced surface interactions of xenon in the presence of water vapor also affects the 131Xe relaxation times. It was previously shown that the adsorption of water onto an aerogel surface changes the 131Xe spin–spin (T2) relaxation, an effect that was used for surface sensitive MRI contrast with liquefied xenon [51]. In the current work, a T1 relaxation time increase in the presence of water vapor was found using gas-phase hp 131Xe contained in a Pyrex container. The three gas mixtures (I, II, and III) were optically pumped and spin–lattice relaxation times for each mixture were collected in a 15 mm outer diameter Pyrex sample tube at a field strength of 9.4 T and a temperature of 290 K. These data are presented in Table 1 and demonstrated the reduced 131Xe relaxation in the presence of water vapor with a relaxation time of T1 = 14.0 ± 0.2 s that was increased by about 40% compared to the dry gas mixture with T1 = 9.9 ± 0.1 s. The effect of water vapor on 83Kr relaxation was previously demonstrated to have a similar tendency as was observed with 131Xe in this work [67,69].
Table 1.
T1 values for 131Xe with various gas compositions measured for three different concentrations of xenon, nitrogen and helium at 140 kPa and 9.4 T. The column labeled ‘Hydrated glass tube’ refers to the experiment with water vapor as co-adsorbing molecules. The values reported are the mean and standard deviation of four replicate T1 measurements.
| Dehydrated | Dehydrated | Dehydrated | Hydrated |
|---|---|---|---|
| Glass tube | Glass tube | Glass tube | Glass tube |
| 5% Xe | 20% Xe | 93% Xe | 20% Xe |
| 19.3 ± 0.3 s | 9.9 ± 0.1 s | 4.7 ± 0.1 s | 14.0 ± 0.2 s |
4. Conclusion
Alkali metal vapor free hp 131Xe was generated with a signal enhancement up of 5000 times the thermal equilibrium polarization at 9.4 T field strength and ambient temperatures for dilute xenon mixture. The maximum 131Xe enhancement obtained in this work corresponded to 2.2% spin polarization. Like in spin I = 1/2 systems, the polarization of hp-noble gases with spin I > 1/2 can be calculated by simple multiplication of the thermal high temperature polarization with the enhancement factor of the hp signal over the thermal high temperature NMR signal. A general equation was derived (Eq. (2), see Appendix for details) to describe the thermal spin polarization P at high temperatures for nuclei with any spin I value. Because of its positive gyromagnetic ratio, unique for 131Xe among all stable noble gas isotopes, the relative phase difference between thermal signal and hp signal is 180° opposite to that of any other noble gas isotope.
The time dependence of the polarization build-up accelerated, and the maximum polarization value decreased, with increasing xenon partial pressure. Because of xenon partial pressure dependent quadrupolar relaxation, this effect is more pronounced at higher xenon density for 131Xe SEOP than for 129Xe SEOP. The obtained hp 131Xe signals displayed a quadrupolar splitting that is known to be magnetic field – and surface interaction dependent. In this work, an additional xenon partial pressure dependence upon the splitting was found. A possible explanation may be the effects arising from strong adsorption sites on the surface that may also be responsible for the observed differential line broadening between center and satellite transitions. Finally, alkali metal vapor free hp 131Xe allowed for experiments with co-adsorbing water molecules on the surface. It was found that the presence of water vapor significantly reduces the observed 131Xe quadrupolar splitting and prolongs the 131Xe T1 relaxation times.
The quadrupolar splitting in the gas phase is uniquely observed thus far with 131Xe NMR spectroscopy. The disagreement in earlier theoretical work makes the experimental study of the magnetic field dependent contribution to the quadrupolar splitting important. The investigation of this effect is complicated by surface interactions and by the newly found xenon partial pressure dependence of the quadrupolar splitting. Hp 131Xe may provide better insights into the surface relaxation processes including those that produce higher rank tensor elements [48] and that may interfere with the observed coherent processes [37,48].
The fast 131Xe T1 relaxation in porous media makes widespread applications of hp 131Xe NMR spectroscopy and imaging unlikely. However, hp 131Xe may help to provide insights into another probe system, i.e. hp 83Kr (I = 9/2), that has recently been explored as a new MRI contrast agent with potential applications for pulmonary studies [68,69,79,80]. Finally, hp 131Xe can be used to study xenon van der Waals complex formation in the gas phase that are also important for hp 129Xe. Such processes are difficult to study with 129Xe because of its extremely slow relaxation [27]. Pure gas phase 131Xe faster relaxation times (on the order of tens of seconds) will allow for thorough studies of various pressures and mixtures.
Acknowledgments
The authors would like to thank Clifford Russell Bowers for stimulating discussions, Michael D. Olsen and Elden G. Burk for sample preparation and construction of experimental apparatus. We also thank Gary E. Maciel and Chris D. Rithner for time on their respective spectrometers used for this work. This material is based upon work supported by the National Science Foundation under Grant No. CHE-0719423 and by the Medical Research Council under Grant No. G0900785.
Appendix A
A general definition of the nuclear spin polarization P is given by Wenckebach [81]:
| (A1) |
which is written here in slightly different form where is the spin operator, is the Planck constant h/2π, and ρ is the normalized density matrix. The polarization P in Eq. (A1) is obtained from the magnetization |Mz| normalized through its maximum possible value of at the theoretical limit of T = 0 K.
Eq. (A1) is rewritten as:
| (A2) |
with mz as the z-quantum number of spin I, γ as the gyromagnetic ratio, ℏ as the Planck constant h/2π, and kB as the Boltzman constant.
For a temperature T ≫ |γ|ℏB0/kB, the polarization simplifies to:
| (A3) |
The polarization P of a thermally polarized spin system can be readily be calculated using Eq. (A3) that transforms into the well-known equation for spin I = 1/2 systems. However, the definition of polarization P is only useful if P is linearly dependent upon the observed signal intensity at any temperature. For instance, this is not the case if one defines the spin polarization of a spin I > 1 systems through the sum of the population differences between two adjacent energy levels [80].
The signal intensity caused by thermal polarization (i.e. Boltzmann polarization) of the sample at temperature T and magnetic field B0 is determined by:
| (A4) |
Note that Eq. (A4) describes total integrated signal intensity – i.e. obtained from the sum of all integrated peaks if a spitting is present. Eq. (A4) is allowed to dependent on the sign of the gyromagnetic ratio in order to accommodate the absolute phase of the signal. The transition matrix elements,
| (A5) |
are obtained from
| (A6) |
All contributions to the signal intensity other than γ, B0, and the populations of the various quantum states are combined in the coefficient A. At ambient temperatures (i.e. T ≫ |γ|ℏB0/kB), Eq. (A4) can be simplified to:
| (A7) |
where the intensity has been allowed once again to be phase sensitive to the sign of γ. Using the signal intensity from Eqs. (A4), (A7), the maximum enhancement can be defined as:
| (A8) |
where is the maximum possible (thermal) signal intensity expected at T = 0 K (phase sensitive):
| (A9) |
Using the Eqs. (A7)–(A9), the maximum enhancement factor from hyperpolarization (assuming a non-thermal equilibrium, but still Boltzmann type of population distribution) compared to a thermal signal at ambient temperature is [80]:
| (A10) |
The maximum enhancement factor in Eq. (A10) is the inverse of the polarization P at high temperatures given in Eq. (A3). Further, in Eq. (A8) (inserting Eqs. (A4) and (A9)) is the inverse to the polarization P in Eq. (A2) at any temperature. As a practical consequence, the polarization P of any NMR active hyperpolarized system can be calculated from the polarization of the thermally polarized system using Eq. (A3) multiplied with the enhancement factor of the hp signal over the thermal signal.
References
- 1.Jameson C.J., Jameson A.K., Cohen S.M. Temperature and density dependence of Xe-129 chemical-shift in xenon gas. J. Chem. Phys. 1973;59:4540–4546. [Google Scholar]
- 2.Ito T., Fraissard J. Xe-129 NMR-study of xenon adsorbed on Y zeolites. J. Chem. Phys. 1982;76:5225–5229. [Google Scholar]
- 3.Ripmeester J.A., Davidson D.W. Xe-129 nuclear magnetic-resonance in the clathrate hydrate of xenon. J. Mol. Struct. 1981;75:67–72. [Google Scholar]
- 4.Dybowski C., Bansal N., Duncan T.M. NMR-spectroscopy of xenon in confined spaces – clathrates, intercalates, and zeolites. Annu. Rev. Phys. Chem. 1991;42:433–464. [Google Scholar]
- 5.Raftery D., Long H., Meersmann T., Grandinetti P.J., Reven L., Pines A. High-field NMR of adsorbed xenon polarized by laser pumping. Phys. Rev. Lett. 1991;66:584–587. doi: 10.1103/PhysRevLett.66.584. [DOI] [PubMed] [Google Scholar]
- 6.Barrie P.J., Klinowski J. 129Xe NMR as a probe for the study of microporous solids: a critical review. Prog. Nucl. Magn. Reson. Spectrosc. 1992;24:91–108. [Google Scholar]
- 7.Ratcliffe C.I. Xenon NMR. Annu. Rep. NMR Spectrosc. 1998;36:123–221. [Google Scholar]
- 8.Springuel-Huet M.A., Bonardet J.L., Gedeon A., Fraissard J. Xe-129 NMR overview of xenon physisorbed in porous solids. Magn. Reson. Chem. 1999;37:S1–S13. [Google Scholar]
- 9.Moudrakovski I.L., Breeze S.R., Simard B., Ratcliffe C.I., Ripmeester J.A., Seideman T., Tse J.S., Santyr G. Gas-phase nuclear magnetic relaxation in Xe-129 revisited. J. Chem. Phys. 2001;114:2173–2181. [Google Scholar]
- 10.Goodson B.M. Nuclear magnetic resonance of laser-polarized noble gases in molecules, materials, and organisms. J. Magn. Reson. 2002;155:157–216. doi: 10.1006/jmre.2001.2341. [DOI] [PubMed] [Google Scholar]
- 11.K. Bartik, P. Choquet, A. Constantinesco, G. Duhamel, J. Fraissard, J.N. Hyacinthe, J. Jokisaari, E. Locci, T.J. Lowery, M. Luhmer, T. Meersmann, I.L. Moudrakovski, G.E. Pavlovskaya, K.L. Pierce, A. Pines, J.A. Ripmeester, V.V. Telkki, and W.S. Veeman, Xenon NMR as a Probe for Microporous and Mesoporous Solids, Polymers, Liquid Crystals, Solutions, Flames, Proteins, Imaging, Actualite Chimique, 2005, pp. 16–34.
- 12.Raftery D. Xenon NMR spectroscopy. Annu. Rep. NMR Spectrosc. 2006;57:205–271. [Google Scholar]
- 13.Ruiz E.J., Sears D.N., Pines A., Jameson C.J. Diastereomeric Xe chemical shifts in tethered cryptophane cages. J. Am. Chem. Soc. 2006;128:16980–16988. doi: 10.1021/ja066661z. [DOI] [PubMed] [Google Scholar]
- 14.Hanni M., Lantto P., Vaara J. Pairwise additivity in the nuclear magnetic resonance interactions of atomic xenon. Phys. Chem. Chem. Phys. 2009;11:2485–2496. doi: 10.1039/b821907a. [DOI] [PubMed] [Google Scholar]
- 15.Brun E., Oeser J., Staub H.H., Telschow C.G. The nuclear magnetic moments of Xe-129 and Xe-131. Phys. Rev. 1954;93:904. [Google Scholar]
- 16.Kello V., Pyykko P., Sadlej A.J. Nuclear quadrupole moments of Kr and Xe from molecular data. Chem. Phys. Lett. 2001;346:155–159. [Google Scholar]
- 17.Warren W.W., Norberg R.E. Nuclear quadrupole relaxation and chemical shift of Xe131 in liquid and solid xenon. Phys. Rev. 1966;148:402–412. [Google Scholar]
- 18.Warren W.W., Norberg R.E. Multiple-pulse nuclear-magnetic-resonance transients of Xe129 and Xe131in solid xenon. Phys. Rev. 1967;154:277–286. [Google Scholar]
- 19.Meersmann T., Haake M. Magnetic field dependent xenon-131 quadrupolar splitting in gas and liquid phase NMR. Phys. Rev. Lett. 1998;81:1211–1214. [Google Scholar]
- 20.Luhmer M., Reisse J. Quadrupole NMR relaxation of the noble gases dissolved in simple liquids and solutions – a critical review of experimental data in the light of computer simulation results. Prog. Nucl. Magn. Reson. Spectrosc. 1998;33:57–76. [Google Scholar]
- 21.Brinkmann D., Brun E., Staub H.H. Kernresonanz Im Gasformigen Xenon. Helvetica Physica Acta. 1962;35:431–436. [Google Scholar]
- 22.Michels A., Wassenaar T., Wolkers G.J., Dawson J. Thermodynamic properties of xenon as a function of density up to 520 amagat and as a function of pressure up to 2800 atmospheres, at temperatures between 0 °C and 150 °C. Physica. 1956;22:17–28. [Google Scholar]
- 23.Adrian F.J. Quadrupolar relaxation of Xe131 in xenon gas. Phys. Rev. 1965;138:A403–A409. [Google Scholar]
- 24.Chann B., Nelson I.A., Anderson L.W., Driehuys B., Walker T.G. Xe-129–Xe molecular spin relaxation. Phys. Rev. Lett. 2002;88:113201. doi: 10.1103/PhysRevLett.88.113201. [DOI] [PubMed] [Google Scholar]
- 25.Cleveland Z.I., Meersmann T. Density-independent contributions to longitudinal relaxation in Kr-83. ChemPhysChem. 2008;9:1375–1379. doi: 10.1002/cphc.200800134. [DOI] [PubMed] [Google Scholar]
- 26.Cleveland Z.I., Meersmann T. Binary-collision-induced longitudinal relaxation in gas-phase Kr-83. J. Chem. Phys. 2008;129:244304. doi: 10.1063/1.3029663. [DOI] [PubMed] [Google Scholar]
- 27.Berry-Pusey B.N., Anger B.C., Laicher G., Saam B. Nuclear spin relaxation of Xe-129 due to persistent xenon dimers. Phys. Rev. A. 2006;74:063408. [Google Scholar]
- 28.Jokisaari J. NMR of noble-gases dissolved in isotropic and anisotropic liquids. Prog. Nucl. Magn. Reson. Spectrosc. 1994;26:1–26. [Google Scholar]
- 29.Kwon T.M., Mark J.G., Volk C.H. Quadrupole nuclear-spin relaxation of Xe-131 in the presence of rubidium vapor. Phys. Rev. A. 1981;24:1894–1903. [Google Scholar]
- 30.Wu Z., Happer W., Daniels J.M. Coherent nuclear-spin interaction of adsorbed 131Xe gas with surfaces. Phys. Rev. Lett. 1987;59:1480–1483. doi: 10.1103/PhysRevLett.59.1480. [DOI] [PubMed] [Google Scholar]
- 31.Wu Z., Schaefer S., Cates G.D., Happer W. Coherent interactions of polarized nuclear spins of gaseous atoms with container walls. Phys. Rev. A. 1988;37:1161–1175. doi: 10.1103/physreva.37.1161. [DOI] [PubMed] [Google Scholar]
- 32.Wu Z., Happer W., Kitano M., Daniels J. Experimental studies of wall interactions of adsorbed spin-polarized Xe-131 nuclei. Phys. Rev. A. 1990;42:2774–2784. doi: 10.1103/physreva.42.2774. [DOI] [PubMed] [Google Scholar]
- 33.Raftery D., Long H.W., Shykind D., Grandinetti P.J., Pines A. Multiple-pulse nuclear-magnetic-resonance of optically pumped xenon in a low magnetic-field. Phys. Rev. A. 1994;50:567–574. doi: 10.1103/physreva.50.567. [DOI] [PubMed] [Google Scholar]
- 34.Butscher R., Wäckerle G., Mehring M. Nuclear quadrupole interaction of highly polarized gas phase 131Xe with a glass surface. J. Chem. Phys. 1994;100:6923–6933. [Google Scholar]
- 35.Butscher R., Wackerle G., Mehring M. Nuclear-quadrupole interaction of highly polarized gas-phase Xe-131 with a glass-surface. J. Chem. Phys. 1995;102:8681. (vol. 100, p. 6923, 1994) [Google Scholar]
- 36.Meersmann T., Smith S.A., Bodenhausen G. Multiple-quantum filtered xenon-131 NMR as a surface probe. Phys. Rev. Lett. 1998;80:1398–1401. [Google Scholar]
- 37.Deschamps M., Burghardt I., Derouet C., Bodenhausen G., Belkic D. Nuclear magnetic resonance study of xenon-131 interacting with surfaces: effective Liouvillian and spectral analysis. J. Chem. Phys. 2000;113:1630–1640. [Google Scholar]
- 38.Salsbury J.F.R., Harris R.A. The origin of the magnetic-field dependent quadrupolar splitting. J. Chem. Phys. 1998;109:8338–8341. [Google Scholar]
- 39.Vaara J., Pyykko P. Magnetic-field-induced quadrupole splitting in gaseous and liquid Xe-131 NMR: quadratic and quartic field dependence. Phys. Rev. Lett. 2001;86:3268–3271. doi: 10.1103/PhysRevLett.86.3268. [DOI] [PubMed] [Google Scholar]
- 40.Long H.W., Luzar M., Gaede H.C., Larsen R.G., Kritzenberger J., Pines A., Crawford G.P. Xenon NMR-study of a nematic liquid-crystal confined to cylindrical submicron cavities. J. Phys. Chem. 1995;99:11989–11993. [Google Scholar]
- 41.Li X.X., Newberry C., Saha I., Nikolaou P., Whiting N., Goodson B.M. Interactions between xenon and phospholipid bicelles studied by H-2/Xe-129/Xe-131 NMR and optical pumping of nuclear spins. Chem. Phys. Lett. 2006;419:233–239. [Google Scholar]
- 42.Saba G., Casu M., Lai A. Application of quadrupolar Xe-131-NMR relaxation to the study of macromolecular systems. Int. J. Quantum Chem. 1996;59:343–348. [Google Scholar]
- 43.Gerken M., Schrobilgen G.J. Solution multi-NMR and Raman spectroscopic studies of thermodynamically unstable XeO4. The first Xe-131 NMR study of a chemically bound xenon species. Inorg. Chem. 2002;41:198–204. doi: 10.1021/ic010627y. [DOI] [PubMed] [Google Scholar]
- 44.Forgeron M.A.M., Wasylishen R.E., Gerken M., Schrobilgen G.J. Solid-state Xe-129 and Xe-131 NMR study of the perxenate anion Inorg. Chem. 2007;46:3585–3592. doi: 10.1021/ic0624524. [DOI] [PubMed] [Google Scholar]
- 45.Cho G., Moran L.B., Yesinowski J.P. Xe-129 and Xe-131 NMR of xenon on silica surfaces at 77 K. Appl. Magn. Reson. 1995;8:549–572. [Google Scholar]
- 46.Millot Y., Man P.P., Springuel-Huet M.A., Fraissard J. Quantification of electric-field gradient in the supercage of Y zeolites by comparing the chemicl shifts of Xe-131 (I = 3/2) NMR. Studies Surf. Sci. Catal. 2001;135:354. [Google Scholar]
- 47.Moudrakovski I.L., Ratcliffe C.I., Ripmeester J.A. Xe-131, a new NMR probe of void space in solids. J. Am. Chem. Soc. 2001;123:2066–2067. doi: 10.1021/ja0035248. [DOI] [PubMed] [Google Scholar]
- 48.Meersmann T., Deschamps M., Bodenhausen G. Probing aerogels by multiple quantum filtered Xe-131 NMR spectroscopy. J. Am. Chem. Soc. 2001;123:941–945. doi: 10.1021/ja002747v. [DOI] [PubMed] [Google Scholar]
- 49.Millot Y., Man P.P., Springuel-Huet M., Fraissard J. Quantification of electric-field gradients in the supercage of HY, steam-dealuminated Y and lanthanum-exchanged Y zeolites by 129Xe and 131Xe NMR of physisorbed xenon gas. Studies Surf. Sci. Catal. 2004;154:1400–1406. [Google Scholar]
- 50.Clewett C.F.M., Pietrass T. Xe-129 and Xe-131 NMR of gas adsorption on single- and multi-walled carbon nanotubes. J. Phys. Chem. B. 2005;109:17907–17912. doi: 10.1021/jp052475o. [DOI] [PubMed] [Google Scholar]
- 51.Pavlovskaya G., Blue A.K., Gibbs S.J., Haake M., Cros F., Malier L., Meersmann T. Xenon-131 surface sensitive imaging of aerogels in liquid xenon near the critical point. J. Magn. Reson. 1999;137:258–264. doi: 10.1006/jmre.1998.1688. [DOI] [PubMed] [Google Scholar]
- 52.Happer W. Optical-pumping. Rev. Mod. Phys. 1972;44:169–249. [Google Scholar]
- 53.Walker T.G., Happer W. Spin-exchange optical pumping of noble-gas nuclei. Rev. Mod. Phys. 1997;69:629–642. [Google Scholar]
- 54.Volk C.H., Kwon T.M., Mark J.G., Kim Y.B., Woo J.C. Measurement of the Rb–Xe-131 spin-exchange cross-section in Xe-131 relaxation studies. Phys. Rev. Lett. 1980;44:136–139. [Google Scholar]
- 55.Luo J., Mao X., Chen J., Wang S., Zhao M., Fu L., Zeng X. Frequency-selective laser optical pumping and spin exchange of cesium with Xe-129 and Xe-131 in a high magnetic field. Appl. Magn. Reson. 1999;17:587–595. [Google Scholar]
- 56.Simpson J.H. NMR frequency splitting of Hg-201 signals due to collisions with a fused silica surface. Bull. Am. Phys. Soc. 1978;23:394–395. [Google Scholar]
- 57.Volk C.H., Mark J.G., Grover B.C. Spin dephasing of Kr-83. Phys. Rev. A. 1979;20:2381–2388. [Google Scholar]
- 58.Appelt S., Wackerle G., Mehring M. Deviation from Berry adiabatic geometric phase in a Xe-131 nuclear gyroscope. Phys. Rev. Lett. 1994;72:3921–3924. doi: 10.1103/PhysRevLett.72.3921. [DOI] [PubMed] [Google Scholar]
- 59.Appelt S., Wackerle G., Mehring M. A magnetic-resonance study of nonadiabatic evolution of spin quantum states. Z. Phys. D: At., Mol. Clusters. 1995;34:75–85. [Google Scholar]
- 60.Wackerle G., Appelt S., Mehring M. Spin-polarized noble gases: a playground for geometric quantum-phase studies in magnetic resonance. Nucl. Instrum. Methods Phys. Res., Sect. A. 1998;402:464–472. [Google Scholar]
- 61.Jones J.A., Pines A. Berry dephasing due to diffusion in nuclear quadrupole resonance. Chem. Phys. Lett. 1995;247:215–220. [Google Scholar]
- 62.Jones J.A., Pines A. Geometric dephasing in zero-field magnetic resonance. J. Chem. Phys. 1997;106:3007–3016. [Google Scholar]
- 63.Donley E.A., Long J.L., Liebisch T.C., Hodby E.R., Fisher T.A., Kitching J. Nuclear quadrupole resonances in compact vapor cells: the crossover between the NMR and the nuclear quadrupole resonance interaction regimes. Phys. Rev. A. 2009;79:013420. [Google Scholar]
- 64.Stupic K.F., Cleveland Z.I., Pavlovskaya G.E., Meersmann T. Quadrupolar relaxation of hyperpolarized krypton-83 as a probe for surfaces. Solid State Nucl. Magn. Reson. 2006;29:79–84. doi: 10.1016/j.ssnmr.2005.08.008. [DOI] [PubMed] [Google Scholar]
- 65.Albert M.S., Cates G.D., Driehuys B., Happer W., Saam B., Springer C.S., Wishnia A. Biological magnetic-resonance-imaging using laser polarized Xe-129. Nature. 1994;370:199–201. doi: 10.1038/370199a0. [DOI] [PubMed] [Google Scholar]
- 66.Middleton H., Black R.D., Saam B., Cates G.D., Cofer G.P., Guenther R., Happer W., Hedlund L.W., Johnson G.A., Juvan K., Swartz J. MR-imaging with hyperpolarized He-3 gas. Mag. Reson. Med. 1995;33:271–275. doi: 10.1002/mrm.1910330219. [DOI] [PubMed] [Google Scholar]
- 67.Cleveland Z.I., Pavlovskaya G.E., Stupic K.F., LeNoir C.F., Meersmann T. Exploring hyperpolarized 83Kr by remotely detected NMR relaxometry. J. Chem. Phys. 2006;124:044312. doi: 10.1063/1.2159493. [DOI] [PubMed] [Google Scholar]
- 68.Pavlovskaya G.E., Cleveland Z.I., Stupic K.F., Meersmann T. Hyperpolarized krypton-83 as a new contrast agent for magnetic resonance imaging. Proc. Natl. Acad. Sci. U. S. A. 2005;102:18275–18279. doi: 10.1073/pnas.0509419102. [DOI] [PMC free article] [PubMed] [Google Scholar]
- 69.Cleveland Z.I., Stupic K.F., Pavlovskaya G.E., Repine J.E., Wooten J.B., Meersmann T. Hyperpolarized 83Kr and 129Xe NMR relaxation measurements of hydrated surfaces: implications for materials science and pulmonary diagnostics. J. Am. Chem. Soc. 2007;129:1784–1792. doi: 10.1021/ja065994t. [DOI] [PubMed] [Google Scholar]
- 70.Zeng X., Miron E., Vanwijngaarden W.A., Schreiber D., Happer W. Wall relaxation of spin polarized Xe-129 nuclei. Phys. Lett. A. 1983;96:191–194. [Google Scholar]
- 71.Cates G.D., Benton D.R., Gatzke M., Happer W., Hasson K.C., Newbury N.R. Laser production of large nuclear-spin polarization in frozen xenon. Phys. Rev. Lett. 1990;65:2591–2594. doi: 10.1103/PhysRevLett.65.2591. [DOI] [PubMed] [Google Scholar]
- 72.Driehuys B., Cates G.D., Miron E., Sauer K., Walter D.K., Happer W. High-volume production of laser-polarized Xe-129. Appl. Phys. Lett. 1996;69:1668–1670. [Google Scholar]
- 73.Jaccard G., Wimperis S., Bodenhausen G. Multiple quantum NMR spectroscopy of S = 3/2 spins in isotropic phase: a new probe for multiexponential relaxation. J. Chem. Phys. 1986;85:6282–6293. [Google Scholar]
- 74.Ling W., Jerschow A. Relaxation-allowed nuclear magnetic resonance transitions by interference between the quadrupolar coupling and the paramagnetic interaction. J. Chem. Phys. 2007;126:064502. doi: 10.1063/1.2435343. [DOI] [PubMed] [Google Scholar]
- 75.Schmiedeskamp J., Heil W., Otten E.W., Kremer R.K., Simon A., Zimmer J. Paramagnetic relaxation of spin polarized He-3 at bare glass surfaces Part I. Eur. Phys. J. D. 2006;38:427–438. [Google Scholar]
- 76.Wagshul M.E., Chupp T.E. Laser optical-pumping of high-density Rb in polarized He-3 targets. Phys. Rev. A. 1994;49:3854–3869. doi: 10.1103/physreva.49.3854. [DOI] [PubMed] [Google Scholar]
- 77.Mortuza M.G., Anala S., Pavlovskaya G.E., Dieken T.J., Meersmann T. Spin-exchange optical pumping of high-density xenon-129. J. Chem. Phys. 2003;118:1581–1584. [Google Scholar]
- 78.Cates G.D., Fitzgerald R.J., Barton A.S., Bogorad P., Gatzke M., Newbury N.R., Saam B. Rb Xe-129 spin-exchange rates due to binary and 3-body collisions at high Xe pressures. Phys. Rev. A. 1992;45:4631–4639. doi: 10.1103/physreva.45.4631. [DOI] [PubMed] [Google Scholar]
- 79.Cleveland Z.I., Pavlovskaya G.E., Stupic K.F., Wooten J.B., Repine J.E., Meersmann T. Detection of tobacco smoke deposition by hyperpolarized krypton-83 MRI. Magn. Reson. Imaging. 2008;26:270–278. doi: 10.1016/j.mri.2007.06.009. [DOI] [PubMed] [Google Scholar]
- 80.Cleveland Z.I., Pavlovskaya G.E., Elkins N.D., Stupic K.F., Repine J.E., Meersmann T. Hyperpolarized Kr-83 MRI of lungs. J. Magn. Reson. 2008;195:232–237. doi: 10.1016/j.jmr.2008.09.020. [DOI] [PubMed] [Google Scholar]
- 81.Wenckebach W.T. The solid effect. Appl. Magn. Reson. 2008;34:227–235. [Google Scholar]