Abstract
The role of electric fields in important biological processes like binding and catalysis has been studied almost exclusively by computational methods. Experimental measurements of the local electric field in macromolecules are possible using suitably calibrated vibrational probes. Here we demonstrate that the vibrational transitions of phosphate groups are highly sensitive to an electric field and quantify that sensitivity, allowing local electric field measurements to be made in phosphate-containing biological systems without chemical modification.
Phosphates are ubiquitous in biology and play important roles in the function of many biomolecules. Despite the difficulty of observing phosphate group vibrations in the IR in biological samples due to overlapping bands, a number of studies, especially those using caged compounds and/or isotopic labels, have demonstrated the potential for using IR spectroscopy to probe phosphate at the active site of important enzymes1–4. In this communication, we obtain the sensitivity of the symmetric and antisymmetric stretches of phosphate to an applied electric field, the vibrational Stark effect, so that spectral shifts observed in response to a variety of perturbations can be interpreted in terms of changes in electric field experienced by the phosphate group (here referred to as the matrix electric field). The proper interpretation of the results and the effects of hydration are analyzed using quantum chemistry calculations.
Vibrational Stark spectroscopy
For a vibrational probe in two environments that differ because of a pH titration, mutation, change in ligation in an enzyme or other perturbation, the difference in the observed IR frequency, Δν̄obs (in cm−1), depends on the difference in the electric field from the matrix surrounding the probe, ΔF⃗matrix (in MV/cm), according to: hcΔν̄obs = −Δμ⃗probe • ΔF⃗matrix, where h is Planck’s constant, c is the speed of light, and Δμ⃗probe is the linear Stark tuning rate of the probe, whose magnitude, |Δμ⃗probe| (in cm−1/(MV/cm)), can be obtained by measuring the vibrational Stark spectrum of the probe in a frozen glass solvent5,6. With |Δμ⃗probe| thus calibrated (and assuming that it is an intrinsic property of the probe vibration that does not change appreciably in different environments, a property that can be demonstrated in favorable cases7,8), Δν̄obs can be used to obtain ΔF⃗matrix. While the direction of Δμ⃗probe is expected and observed to be parallel to the bond axis for a simple oscillator like -C≡N9, the phosphate vibrations are more complex and calculations are indispensable for interpreting the results of the Stark experiments.
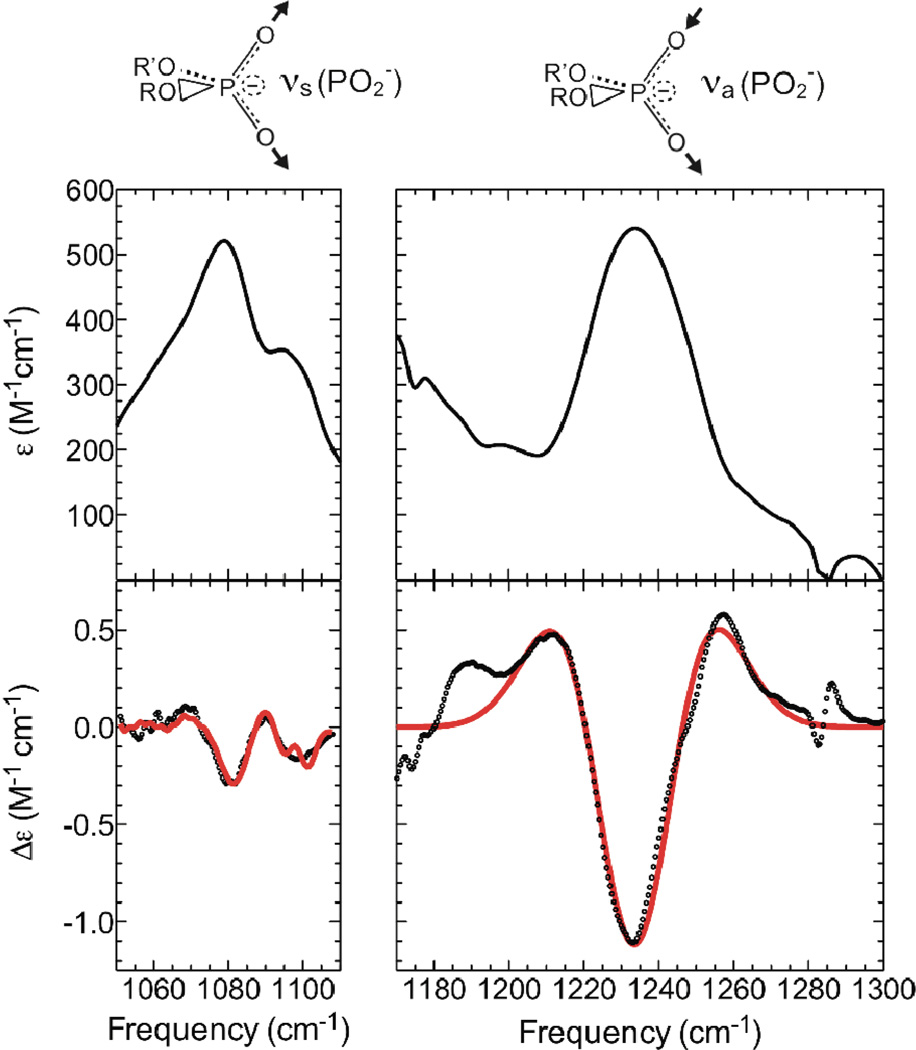
Phospholipids were chosen as a model for the phosphate group because they are soluble in several glass forming solvents. The phosphate vibrations occur in a crowded region of the IR spectrum, so we screened several different phospholipid/solvent combinations to identify samples in which the phosphate bands could be clearly resolved (see Supporting Information for further discussion). All phospholipids were phosphoethanolamines, differing only in the nature of the fatty acid chains, and the spectra of all phospholipid/solvent samples were very similar (Figure S1). The best spectra were obtained with 1-palmitoyl-2-oleoyl-sn-glycero-3-phosphoethanolamine (POPE) in dichloromethane: dichloroethane (1:3 volume ratio) and 1,2-didocosahexaenoyl-sn-glycero-3-phosphoethanolamine (DDHEPE) in deuterated toluene for the symmetric and antisymmetric stretch, respectively(Figure 1). Absorbance spectra of phosphate diesters display two absorption bands for the phosphate PO2− group, corresponding to the symmetric and antisymmetric stretch of this group, around 1080 and 1230 cm− 1, respectively10–12.
Figure 1.
Absorbance (upper) and Stark (lower) spectra of the phosphate region of phospholipid/toluene samples at 77K. The spectra of the phospholipid symmetric stretch (left) and the antisymmetric stretch (right) were scaled to M−1cm−1, and Stark spectra (bottom panels) were additionally scaled to an applied field of 1 MV/cm. Experimental Stark spectra are shown as dots, and numerical fits as solid red lines.
It is immediately obvious from the Stark spectra that the Stark effect is much larger for the antisymmetric stretch than for the symmetric stretch. For both stretching vibrations the Stark spectra are dominated by the linear component of the Stark effect (related to the second derivative of the absorption for an isotropic, immobilized sample; see Supporting Information for details of the Stark analysis). Numerical fitting of the Stark spectra produced values for the linear Stark tuning rate, |Δμ⃗probe|, of 0.54 ± 0.02 and 1.35 ± 0.02 cm−1/(MV/cm) for the symmetric and antisymmetric stretching bands, respectively. These values represent the shift in the absorption that would be observed if an electric field change of 1 MV/cm were projected along the C2 symmetry axis of the PO2− group. Here we have made the assumption that the direction of Δμ⃗probe is along the C2 axis for both modes (see supporting information), which is supported by the results of our calculations, described below. We note that these sensitivities to an electric field, especially for the antisymmetric stretch, are large (the value for the antisymmetric stretch is almost twice as large as for typical nitriles, which have been extensively studied6,9), making phosphate an unusually sensitive vibrational probe.
Effects of hydration
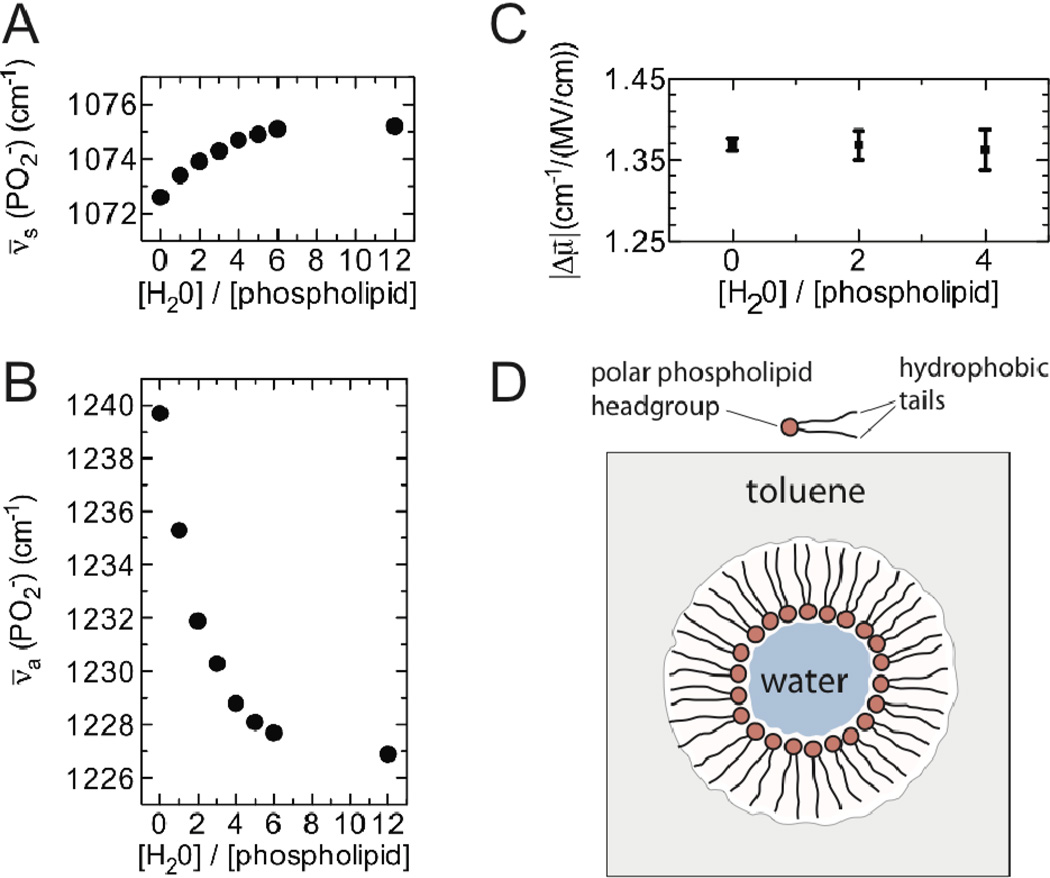
Substantial amounts of water can be solubilized by phospholipid/toluene mixtures, in which the water becomes encapsulated within reverse micelles. Under these partially hydrated conditions the environment of the phospholipid head-groups is similar to the environment experienced in phospholipid membranes, allowing us to study the phosphate vibrations under more physiological conditions. While the addition of water to phospholipid/toluene samples had only a modest effect on the PO2− symmetric stretch (~3 cm−1, Figure 2A), it resulted in a pronounced shift in the peak maximum of the antisymmetric stretch to lower frequency (~13 cm−1, Figure 2B), as well as a significant broadening of the band. These changes reach a plateau at around 10 molar equivalents of water to phospholipid, suggesting that hydration of the phospholipid head-groups is largely complete by that point. The red-shift of the antisymmetric stretch in response to hydration has been well documented in a wide range of phosphate diesters and has been attributed to the formation of hydrogen bonds between the phosphate groups and water molecules11,13–15. The question remains whether the peak shifts are due to the linear Stark effect, and whether the hydrogen bonds affect the Stark tuning rates of the phosphate vibrations.
Figure 2.
Effect of hydration on the phosphate vibrational frequency and Stark tuning rate. The frequency of the PO2− symmetric (A) and antisymmetric (B) stretch in room temperature DOPE/toluene is shown as a function of the amount of water added. (C) The Stark tuning rate measured for the antisymmetric stretch of DDHEPE/toluene as a function of the molar ratio of water to phospholipid. (D) A schematic representation of the reverse micelles used in these experiments.
The vibrational Stark spectra of phospholipid/toluene samples with differing amounts of water were very similar in appearance (Figure S2) despite the substantial spectral shifts. Numerical fitting of these Stark spectra showed no evidence of a change in the linear Stark tuning rate due to hydration (Figure 2C), indicating that the formation of hydrogen bonds between the phosphate groups and water molecules does not significantly affect the sensitivity of the phosphate antisymmetric stretch to electric fields.
Quantum chemical analysis
We next turned to calculations to further understand the effects of electric field and hydration on the phosphate vibrations. We used dimethyl phosphate as model system, which is amenable to density functional theory calculations with reasonably large basis sets. The room temperature absorbance spectrum of 1M dimethyl phosphate in water at pH 7.0 displays narrow symmetric and broader antisymmetric phosphate bands at 1080 and 1210 cm−1, respectively (Figure S3), similar to what is observed for the phospholipid samples. The geometry of the dimethyl phosphate molecule was optimized in the gas-phase using density functional theory (DFT) with the B3LYP functional16–18 and the 6–311++G(d, p) basis set as implemented in Gaussian 0319. A harmonic vibrational analysis predicts symmetric and antisymmetric phosphate stretch vibrations of 1059.0 cm−1 and 1248.0 cm−1, respectively (Table 1). Anharmonic vibrational frequencies were computed for the PO2− group by using methodology described in the Supporting Information. For dimethyl phosphate in the gas phase this procedure yielded symmetric and antisymmetric stretch frequencies of 1053.5 cm−1 and 1234.5 cm−1, respectively (Table 1).
Table 1.
Calculated symmetric (s) and antisymmetric (a) vibrational frequences for dimethyl phosphate and dimethyl phosphate-water complexes.
| Harmonic (cm−1) |
Anharmonic (cm−1) |
Point Charge (cm−1) |
||
|---|---|---|---|---|
| Dimethyl | a | 1248.0 | 1234.5 | – |
| phosphate | s | 1059.0 | 1053.5 | – |
| ADD frequency | a | 7.4 | 9.3 | 4.6 |
| shift | s | −2.6 | 2.7 | −0.8 |
| SDD frequency | a | −35.9 | −34.8 | −29.3 |
| shift | s | 0.3 | −2.3 | −1.8 |
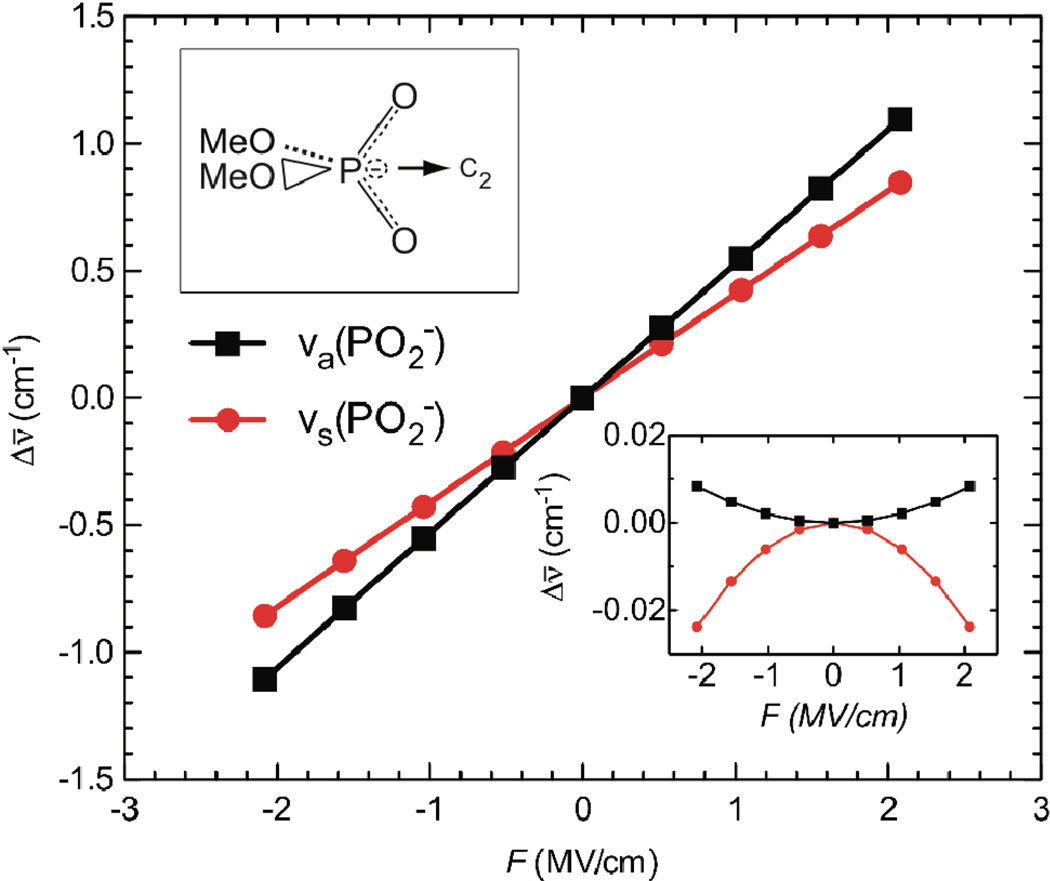
Anharmonic symmetric and antisymmetric stretch frequencies were then computed for dimethyl phosphate in the gas-phase with electric fields between 0 and ± 2.057 MV/cm (± 0.0004 au) aligned along the C2 axis of the phosphate group (Figure 3, main panel). The shifts in the phosphate vibrational frequencies are large and nearly perfectly linear with respect to the applied electric field. We then repeated the analysis for electric fields applied along the O—O axis of the phosphate group (Figure 3, inset). In this case the shifts in vibrational frequencies are nearly two orders of magnitude smaller than with the field applied along the C2 axis, and the field-dependence is quadratic. A similar result was obtained with the field applied in a direction orthogonal to both the C2 and O—O axes. This indicates that along these axes a small quadratic Stark effect is the only response to electric field, and that the direction of Δμ⃗probe is along the C2 axis, as assumed above.
Figure 3.
Field-induced frequency shifts of the phosphate vibrations calculated by DFT. Shifts in the anharmonic symmetric (red) and antisymmetric (black) stretch vibrational frequencies, Δν̄, of dimethyl phosphate as a function of applied electric field, F. The main panel shows the shifts calculated for a field applied along the C2 axis of the PO2− group, and the inset shows the shifts for a field applied along the O—O axis of PO2−.
For the field applied along the C2 axis, the slopes, which represent vibrational Stark tuning rates in the gas-phase, are 0.40 cm−1/(MV/cm) and 0.53 cm−1/(MV/cm) for the symmetric and antisymmetric stretch frequencies, respectively. While the calculations underestimate the value of |Δμ⃗probe| for the antisymmetric stretch, they do support the experimental observation that the antisymmetric stretch is intrinsically more sensitive to electric fields than the symmetric stretch. The linear Stark tuning rate is known to arise in large part from bond anharmonicity20, and the observation that the antisymmetric stretch is more than twice as anharmonic as the symmetric stretch (a −13.5 cm−1 shift relative to the harmonic calculation for the antisymmetric stretch, compared to a −5.8 cm−1 shift for the symmetric stretch) partly explains its greater sensitivity to electric field.
These calculations complement the experiments nicely by verifying that nonlinear Stark effects are negligible and that the antisymmetric stretch is more sensitive than the symmetric stretch, and by confirming that the direction of Δμ⃗probe is along the C2 axis. We conclude that phosphate groups have a surprisingly simple response to electric field, which, like diatomic vibrational probes such as -C≡N, depends linearly on the projection of the matrix field along a single axis.
We next wished to understand the physical origin of the peak shifts observed in response to hydration. The red-shift of the antisymmetric stretch (Figure 2B) could be due to favorable electrostatic interactions through the linear Stark effect, but the blue-shift of the symmetric stretch (Figure 2A) is difficult to reconcile with this model, as demonstrated by implicit solvent calculations, which indicate that both stretching modes red-shift in a high dielectric medium (Figure S4).
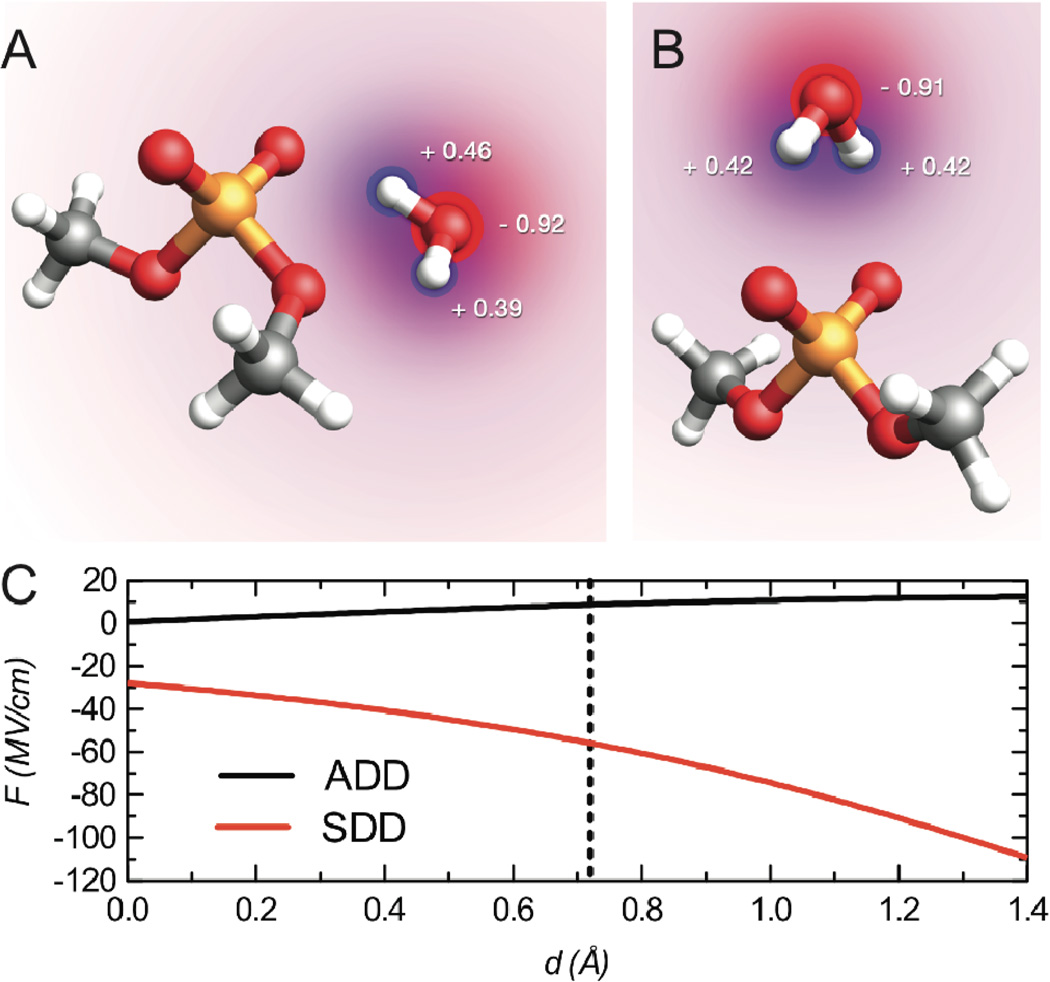
To further understand the effect of water, we performed calculations of a single water molecule, hydrogen bound to the dimethyl phosphate molecule. At the B3LYP/6–311++G(d, p) level of theory and basis set, two stable geometries of dimethyl phosphate and one water molecule, different in energy by 0.54 kcal mol−1, were identified (Figure 4A and 4B). In the lowest energy structure (Figure 4A) the water molecule donates a hydrogen bond to both an O of the PO2− group and an O of the P-O-CH3 connection. In the higher energy geometry, the water forms a symmetric pair of hydrogen bonds with both PO2− O atoms. We will refer to the structures in Figure 4A and 4B as the asymmetric double donor (ADD) and the symmetric double donor (SDD), respectively. Table 1 shows the calculated harmonic and anharmonic phosphate stretching frequencies for the ADD and SDD geometries.
Figure 4.
(A) Antisymmetric double donor (ADD) geometry of one water molecule complexed to dimethyl phosphate. (B) Symmetric double donor (SDD) geometry of water complexed with dimethyl phosphate. The area of the red and blue circles are proportional to the calculated atomic charges of water, which are indicated as fractions of e. (C) Projection of the electric field, F, along the PO2− symmetry axis as function of the distance, d, from the phosphate atom for SDD (red) and ADD (black). The solid dotted line represents the intersection of the PO2− C2 axis and the O—O axis.
To understand if the shifts due to the water molecule can be attributed to electrostatics we calculated the atomic charges on the water molecule using the CHelpG algorithm21. The calculated charges are indicated in Figures 4A and 4B. The charges do not sum identically to zero because there is a small amount of charge transfer from the water molecule to the dimethyl phosphate molecule. We next repeated the anharmonic frequency calculations where the water molecules were modeled as these point charges (Table 1). The resulting shifts in the antisymmetric phosphate stretches (+4.6 and −29.3 cm−1 for the ADD and SDD complexes, respectively) show the same trend observed when the water was modeled explicitly (+9.3 and −34.8 cm−1), implying that the shifts are mostly due to electrostatics. To see if the linear Stark effect could account for these shifts we computed the projection of the electric field along the C2 axis of the PO2− group due to the water molecule’s atomic charges, as a function of the distance from the P atom (Figure 4C). The sign of the electric field projection is qualitatively different for the ADD versus the SDD complex, consistent with the observed red-shift in phosphate stretch frequencies for the SDD complex (negative field) and blue-shift in the ADD complex (positive field). Moreover, if the magnitude of the fields at a point where the PO2− C2 axis intersects the O—O axis (+8.8 MV/cm for ADD and −34.8 MV/cm for SDD) is multiplied by the calculated Stark tuning rate, 0.53 cm−1/(MV/cm), frequency shifts of +4.6 cm−1 and −29.7 cm−1 are predicted for ADD and SDD, in remarkable agreement with the shifts of +4.6 cm−1 and −29.3 cm−1 computed by DFT using the water partial charges.
These results indicate that the shifts in the antisymmetric stretch resulting from hydrogen bonding are mostly due to the linear Stark effect, with the small discrepancy between the explicit water and partial charge calculations either arising from secondary quantum chemical effects, or from slight inaccuracies in the partial charges. A similar analysis of the symmetric stretch frequency shows that, in contrast, the shifts are not reproduced by the partial charge calculations and are much smaller than would be expected from the linear Stark effect. This supports the experimental observation that the response of the symmetric stretch to hydrogen bonding is inconsistent with the linear Stark effect, and suggests that the shifts are dominated by quantum chemical effects.
The calculations show that the interaction with water molecules can produce large electric fields, and we conclude that the dramatic red-shift of the phosphate antisymmetric stretch observed experimentally in response to hydration (Figure 2B) can be attributed to these electric fields. This situation is in marked contrast to other vibrational probes like the nitrile where hydrogen bonds produce confounding peak shifts of a non-electrostatic origin22,23. Phosphate groups are therefore superior probes of electric field for partially solvated environments such as the active sites of enzymes. In pioneering work by Gerwert and colleagues caged guanine nucleotides were used to monitor the time-dependent changes in the phosphate bands during GTP hydrolysis by the small GTPase Ras1,24,25. This work underscored the importance of difference spectra for visualizing the phosphate transitions in biological samples, and a full assignment of the phosphate bands was possible using isotopic labeling. Shifts of ~30 cm−1 were observed during nucleotide binding for the phosphate antisymmetric stretching bands, indicating large changes in electric field of ~20 MV/cm that could be expected to have profound effects on binding and catalysis. In addition to studies of electrostatics in phospholipid bilayers and DNA, the abundance of enzymes that bind phosphate-containing molecules provides a wealth of systems where active site electrostatics can be studied using phosphate as a vibrational probe.
Supplementary Material
ACKNOWLEDGMENTS
This work was supported in part by a Ruth Kirstein National Research Service Award F32GM087896 (NML) and NIH grants GM27738 and GM069630 (SGB), as well as by the National Science Foundation CHE-0845736 (SAC). The authors are also thankful for high performance computing support from the Center for Research Computing at the University of Notre Dame, and for visualization support from Dr. Kristina Furse.
Footnotes
SUPPORTING INFORMATION Complete description of methods. Spectra of all phospholipid/solvent samples. Complete Reference 19. This information is available free of charge via the Internet at http://pubs.acs.org/.
REFERENCES
- 1.Allin C, Ahmadian MR, Wittinghofer A, Gerwert K. P Natl Acad Sci USA. 2001;98:7754. doi: 10.1073/pnas.131549798. [DOI] [PMC free article] [PubMed] [Google Scholar]
- 2.Du X, Frei H, Kim SH. J Biol Chem. 2000;275:8492. doi: 10.1074/jbc.275.12.8492. [DOI] [PubMed] [Google Scholar]
- 3.Liu M, Krasteva M, Barth A. Biophys J. 2005;89:4352. doi: 10.1529/biophysj.105.061689. [DOI] [PMC free article] [PubMed] [Google Scholar]
- 4.von Germar F, Galan A, Llorca O, Carrascosa JL, Valpuesta JM, Mantele W, Muga A. J Biol Chem. 1999;274:5508. doi: 10.1074/jbc.274.9.5508. [DOI] [PubMed] [Google Scholar]
- 5.Boxer SG. J Phys Chem B. 2009;113:2972. doi: 10.1021/jp8067393. [DOI] [PubMed] [Google Scholar]
- 6.Suydam IT, Boxer SG. Biochemistry. 2003;42:12050. doi: 10.1021/bi0352926. [DOI] [PubMed] [Google Scholar]
- 7.Fafarman AT, Boxer SG. J Phys Chem B. 2010;114:13536. doi: 10.1021/jp106406p. [DOI] [PMC free article] [PubMed] [Google Scholar]
- 8.Park ES, Andrews SS, Hu RB, Boxer SG. J. Phys. Chem. B. 1999;103:9813. [Google Scholar]
- 9.Andrews SS, Boxer SG. J. Phys. Chem. A. 2000;104:11853. [Google Scholar]
- 10.Sutherland GBBM, Tsuboi M. Proc R Soc Lon Ser-A. 1957;239:446. [Google Scholar]
- 11.Tsuboi M. Journal of the American Chemical Society. 1957;79:1351. [Google Scholar]
- 12.Arrondo JLR, Goni FM, Macarulla JM. Biochim Biophys Acta. 1984;794:165. doi: 10.1016/0005-2760(84)90310-2. [DOI] [PubMed] [Google Scholar]
- 13.Falk M, Hartman KA, Lord RC. Journal of the American Chemical Society. 1963;85:387. [Google Scholar]
- 14.Pohle W, Bohl M, Bohlig H. J Mol Struct. 1991;242:333. [Google Scholar]
- 15.Shervani Z, Jain TK, Maitra A. Colloid Polym Sci. 1991;269:720. [Google Scholar]
- 16.Becke AD. J. Chem. Phys. 1993;98:5648. [Google Scholar]
- 17.Lee CT, Yang WT, Parr RG. Phys. Rev. B. 1988;37:785. doi: 10.1103/physrevb.37.785. [DOI] [PubMed] [Google Scholar]
- 18.Miehlich B, Savin A, Stoll H, Preuss H. Chem. Phys. Lett. 1989;157:200. [Google Scholar]
- 19.Frisch MJ, et al. Wallingford, CT: Gaussian Inc.; 2004. [Google Scholar]
- 20.Andrews SS, Boxer SG. J. Phys. Chem. A. 2002;106:469. [Google Scholar]
- 21.Breneman CM, Wiberg KB. J. Comp. Chem. 1990;11:361. [Google Scholar]
- 22.Choi JH, Oh KI, Lee H, Lee C, Cho M. J. Chem. Phys. 2008;128:134506. doi: 10.1063/1.2844787. [DOI] [PubMed] [Google Scholar]
- 23.Eaton G, Pena-Nunez AS, Symons MCR. J. Chem. Soc., Faraday Trans. 1988;84:2181. [Google Scholar]
- 24.Kotting C, Blessenohl M, Suveyzdis Y, Goody RS, Wittinghofer A, Gerwert K. Proc Natl Acad Sci U S A. 2006;103:13911. doi: 10.1073/pnas.0604128103. [DOI] [PMC free article] [PubMed] [Google Scholar]
- 25.Kotting C, Kallenbach A, Suveyzdis Y, Wittinghofer A, Gerwert K. Proc Natl Acad Sci U S A. 2008;105:6260. doi: 10.1073/pnas.0712095105. [DOI] [PMC free article] [PubMed] [Google Scholar]
Associated Data
This section collects any data citations, data availability statements, or supplementary materials included in this article.


