

Abstract
OBJECTIVE
We compared A1C and fasting plasma glucose (FPG) in predicting cardiovascular disease (CVD) in a population with widespread obesity and diabetes.
RESEARCH DESIGN AND METHODS
A total of 4,549 American Indian adults underwent the Strong Heart Study (SHS) baseline examination (1989–1991). Data from 3,850 individuals (60% women) with baseline measurements of FPG and A1C and no prevalent CVD were analyzed; 1,386 had known diabetes. CVD events were ascertained over a median of 15 years.
RESULTS
A1C ≥6.5% had a 44.3% sensitivity and 98.9% specificity to identify participants with FPG ≥126 mg/dL. Increases in A1C were associated with adverse CVD risk factor profiles; individuals with known diabetes had worse profiles. For A1C <5, 5 to <5.5, 5.5 to <6, 6–6.5, or ≥6.5% or known diabetes, the multivariate-adjusted hazard ratio (HR) [95% CI] for coronary heart disease (CHD) was significant only for individuals with known diabetes (2.76 [2.17–3.51]). Similarly, the adjusted HRs for total CVD were significant only for individuals with A1C ≥6.5% or known diabetes (1.50 [1.10–2.04] and 2.52 [2.06–3.08], respectively). Similar results were observed for FPG.
CONCLUSIONS
Individuals with known or newly diagnosed diabetes had increased risk for CVD. Although A1C is more convenient than FPG in diagnosing diabetes, neither test adds to conventional CVD risk factors in predicting CHD or total CVD.
Fasting plasma glucose (FPG) has been the standard measure for diagnosing diabetes (1). Hemoglobin A1c (A1C) ≥6.5% has been offered as an alternative diagnostic criterion (2) on the basis of the relationship between A1C and microvascular complications. A1C and FPG measure differing aspects of glucose metabolism; A1C measures chronic glycemia (during the previous 2–3 months), while FPG primarily reflects hepatic glucose output at the time of sampling. As expected, A1C identifies different individuals as diabetic than does FPG (3). Additionally, it was reported (4) in a predominantly white cohort with low prevalence of obesity or diabetes that increments of A1C >5.5% predict significantly increased risk for coronary heart disease (CHD) and stroke, whereas FPG of 100–126 mg/dL does not.
Many U.S. minority populations have high rates of obesity, insulin resistance, and diabetes (5,6). We recently reported that A1C alone identifies fewer diabetes cases than FPG, and neither FPG nor A1C alone can identify all diabetes cases (7). Because the Strong Heart Study (SHS) cohort had a high prevalence of obesity and type 2 diabetes >20 years ago, it serves as a model for other minority populations experiencing epidemics of these disorders (8). In this article, cardiovascular disease (CVD) incidence by A1C category will be examined, and the value of A1C and FPG in predicting CVD will be compared.
RESEARCH DESIGN AND METHODS
Study population
The SHS baseline exam (1989–1991) included a population-based cohort of 4,549 American Indians, aged 45–74 years, from 13 communities in Arizona, North and South Dakota, and Oklahoma. Two follow-up examinations were conducted in 1993–1995 and 1996–1999, respectively, with response rates of 89 and 88% of all surviving members of the original cohort. The Indian Health Service, institutional review boards, participating tribes, and MedStar Health Research Institute approved the study. All participants provided informed consent. The design and selection criteria have been described (9).
Of the 4,549 participants, 331 with baseline CVD, missing baseline diabetes status (n = 110) or A1C values (n = 334), kidney transplant without self-reported diabetes (n = 1), or dialysis therapy without self-reported diabetes (n = 2) were excluded, leaving 3,850 participants for these analyses.
Baseline evaluation
The baseline examination included a personal interview and physical examination using standardized methods and trained interviewers and clinicians (9). Physical activity was assessed via a questionnaire designed for use with American Indians (10). Blood samples were collected for testing, including FPG, lipids, lipoproteins, and creatinine (all enzymatic, externally standardized assays). A1C was measured in a central standardized laboratory by cation exchange high-performance liquid chromatography (11). Detailed clinical and laboratory measures have been published (9).
Hypertension was defined as antihypertensive medication use, systolic blood pressure ≥140 mmHg, or diastolic blood pressure ≥90 mmHg. Micro- and macroalbuminuria were defined as urinary albumin-to-creatinine ratios of 30–299 and ≥300 mg/g, respectively. Chronic kidney disease was defined as Modification of Diet in Renal Disease–estimated glomerular filtration rate <60 mL/min/1.73 m2. Obesity was defined as BMI ≥30 kg/m2.
Participants reporting insulin and/or hypoglycemic agent use or having diabetes were classified as having known diabetes. The remaining participants were classified into categories on the basis of A1C or FPG (1). A1C categories were defined as follows: ≥6.5% = diabetes; ≥6% but <6.5% = high risk for diabetes; ≥5.5% but <6% = high-normal; and <5.5% = optimal. The median value for individuals with A1C <5.5% in this population was 5%. Therefore, individuals with optimal A1C were divided into two subgroups: <5% and ≥5%, but <5.5%. FPG categories were defined as follows: ≥126 mg/dL (7 mmol/L) = diabetes; ≥100 mg/dL (5.5 mmol/L) but <126 mg/dL (7 mmol/L) = impaired fasting glucose; and <100 mg/dL (5.5 mmol/L) = normal fasting glucose.
CVD events adjudication
Fatal and nonfatal CVD events were ascertained at the second and third examinations and annually thereafter by contacting participants or their families, with adjudication by a physician review committee using standardized criteria (12). Surveillance continued through 31 December 2007 for a median 15-year follow-up, with <1% lost to follow-up.
Incident CHD events were defined as nonfatal definite myocardial infarction (MI); definite CHD; electrocardiogram-evident definite MI; cardiac procedures including percutaneous transluminal coronary angioplasty and coronary artery bypass graft; fatal definite MI; and sudden, definite, and possible CHD death. Incident stroke consisted of nonfatal and fatal definite and possible stroke. Possible strokes included cases where imaging was not available but medical history and physical findings confirmed the diagnosis. Incident heart failure (HF) consisted of nonfatal HF and definite and possible fatal HF. Total incident CVD consisted of all events above except nonfatal possible stroke.
Statistical analysis
Baseline characteristics were calculated according to A1C category. ANOVA and χ2 tests were used to compare differences in baseline characteristics between individuals with A1C ≥5 and <5%. Incidence rates of composite CVD events (per 1,000 person-years) were calculated for each A1C category. Cox proportional hazard models were used to estimate hazard ratios (HRs) across categories of A1C (<5, 5 to <5.5, 5.5 to <6, 6–6.5, ≥6.5%, and known diabetes) and FPG (<100, 100 to <126, ≥126 mg/dL, and known diabetes), separately. The initial multivariate model (model 1) was adjusted for age and sex. Model 2 added LDL cholesterol, HDL cholesterol, hypertension, systolic blood pressure, and smoking status (current, past, and never). Model 3 was adjusted for all variables in model 2 plus log(urinary albumin-to-creatinine ratio). Model 4 was adjusted for all variables in model 3 plus A1C or FPG, depending on which had already been included. Confounders were selected on the basis of previous analyses with these data (13). To test the proportionality assumption, we included an interaction term of A1C or FPG category with the logarithm of time in the Cox models. The proportional hazard assumption was not violated. Model discrimination was assessed with the Harrell C statistic. To examine possible interactions of A1C categories with sex and center, we included the product of the factors in a discrete Cox model, adjusted for age, sex, LDL cholesterol, HDL cholesterol, hypertension, systolic blood pressure, smoking status (current, past, never), and albuminuria (normal, microalbuminuria, macroalbuminuria).
Restricted cubic spline regression was used to evaluate the linear association between A1C and incident CVD events among individuals without known diabetes. A1C = 5% was treated as the reference, with four knots placed at 5, 5.5, 6, and 6.5% (the A1C cutoff points used in this study).
Two-tailed P values < 0.05 were considered statistically significant. Data were analyzed using SAS version 9.1 (SAS Institute, Cary, NC).
RESULTS
Baseline A1C was closely correlated with FPG (Pearson r = 0.87, P < 0.0001). A1C ≥6.5% had 44.3% sensitivity and 98.9% specificity to identify participants who had FPG ≥126 mg/dL, regardless of known diabetes. FPG categories for each category of A1C are listed (Table 1).
Table 1.
Baseline characteristics of the SHS participants, stratified by A1C category
| A1C <5% | A1C 5 to <5.5% | A1C 5.5 to <6% | A1C 6 to <6.5% | A1C ≥6.5% | Known diabetes | |
|---|---|---|---|---|---|---|
| n | 862 | 753 | 494 | 159 | 196 | 1,386 |
| A1C (%) | 4.6 ± 0.3 | 5.2 ± 0.1* | 5.7 ± 0.1* | 6.2 ± 0.1* | 8.7 ± 2.0* | 8.9 ± 2.4* |
| Age (years) | 54.2 ± 7.7 | 55.8 ± 8.2* | 56.8 ± 8.0* | 56.9 ± 8.0* | 56.0 ± 7.6* | 56.8 ± 7.8* |
| BMI (kg/m2) | 28.3 ± 5.6 | 30.1 ± 6.0* | 31.8 ± 6.4* | 33.8 ± 7.4* | 33.3 ± 6.9* | 31.7 ± 5.9* |
| Waist circumference (cm) | 98.2 ± 13.2 | 103.1 ± 14.4* | 107.0 ± 14.0* | 110.9 ± 16.1* | 110.7 ± 14.9* | 108.6 ± 13.7* |
| Waist-to-hip ratio | 0.93 ± 0.07 | 0.94 ± 0.07* | 0.95 ± 0.06* | 0.96 ± 0.07* | 0.97 ± 0.06* | 0.96 ± 0.06* |
| LDL cholesterol (mg/dL) | 116 ± 35 | 122 ± 33* | 121 ± 31* | 119 ± 29 | 117 ± 31 | 111 ± 34* |
| HDL cholesterol (mg/dL) | 50 ± 16 | 48 ± 14* | 46 ± 12* | 44 ± 11* | 43 ± 11* | 43 ± 11* |
| Systolic blood pressure (mmHg) | 124 ± 18 | 125 ± 18 | 127 ± 18* | 127 ± 16 | 129 ± 17* | 131 ± 21* |
| Diastolic blood pressure (mmHg) | 76 ± 10 | 76 ± 10 | 77 ± 10 | 77 ± 9 | 79 ± 9* | 77 ± 10* |
| FPG (mg/dL) | 100 ± 13 | 105 ± 16 | 111 ± 20* | 121 ± 23* | 195 ± 71* | 216 ± 82* |
| <100 [n (%)] | 450 (52.2) | 290 (38.5) | 123 (24.9) | 22 (13.8) | 3 (1.5) | — |
| 100–125 [n (%)] | 375 (43.5) | 406 (53.9) | 308 (62.3) | 80 (50.3) | 23 (11.7) | — |
| ≥126 [n (%)] | 37 (4.3) | 57 (7.6) | 63 (12.8) | 57 (35.9) | 170 (86.7) | — |
| Triglycerides (mmol/L)† | 99.5 (67.0, 146.0) | 113.5 (80.0, 152.0)* | 114.0 (87.0, 157.0)* | 115.0 (88.0, 159.0)* | 142.0 (98.0, 213.0)* | 138.0 (96.0, 206.0)* |
| Physical activity (METs/week)‡ | 68.4 (11.8, 145.4) | 66.7 (14.2, 124.2) | 45.5 (10.9, 112.8)* | 33.1 (4.8, 105.5)* | 43.8 (8.1, 112.4)* | 23.3 (3.2, 92.3)* |
| Insulin (μU/mL) | 10.1 (6.1, 16.0) | 12.7 (7.9, 19.8)* | 17.2 (10.4, 25.1)* | 22.3 (13.7, 33.5)* | 22.4 (14.3, 30.7)* | 21.7 (13.7, 32.1)* |
| Female (%) | 53.7 | 56.7 | 59.1 | 60.4 | 59.2 | 66.1 |
| Urinary albumin-to-creatinine ratio† | 6.3 (3.2, 12.1) | 6.5 (3.4, 13.9) | 7.2 (3.7, 13.6)* | 8.1 (4.1, 20.3)* | 21.3 (7.5, 67.1)* | 46.6 (11.9, 294.7)* |
| Microalbuminuria (%) | 8.6 | 8.7 | 9.3 | 15.2* | 29.2* | 33.2* |
| Macroalbuminuria (%) | 0.7 | 2.3* | 2.8* | 3.2* | 9.7* | 24.5* |
| Current smoker (%) | 39.7 | 42.2 | 38.1 | 37.1 | 33.7 | 25.7* |
| Past smoker (%) | 30.6 | 31.3 | 30.8 | 33.3 | 31.1 | 36.9* |
| Obesity (%) | 32.9 | 44.6* | 57.5* | 67.3* | 66.3* | 58.2* |
| Hypertension (%) | 27.3 | 30.7 | 33.8* | 37.1* | 35.2* | 47.6* |
| Estimated glomerular filtration rate (MDRD) <60 mL/min/1.73 m2 (%) | 5.1 | 8.5* | 8.1* | 7.6 | 4.1 | 15.1* |
Data are mean ± SD, median (1st quartile, 3rd quartile), or %. MET, metabolic equivalent. MDRD, Modification of Diet in Renal Disease.
*Significantly different (P < 0.05) from the group with A1C levels <5%.
†Tested after log-transformation.
‡Tested after log-transformation of physical activity + 0.5 because of zero values.
Baseline characteristics according to A1C category are shown (Table 1). Compared with individuals with A1C <5%, participants with elevated A1C or known diabetes were significantly older; had lower HDL cholesterol; had higher BMI, waist circumference, triglycerides, systolic blood pressure, diastolic blood pressure, FPG, insulin, and urinary albumin-to-creatinine ratio; had more macroalbuminuria; and were less physically active. In general, participants with known diabetes had the worst CVD risk profiles. However, indicators of obesity, including BMI and waist circumference, tended to increase with A1C in nondiabetic participants, but were lower in individuals with diabetes.
During a median 15-year follow-up, 1,212 incident CVD, 881 incident CHD, 294 incident stroke, and 362 incident HF events were adjudicated. Unadjusted incidence rates for composite CVD events, CHD, stroke, and HF according to A1C category (Fig. 1) demonstrated a small increased risk in individuals with A1C ≥5 but <6.5%, a greater increase in individuals with A1C ≥6.5%, and the greatest risk in individuals with established diabetes.
Figure 1.

Incidence rate for total CVD, CHD, stroke, and HF, stratified by A1C category The ° indicates the incidence rate, per 1,000 person-years; the I bars denote the 95% CI. (A high-quality color representation of this figure is available in the online issue.)
Adjusted HRs for composite CVD events, CHD, stroke, and HF by A1C category are shown (Table 2). Compared with A1C <5%, adjusted HRs for composite CVD events, CHD, stroke, and HF did not significantly increase in categories of A1C <6.5% (except for ≥5.5 but <6% for stroke). A1C ≥6.5% was independently associated with risk of composite CVD events or stroke (adjusted HRs [95% CI]: 1.50 [1.10–2.04] and 2.24 [1.26–3.99], respectively), but not with CHD or HF (1.43 [0.98–2.08] and 1.58 [0.84–2.95]). Individuals with known diabetes had significant independent risk of CVD, CHD, stroke, and HF (2.52 [2.06–3.08], 2.76 [2.17–3.51], 2.37 [1.56–3.61], and 2.84 [1.89–4.29], respectively) after adjustment for known risk factors. The association between A1C concentration and risk of CVD events was slightly attenuated after adjustment for baseline FPG. We reran models adding BMI and center and found no meaningful changes in the results. No significant interaction between A1C category and sex was observed. A weak significant interaction was observed between center and A1C category for the risk of composite CVD (P = 0.04).
Table 2.
Adjusted HRs and 95% CIs for CVD, CHD, stroke, and HF by category of A1C and FPG
| Model 1* | Model 2† | Model 3‡ | Model 4§ | |
|---|---|---|---|---|
| Outcome by category of A1C | ||||
| CVD | ||||
| <5% | 1 (referent) | 1 (referent) | 1 (referent) | 1 (referent) |
| 5 to <5.5% | 1.29 (1.04, 1.61) | 1.22 (0.98, 1.51) | 1.18 (0.94, 1.47) | 1.17 (0.94, 1.46) |
| 5.5 to <6% | 1.21 (0.95, 1.55) | 1.14 (0.89, 1.46) | 1.09 (0.85, 1.40) | 1.09 (0.85, 1.39) |
| 6 to <6.5% | 1.30 (0.91, 1.85) | 1.17 (0.82, 1.68) | 1.14 (0.79, 1.63) | 1.13 (0.79, 1.61) |
| ≥6.5% | 1.93 (1.43, 2.59) | 1.80 (1.32, 2.44) | 1.50 (1.10, 2.04) | 1.40 (1.02, 1.93) |
| Known diabetes | 3.60 (3.01, 4.31) | 3.38 (2.80, 4.08) | 2.52 (2.06, 3.08) | 2.31 (1.84, 2.90) |
| C statistic | 0.69262 | 0.71177 | 0.71941 | 0.71886 |
| CHD | ||||
| <5% | 1 (referent) | 1 (referent) | 1 (referent) | 1 (referent) |
| 5 to <5.5% | 1.33 (1.03, 1.72) | 1.24 (0.95, 1.61) | 1.20 (0.93, 1.56) | 1.20 (0.92, 1.56) |
| 5.5 to <6% | 1.20 (0.90, 1.61) | 1.10 (0.82, 1.48) | 1.06 (0.79, 1.43) | 1.06 (0.79, 1.43) |
| 6 to <6.5% | 1.24 (0.81, 1.91) | 1.09 (0.70, 1.69) | 1.06 (0.68, 1.64) | 1.05 (0.68, 1.64) |
| ≥6.5% | 1.89 (1.32, 2.70) | 1.72 (1.19, 2.49) | 1.43 (0.98, 2.08) | 1.38 (0.94, 2.04) |
| Known diabetes | 3.91 (3.15, 4.84) | 3.67 (2.93, 4.59) | 2.76 (2.17, 3.51) | 2.64 (2.02, 3.45) |
| C statistic | 0.69622 | 0.72613 | 0.73284 | 0.73230 |
| Stroke | ||||
| <5% | 1 (referent) | 1 (referent) | 1 (referent) | 1 (referent) |
| 5 to <5.5% | 1.22 (0.77, 1.94) | 1.13 (0.71, 1.81) | 1.10 (0.69, 1.76) | 1.09 (0.68, 1.74) |
| 5.5 to <6% | 1.80 (1.13, 2.87) | 1.70 (1.06, 2.72) | 1.63 (1.02, 2.62) | 1.60 (1.00, 2.57) |
| 6 to <6.5% | 1.42 (0.70, 2.88) | 1.34 (0.66, 2.73) | 1.28 (0.63, 2.60) | 1.24 (0.61, 2.53) |
| ≥6.5% | 2.62 (1.49, 4.62) | 2.62 (1.47, 4.66) | 2.24 (1.26, 3.99) | 1.93 (1.06, 3.52) |
| Known diabetes | 3.22 (2.20, 4.73) | 3.1 (2.12, 4.69) | 2.37 (1.56, 3.61) | 1.93 (1.21, 3.10) |
| C statistic | 0.69334 | 0.72059 | 0.73413 | 0.73602 |
| HF | ||||
| <5% | 1 (referent) | 1 (referent) | 1 (referent) | 1 (referent) |
| 5 to <5.5% | 1.38 (0.87, 2.19) | 1.29 (0.81, 2.05) | 1.23 (0.78, 1.96) | 1.23 (0.77, 1.95) |
| 5.5 to <6% | 1.12 (0.66, 1.91) | 1.06 (0.62, 1.81) | 1.01 (0.59, 1.73) | 1.00 (0.59, 1.71) |
| 6 to <6.5% | 2.23 (1.20, 4.13) | 2.00 (1.08, 3.72) | 1.88 (1.01, 3.50) | 1.86 (1.00, 3.46) |
| ≥6.5% | 2.20 (1.20, 4.03) | 2.10 (1.14, 3.87) | 1.58 (0.84, 2.95) | 1.49 (0.78, 2.83) |
| Known diabetes | 5.07 (3.48, 7.39) | 4.39 (2.97, 6.48) | 2.84 (1.89, 4.29) | 2.68 (1.72, 4.19) |
| C statistic | 0.72841 | 0.73959 | 0.75659 | 0.75730 |
| By category of FPG | ||||
| CVD | ||||
| <100 mg/dL | 1 (referent) | 1 (referent) | 1 (referent) | 1 (referent) |
| 100 to <126 mg/dL | 1.16 (0.96, 1.41) | 1.13 (0.92, 1.37) | 1.10 (0.90, 1.34) | 1.10 (0.90, 1.34) |
| ≥126 mg/dL | 1.51 (1.18, 1.92) | 1.45 (1.13, 1.86) | 1.30 (1.01, 1.67) | 1.25 (0.97, 1.62) |
| Known diabetes | 3.41 (2.87, 4.05) | 3.28 (2.73, 3.94) | 2.45 (2.02, 2.99) | 2.27 (1.81, 2.86) |
| C statistic | 0.69105 | 0.71106 | 0.71913 | 0.71937 |
| CHD | ||||
| <100 mg/dL | 1 (referent) | 1 (referent) | 1 (referent) | 1 (referent) |
| 100 to <126 mg/dL | 1.28 (1.01, 1.62) | 1.22 (0.96, 1.55) | 1.20 (0.95, 1.53) | 1.20 (0.95, 1.52) |
| ≥126 mg/dL | 1.53 (1.13, 2.05) | 1.43 (1.06, 1.94) | 1.28 (0.94, 1.74) | 1.27 (0.92, 1.73) |
| Known diabetes | 3.89 (3.15, 4.80) | 3.74 (3.00, 4.68) | 2.84 (2.24, 3.60) | 2.78 (2.11, 3.66) |
| C statistic | 0.69519 | 0.72554 | 0.73256 | 0.73263 |
| Stroke | ||||
| <100 mg/dL | 1 (referent) | 1 (referent) | 1 (referent) | 1 (referent) |
| 100 to <126 mg/dL | 1.08 (0.73, 1.58) | 1.04 (0.70, 1.54) | 1.01 (0.68, 1.50) | 0.99 (0.67, 1.47) |
| ≥126 mg/dL | 1.71 (1.08, 2.71) | 1.72 (1.08, 2.75) | 1.55 (0.97, 2.48) | 1.35 (0.83, 2.20) |
| Known diabetes | 2.65 (1.88, 3.74) | 2.65 (1.84, 3.81) | 1.98 (1.34, 2.92) | 1.51 (0.95, 2.39) |
| C statistic | 0.68941 | 0.71532 | 0.73017 | 0.73329 |
| HF | ||||
| <100 mg/dL | 1 (referent) | 1 (referent) | 1 (referent) | 1 (referent) |
| 100 to <126 mg/dL | 0.84 (0.57, 1.24) | 0.83 (0.56, 1.24) | 0.80 (0.54, 1.19) | 0.80 (0.53, 1.19) |
| ≥126 mg/dL | 1.43 (0.90, 2.29) | 1.39 (0.87, 2.23) | 1.16 (0.71, 1.87) | 1.09 (0.66, 1.78) |
| Known diabetes | 3.78 (2.74, 5.20) | 3.37 (2.40, 4.74) | 2.19 (1.52, 3.14) | 1.94 (1.28, 2.96) |
| C statistic | 0.72745 | 0.73958 | 0.75587 | 0.75658 |
Data are HR (95% CI). The models were run separately for each category of A1C and FPG.
*Adjusted for age and sex.
†Adjusted for variables in model 1, plus LDL cholesterol, HDL cholesterol, hypertension (yes vs. no), systolic blood pressure, and smoking status (current, past, and never).
‡Adjusted for variables in model 2, plus log(urinary albumin-to-creatinine ratio).
§Adjusted for variables in model 3, plus baseline FPG for category of A1C or baseline A1C for category of FPG.
Similar data are shown for CVD events according to FPG category (Table 2). Unadjusted incidence rates and adjusted HRs for composite CVD events, CHD, stroke, and HF increased with FPG. Individuals newly diagnosed with diabetes via FPG appeared to have lower incidence rates (per 1,000 person-years) for these outcomes than individuals newly diagnosed via A1C (CVD: 22.2 vs. 25.2; CHD: 14.5 vs. 16.8; stroke: 6.0 vs. 7.2; HF: 5.4 vs. 6.0, respectively). Compared with FPG <100 mg/dL, FPG ≥126 mg/dL was independently associated with risk of composite CVD events, but not with CHD, stroke, and HF (adjusted HRs [95% CI]: 1.30 [1.01–1.67], 1.28 [0.94–1.74], 1.55 [0.97–2.48], and 1.16 [0.71–1.87], respectively). In contrast, known diabetes was independently associated with risk of these outcomes, including composite CVD events, CHD, stroke, and HF (2.45 [2.02–2.99], 2.84 [2.24–3.60], 1.98 [1.34–2.92], and 2.19 [1.52–3.14], respectively); FPG ≥100 but <126 mg/dL was not associated with these outcomes. The association between FPG and CVD outcomes was slightly attenuated after adjustment for baseline A1C.
The fully adjusted HRs for CVD, CHD, stroke, and HF across baseline A1C in participants without known diabetes are shown (Fig. 2). A flat linear relationship was seen between A1C as a continuous spline function and CVD, CHD, stroke, and HF (P for nonlinear: 0.7, 0.8, 0.2, and 0.8, respectively), with no evidence of a threshold at 6.5%. A similar linear relationship was seen between FPG as a restricted cubic spline function and CVD, CHD, and stroke (P for nonlinear: 0.5, 0.96, and 0.4, respectively). A J-shaped association was observed for HF (P for nonlinear = 0.02) (data not shown).
Figure 2.
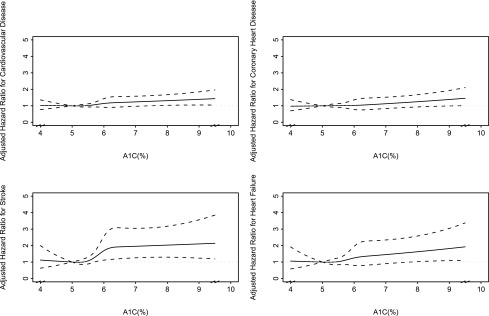
Adjusted HRs for CVD, CHD, stroke, and HF, stratified by baseline A1C. Adjusted HRs (reference A1C = 5%) for CVD, CHD, stroke, and HF, stratified by baseline A1C are shown. Results were obtained by a multivariate Cox regression model with restricted cubic spline function of A1C with four knots, adjusted for age, sex, LDL cholesterol, HDL cholesterol, hypertension, systolic blood pressure, log(urinary albumin-to-creatinine ratio), and smoking status (never, past, or current). Point estimates are indicated by a solid line and 95% CIs by dashed lines. The plot was truncated at the 2.5th and 97.5th percentiles of A1C (4.0 and 9.5%, respectively).
We compared A1C and FPG in prediction models for composite CVD in individuals without and with known diabetes. In subjects without known diabetes, A1C was a significant independent predictor (HR [95% CI] = 1.08 [1.01–1.15] per 1% increase in A1C; P = 0.0307), as was FPG (1.07 [1.01–1.14] per 25 mg/dL increase in FPG; P = 0.0140). In individuals with known diabetes, neither A1C (1.00 [0.97–1.04] per 1% increase in A1C; P = 0.8784) nor FPG (1.01 [0.98–1.04] per 25 mg/dL increase in FPG; P = 0.4417) was a significant, independent predictor.
CONCLUSIONS
Because A1C confers advantages in diagnosing diabetes, including convenience in acquisition and storage and its reflection of glycemia over 2–3 months, it is important to understand its utility in predicting CVD. In this population with high prevalent obesity and diabetes, increasing A1C, even within the nondiabetic range, was associated with adverse CVD risk factor profiles. Unadjusted incidence rates of CVD increased correspondingly. After adjustment for known CVD risk factors, however, our analysis of CVD risk across A1C categories showed no significant increase within the prediabetic range. Individuals with diabetes newly diagnosed via A1C ≥6.5% had a higher risk of incident CVD than individuals with no diabetes, independent of other CVD risk factors. The HRs were higher for people with previously known diabetes. FPG categories showed similar results, with increased independent risk only in individuals with diabetes newly diagnosed via FPG ≥126 mg/dL and the highest HRs in individuals with known diabetes. Flat linear relations were observed between A1C and CVD, CHD, stroke, and HF in individuals without diabetes, with no suggestion of an inflection point at any A1C value. A1C and FPG as continuous variables were each independently associated with risk of composite CVD events, but the effect was small.
Our findings reflect the complex relationship between glycemia and CVD. Individuals with prediabetes diagnosed by either criterion had higher rates of CVD events, but the multivariate models suggest that this increase in CVD is largely attributable to the multiple CVD risk factors in individuals at risk for diabetes. Mechanisms of the hypertension and dyslipidemia accompanying the insulin-resistant state that precedes diabetes (i.e., metabolic syndrome) have been described in multiple populations. Several studies, however, have shown that prediabetes is associated with independent risk for CVD (14,15). One explanation for the differences observed in the current study is that individuals in a population with high prevalence of diabetes progress more rapidly to diabetes (16).
Our data show increased independent risk in individuals with newly diagnosed diabetes and greater HRs in individuals previously diagnosed, suggesting that CVD risk increases as diabetes progresses. A positive association between diabetes duration and CHD mortality has been reported (17). In our dataset, glycemia was not an independent predictor of CVD events in patients with established diabetes. Epidemiological studies (18) have shown an independent association between hyperglycemia, as measured by either criterion, and risk of CVD; however, albuminuria was not included in those models. As diabetes progresses, multiple metabolic abnormalities develop (hemostatic, inflammatory, neurologic, and oxidative), promoting CVD. These processes, however, are not reflected by ambient glucose concentration, likely because of the influence of therapy and because the additional processes are largely intracellular. This dissociation between circulating glucose and cardiovascular pathophysiology has been supported by three large trials that failed to show reduced CVD events with aggressive glucose control in individuals with established diabetes (19–21).
Because the numbers for stroke and HF were smaller than those for CHD events, the findings are less robust, and the data for CVD largely reflect relations with CHD.
Our results differ from those of the Atherosclerosis Risk in Communities (ARIC) study (4), which showed that elevated A1C, but not FPG, was associated with risk of CVD events and death in individuals without diabetes. The glycation process reflected in A1C also occurs in proteins of the basement membrane of vessels in many organs; the dysfunction of these glycated proteins is thought to contribute to the pathophysiology of the microvascular complications and thus the relation with retinopathy and nephropathy that formed the basis for the diagnostic criteria. The relationships observed with incident CVD could reflect the adverse effects of glycated proteins on cardiovascular function. Other longitudinal studies have evaluated the association between A1C and incident CVD (22–25). The results of those studies are inconsistent. Thus, the relation between A1C and incident CVD may vary with populations, selection of covariates, or methods used to account for confounders. Our models included albuminuria because our previous research showed this measure is useful in predicting CVD events (13). More analyses are needed using the A1C criteria and all major CVD covariates, including renal function. Furthermore, the differing methods used to measure A1C in our study and the ARIC study may partially explain the inconsistent findings. A1C in SHS was measured at the examination, whereas the ARIC study used whole-blood samples frozen for >10 years (4).
A1C and FPG identify overlapping but discordant cohorts. The 44.3% sensitivity and 98.9% specificity for A1C ≥6.5% found in the present analyses are similar to those found in the National Health and Nutrition Examination Survey (3) for FPG ≥126 mg/dL. Both criteria show similar HRs for CVD, adjusted and unadjusted, although the HRs appeared slightly lower for FPG, probably because the A1C criterion identifies people with greater and longer-term hyperglycemia.
This study has a number of strengths. The SHS cohort is population based, with long surveillance, almost no loss to follow-up, large numbers of individuals with diabetes, comprehensive risk factor assessment, and CVD events defined by rigorous criteria. The SHS population is similar to other populations with high rates of obesity and diabetes.
Limitations include the ethnic homogeneity of the cohort. The observational nature of the study allows only inferences concerning cause and effect. The small numbers of stroke and HF resulted in wider CIs for these estimates; thus, this study focused on composite CVD and CHD.
In summary, increases in A1C were associated with an adverse CVD risk profile, but adjusted models showed a minimal relation between A1C and CVD risk in individuals without diabetes. A1C >6.5% and FPG >126 mg/dL both identify individuals with increased independent risk for CVD, and the HR for newly diagnosed individuals is smaller than that for individuals with established diabetes. Although A1C identifies a smaller group of individuals with diabetes, A1C and FPG show similar relations with CVD. A1C concentrations of 6–6.5% can help identify individuals at risk for diabetes and individuals with elevated CVD risk factors that warrant immediate treatment. Thus, in high-risk and underserved populations, such as American Indians, the more convenient A1C measure can be useful clinically. More work is needed to identify the mechanisms of the CVD that progresses with hyperglycemia.
Acknowledgments
Funding was provided by the National Heart, Lung, and Blood Institute, National Institutes of Health, cooperative agreement grants U01-HL-41642, U01-HL-41652, UL01-HL-41654, U01-HL-65520, and U01-HL-65521.
B.V.H. received research support in the form of drug donations from Merck/Schering-Plough, served on the advisory board of Merck/Schering-Plough, and served as a consultant for Merck/Schering-Plough. No other potential conflicts of interest relevant to this article were reported.
H.W. designed the study, analyzed and interpreted data, wrote the manuscript, and performed the statistical analysis. N.M.S. reviewed and edited the manuscript. E.T.L. researched data and reviewed and edited the manuscript. R.D. and D.C. reviewed and edited the manuscript. G.d.S. contributed to the discussion and reviewed and edited the manuscript. J.G.U. designed the study, reviewed and edited the manuscript, and supervised the study. B.V.H. designed the study, researched data, contributed to the discussion, reviewed and edited the manuscript, and supervised the study.
The authors thank Rachel Schaperow, MedStar Health Research Institute, for editing the manuscript.
Footnotes
The opinions expressed in this article are those of the authors and do not necessarily reflect the views of the Indian Health Service or the National Institutes of Health.
References
- 1.Genuth S, Alberti KG, Bennett P, et al. Follow-up report on the diagnosis of diabetes mellitus. Diabetes Care 2003;26:3160–3167 [DOI] [PubMed] [Google Scholar]
- 2.American Diabetes Association. Diagnosis and classification of diabetes mellitus. Diabetes Care 2010;33(Suppl. 1):S62–S69 [DOI] [PMC free article] [PubMed] [Google Scholar]
- 3.Carson AP, Reynolds K, Fonseca VA, Muntner P. Comparison of A1C and fasting glucose criteria to diagnose diabetes among U.S. adults. Diabetes Care 2010;33:95–97 [DOI] [PMC free article] [PubMed] [Google Scholar]
- 4.Selvin E, Steffes MW, Zhu H, et al. Glycated hemoglobin, diabetes, and cardiovascular risk in nondiabetic adults. N Engl J Med 2010;362:800–811 [DOI] [PMC free article] [PubMed] [Google Scholar]
- 5.Flegal KM, Carroll MD, Ogden CL, Curtin LR. Prevalence and trends in obesity among US adults, 1999–2008. JAMA 2010;303:235–241 [DOI] [PubMed]
- 6.Cowie CC, Rust KF, Byrd-Holt DD, et al. Prevalence of diabetes and impaired fasting glucose in adults in the U.S. population: National Health And Nutrition Examination Survey 1999-2002. Diabetes Care 2006;29:1263–1268 [DOI] [PubMed] [Google Scholar]
- 7.Wang W, Lee ET, Howard BV, Fabsitz RR, Devereux RB, Welty TK. Fasting plasma glucose and hemoglobin A1c in identifying and predicting diabetes: the Strong Heart Study. Diabetes Care 2011;34:363–368 [DOI] [PMC free article] [PubMed] [Google Scholar]
- 8.Lee ET, Howard BV, Savage PJ, et al. Diabetes and impaired glucose tolerance in three American Indian populations aged 45-74 years: the Strong Heart Study. Diabetes Care 1995;18:599–610 [DOI] [PubMed] [Google Scholar]
- 9.Lee ET, Welty TK, Fabsitz R, et al. The Strong Heart Study: a study of cardiovascular disease in American Indians: design and methods. Am J Epidemiol 1990;132:1141–1155 [DOI] [PubMed] [Google Scholar]
- 10.Yurgalevitch SM, Kriska AM, Welty TK, Go O, Robbins DC, Howard BV. Physical activity and lipids and lipoproteins in American Indians ages 45-74. Med Sci Sports Exerc 1998;30:543–549 [DOI] [PubMed] [Google Scholar]
- 11.Little RR, England JD, Wiedmeyer HM, et al. Interlaboratory standardization of glycated hemoglobin determinations. Clin Chem 1986;32:358–360 [PubMed] [Google Scholar]
- 12.de Simone G, Devereux RB, Chinali M, et al. Metabolic syndrome and left ventricular hypertrophy in the prediction of cardiovascular events: the Strong Heart Study. Nutr Metab Cardiovasc Dis 2009;19:98–104 [DOI] [PMC free article] [PubMed] [Google Scholar]
- 13.Lee ET, Howard BV, Wang W, et al. Prediction of coronary heart disease in a population with high prevalence of diabetes and albuminuria: the Strong Heart Study. Circulation 2006;113:2897–2905 [DOI] [PubMed] [Google Scholar]
- 14.Levitzky YS, Pencina MJ, D’Agostino RB, et al. Impact of impaired fasting glucose on cardiovascular disease: the Framingham Heart Study. J Am Coll Cardiol 2008;51:264–270 [DOI] [PubMed] [Google Scholar]
- 15.Wen CP, Cheng TYD, Tsai SP, Hsu HL, Wang SL. Increased mortality risks of pre-diabetes (impaired fasting glucose) in Taiwan. Diabetes Care 2005;28:2756–2761 [DOI] [PubMed] [Google Scholar]
- 16.Wang H, Shara NM, Calhoun D, Umans JG, Lee ET, Howard BV. Incidence rates and predictors of diabetes in those with prediabetes: the Strong Heart Study. Diabetes Metab Res Rev 2010;26:378–385 [DOI] [PMC free article] [PubMed] [Google Scholar]
- 17.Fox CS, Sullivan L, D’Agostino RB, Sr, Wilson PWF; Framingham Heart Study. The significant effect of diabetes duration on coronary heart disease mortality: the Framingham Heart Study. Diabetes Care 2004;27:704–708 [DOI] [PubMed] [Google Scholar]
- 18.Selvin E, Marinopoulos S, Berkenblit G, et al. Meta-analysis: glycosylated hemoglobin and cardiovascular disease in diabetes mellitus. Ann Intern Med 2004;141:421–431 [DOI] [PubMed] [Google Scholar]
- 19.Gerstein HC, Miller ME, Byington RP, et al. Effects of intensive glucose lowering in type 2 diabetes. N Engl J Med 2008;358:2545–2559 [DOI] [PMC free article] [PubMed] [Google Scholar]
- 20.Patel A, MacMahon S, Chalmers J, et al. Intensive blood glucose control and vascular outcomes in patients with type 2 diabetes. N Engl J Med 2008;358:2560–2572 [DOI] [PubMed] [Google Scholar]
- 21.Duckworth W, Abraira C, Moritz T, et al. Glucose control and vascular complications in veterans with type 2 diabetes. N Engl J Med 2009;360:129–139 [DOI] [PubMed] [Google Scholar]
- 22.de Vegt F, Dekker JM, Ruhé HG, et al. Hyperglycaemia is associated with all-cause and cardiovascular mortality in the Hoorn population: the Hoorn Study. Diabetologia 1999;42:926–931 [DOI] [PubMed] [Google Scholar]
- 23.Pradhan AD, Rifai N, Buring JE, Ridker PM. Hemoglobin A1c predicts diabetes but not cardiovascular disease in nondiabetic women. Am J Med 2007;120:720–727 [DOI] [PMC free article] [PubMed] [Google Scholar]
- 24.Khaw KT, Wareham N, Bingham S, Luben R, Welch A, Day N. Association of hemoglobin A1c with cardiovascular disease and mortality in adults: the European prospective investigation into cancer in Norfolk. Ann Intern Med 2004;141:413–420 [DOI] [PubMed] [Google Scholar]
- 25.Meigs JB, Nathan DM, D’Agostino RB, Sr, Wilson PW; Framingham Offspring Study. Fasting and postchallenge glycemia and cardiovascular disease risk: the Framingham Offspring Study. Diabetes Care 2002;25:1845–1850 [DOI] [PubMed] [Google Scholar]