Abstract
Objective
To identify and analyze subtypes of globules based on size, shape, network connectedness, pigmentation, and distribution to determine which globule types and globule distributions are most frequently associated with a diagnosis of malignant melanoma.
Design
Retrospective case series of dermoscopy images with globules.
Setting
Private dermatology practices.
Participants
Patients in dermatology practices.
Intervention
Observation only.
Main Outcome Measure
Association of globule types with malignant melanoma.
Results
The presence of large globules (odds ratio [OR], 5.25) and globules varying in size (4.72) or shape (5.37) had the highest ORs for malignant melanoma among all globule types and combinations studied. Classical globules (dark, discrete, convex, and 0.10–0.20 mm) had a higher risk (OR, 4.20) than irregularly shaped globules (dark, discrete, and not generally convex) (2.89). Globules connected to other structures were not significant in the diagnosis of malignant melanoma. Of the different configurations studied, asymmetric clusters have the highest risk (OR, 3.02).
Conclusions
The presence of globules of varying size or shape seems to be more associated with a diagnosis of malignant melanoma than any other globule type or distribution in this study. Large globules are of particular importance in the diagnosis of malignant melanoma.
Dermoscopy is a noninvasive imaging technique that uses optical magnification with fluid immersion or with cross-polarized lighting to allow better clinical assessment of skin lesions.1 Dermoscopy has been shown to improve diagnostic accuracy of pigmented lesions when used by practitioners with formal training.2,3
Dots and globules were defined together at a virtual dermoscopy consensus meeting in 2000 as black, brown, round to oval, various-sized structures regularly or irregularly distributed within a melanocytic lesion.1 Dots and globules are differentiated by size, with several studies4–7 reporting that globules exceed 0.1 mm in diameter.
Brown and black globules seen in melanocytic lesions must be distinguished from the blue-gray globules seen in basal cell carcinoma.1 If the globules are present in a regular distribution, they are indicative of a benign melanocytic lesion.1,4–6,8,9 If they are present in an irregular (also called uneven,5 nonuniform,8 or haphazard4) distribution pattern, they are indicative of a malignant melanoma.1,4–6,8,9 In addition, globules of uneven size and shape are characteristic of malignant melanoma.1,4–6,8,9
In most of the diagnostic studies that measured sensitivity and specificity of dots and globules, the 2 features were studied together. The 2000 consensus meeting about dermoscopy found that the presence of dots and globules in an irregular distribution had a sensitivity of 75% and a specificity of 64% in melanoma diagnosis.1 In a study of the 7-point checklist, Argenziano et al9 found a similar 73.7% sensitivity for irregular dots and globules, with a higher specificity of 82.0%. However, Salopek et al10 could not confirm the importance of dots and globules in distinguishing early melanoma from atypical nevi.
The objective of this study was to identify and analyze subtypes of globules based on size, shape, network connectedness, pigmentation, and distribution to determine which globule types and globule distributions are most frequently associated with a diagnosis of malignant melanoma.
METHODS
The image set used in this study consists of 600 digital dermoscopy images of melanocytic lesions, 325 of which had globules. This image set included 175 invasive malignant melanomas, 319 dysplastic nevi with mild or moderate atypia, and 106 nevocellular nevi without atypia. Only invasive melanomas were included in this study. One hundred twenty-two of the malignant melanoma images were obtained from a pre-publication version of the American Academy of Dermatology DVD on Dermoscopy, edited by Harold S. Rabinovitz et al. Images of 53 malignant melanomas and the 2 classes of nevi were acquired at 3 clinics (The Dermatology Center, Rolla, Missouri; Skin and Cancer Associates, Plantation, Florida; and Sheard and Drugge, PC, Stamford, Connecticut). The images had a typical resolution of 1024 × 768 pixels. Images were acquired via 1 of 2 contact dermoscopy instruments using a glass plate with a fluid interface (Dermaphot; Heine Optotechnik GMBH and Co, Herrsching, Germany; or DermLite Fluid; 3Gen, San Juan Capistrano, California). The Phelps County Regional Medical Center Institutional Review Board, Rolla, Missouri, approved this research, and each subject or subject’s parent or guardian signed a consent form for this research. All melanomas were biopsied and examined by a dermatopathologist, and all benign lesions were biopsied or followed up and determined to have no change. The median Breslow thickness for those melanomas that had this measurement available was 0.35 mm.
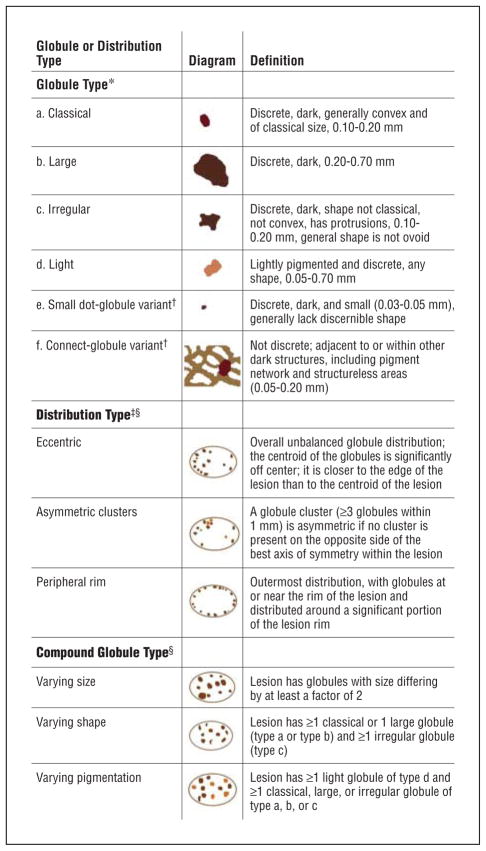
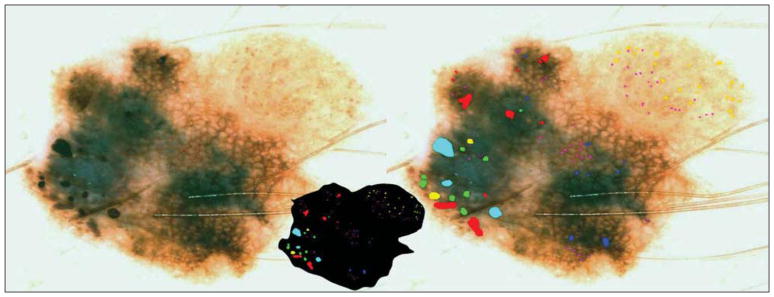
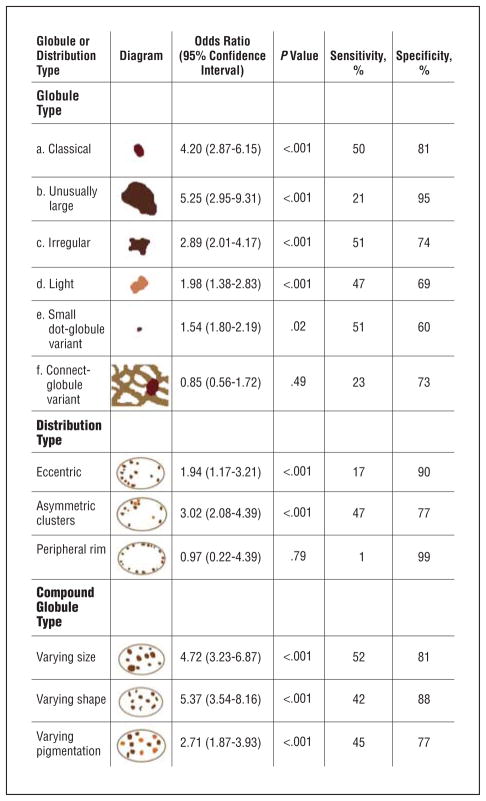
For all 325 images of pigmented lesions with globules from these image sets, students (J.X., Y.K., A.B., and D.C.) and a dermatologist (W.V.S.) identified globules and variant globule-like structures. These globules and variant structures were identified as 1 of the following 6 types (Figure 1): (a) classical (dark [heavily pigmented], discrete globules with convex shape, 0.10–0.20 mm), (b) large (dark, discrete globules of varying shape, 0.20–0.70 mm), (c) irregular (dark, discrete globules with irregular nonconvex shape, 0.10–0.20 mm), (d) light (discrete convex globules with light coloring, 0.05–0.70 mm), (e) small dot-globule variant (dark, discrete globules, 0.03–0.05 mm), or (f) connect-globule variant (dark, nondiscrete globules connected to a pigment network or a blotch, 0.05–0.20 mm). The classical globule sizes were classified as 0.03 to 0.05 mm, 0.05 to 0.10 mm, and 0.10 to 0.20 mm in diameter. Globule size was measured as the greatest diameter, determined using the known ×10 magnification of the images. We did not attempt to separate black globules from brown globules, as is sometimes done in the literature, because we found that few globules have pigmentation so dark as to be considered black and because such cases appear against a dark background. Globule size for each optical platform was calibrated using images that contained ruler scales within the images. Using these images with ruler scales and the known resolution of the images in pixels, we determined the upper and lower limits of pixel diameter for each category of globule size. For example, fully zoomed images (DermLite Fluid) from the clinics were calibrated at 0.01 mm per pixel; images that were not fully zoomed were calibrated by the scale visible on the images. Other images (Dermaphot) from the atlas were calibrated at 0.0125 mm per pixel. In the past, globule shape has been defined as round or oval, but globules of pigmented lesions commonly have a blob shape such as an imperfect egg shape or rounded trapezoid shape, as shown in Figures 2, 3, 4, 5, and 6 (the green globules are considered of regular shape). Therefore, regular globule shape was assigned only if the globule outline was rounded and generally convex. Otherwise, globules were classified as irregular. Elongation was the most common characteristic of irregular globules in our set of lesions. Other globule types are defined in Figure 1. Figures 2 through 6 show examples of the different globule types in benign and malignant nevocellular lesions. The presence or absence of each globule type was recorded in a database.
Figure 1.
Definitions of globule and globule distribution types. *Globule types are illustrated. †Connected globular structures and dot-like globular structures, although not generally considered globules, are included in this study to examine their association with melanoma. ‡A minimum of 3 globules is needed for any globule distribution assignment. §Only nonvariant globules are considered in globule distribution and compound globule assignments.
Figure 2.
Malignant melanoma with globules of different sizes and shapes. The globule distribution type is eccentric and shows asymmetric clusters but no peripheral rim. Note that globules marked with green are not necessarily perfectly round or oval but are generally convex. The lesion outline used in determining distribution type is shown in the inset at center. Green indicates classical; red, irregular; yellow, light; lavender, small dot-globule variant; light blue, large; and blue, connect-globule variant.
Figure 3.
Benign nevocellular nevus with regularly distributed globules. The globule distribution type is not peripheral rim, not eccentric, and is without asymmetric clusters. Note that these benign globules are not perfectly round or oval.
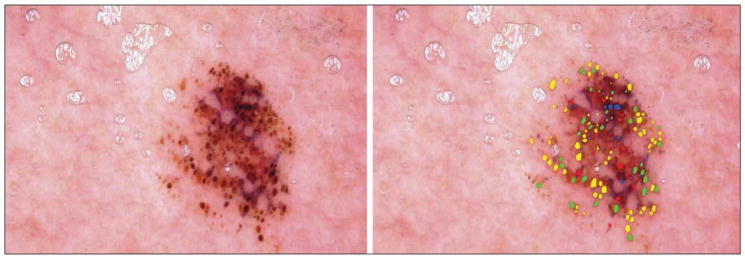
Figure 4.
Benign nevocellular nevus. The globule distribution type is not eccentric but has a peripheral rim and asymmetric clusters. Note that many of these benign globules are not perfectly round or oval.
Figure 5.
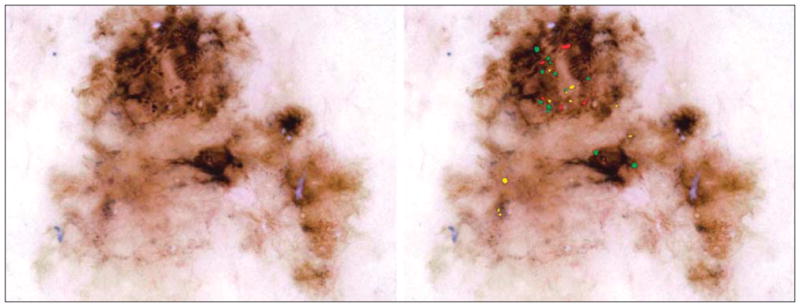
Malignant melanoma. The globule distribution type is eccentric and includes asymmetric clusters, but there is no peripheral rim.
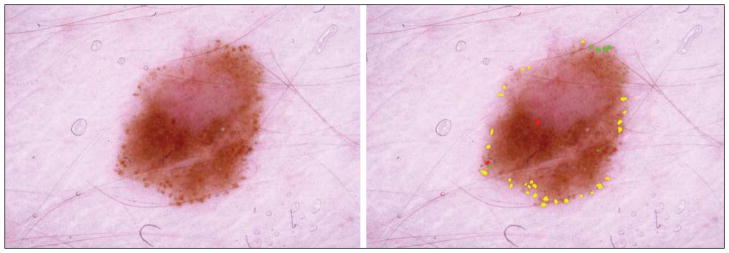
Figure 6.
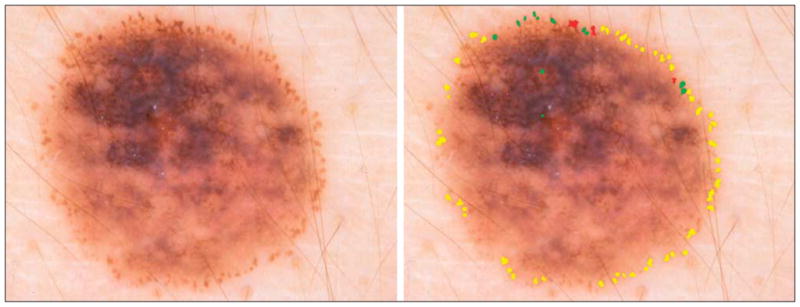
Malignant melanoma. Although the peripheral rim is present in this lesion, other signs of malignant melanoma (blue-gray veil and irregular pigment network) can be seen in the left upper quadrant. Dark globules of varying size and shape are present at the 12-o’clock position.
Three globule distribution characteristics were scored as present or absent, as summarized in Figure 1. The first globule distribution type, eccentric, is defined as an overall unbalanced globule distribution, shown in Figures 2 and 5. The second globule distribution type, asymmetric clusters, is defined as a group of 3 or more globules in an unbalanced position, as shown in Figures 2, 4, and 5. The third globule distribution type, peripheral rim, is defined as an outermost distribution, with globules at or near the rim of the lesion and distributed around a significant portion of the lesion, as shown in Figures 4 and 6. Some images may have more than 1 distribution type, as shown in Figure 5 (eccentric and asymmetric clusters). Some images may have none of the distribution types, as shown in Figure 3. Figure 4 has 2 small asymmetric clusters, although the entire distribution is symmetric around the major axis of the lesion; therefore, the distribution type was scored as asymmetric clusters. No globule distribution type was assigned unless 3 or more globules were present and most of the lesion border was present. Only nonvariant globules were used in distribution type assessments.
The assessment of global distribution type (eccentric, asymmetric clusters, or peripheral rim) was made independently by 2 dermatologists (W.V.S. and J.M.M.), who achieved consensus on any differing assessments. These dermatologists used the following definitions for the distribution types. Eccentric types have a distribution with the globule centroid (center of all globules weighted by area) closer to the edge of the lesion than to the center of the lesion. A cluster is a discrete group of 3 or more globules within 1 mm and is asymmetric if no cluster is present on the opposite side of the best axis of symmetry for the lesion. The peripheral rim distribution was assigned only to those lesions with globules at or near the lesion rim and distributed around a significant portion of the lesion rim. To minimize the likelihood that distribution type assessments were affected by knowledge of the diagnosis, distribution types were determined by overlaying globule images on the lesion outlines shown in Figure 2 (inset).
For the globule data gathered, sensitivity, specificity, and odds ratios (ORs) were calculated using the individual features. P values were computed from the χ2 distribution using the Wald χ2 value (uncorrected Pearson product moment correlation). Sensitivity, specificity, positive predictive value, and ORs were calculated as follows: Sensitivity=true positive/(true positive + false negative). Specificity=true negative / (false positive + true negative). Positive Predictive Value=true positive/(true positive + false positive).11 Odds Ratios=(true positive × true negative)/(false negative × false positive).
RESULTS
Of 175 malignant melanomas, 112 lesions (64.0%) had globules of any type. Of 425 benign nevi, 213 (50.1%) had globules of any type. Therefore, the OR for malignant melanoma among globules of any type is 1.77, 1.80 if variant globules are not considered (P < .001 for both). One hundred fifty-four of 319 dysplastic nevi (48.3%) and 60 of 106 nevocellular nevi (56.6%) had at least 1 type of globule. Every malignant melanoma with globules had at least 1 nonvariant type of globule, so expanding the definition of globules to include the connect-globule variant or small dot-globule variant adds nothing to the sensitivity of globule presence for malignant melanoma diagnosis.
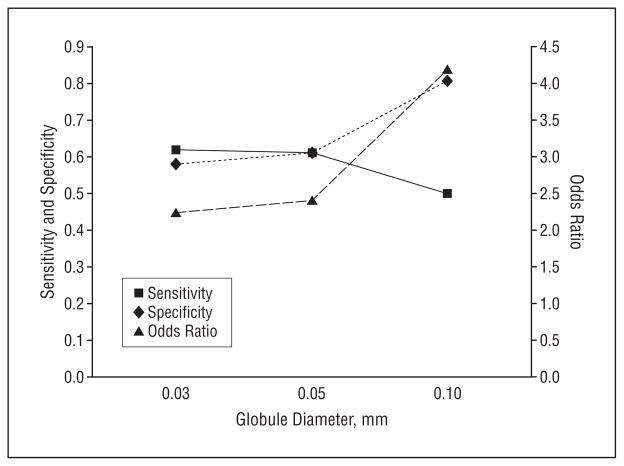
Statistics for the various globule and globule distribution types identified in the study are given in Figure 7. The OR estimate for malignant melanoma for any dermoscopy feature is defined as the ratio of 2 odds obtained from these data (the odds for melanoma with the feature divided by the odds for melanoma without the feature). The highest OR for malignant melanoma of any single globule type, 5.25, was obtained for large, dark, discrete globules (≥0.20 mm). The second highest OR, 4.20, was obtained for classical globules (dark, discrete, convex globules, 0.10–0.20 mm). This OR falls to 2.41 and 2.24 for successively lower limits of globule sizes of 0.05 mm and 0.03 mm, respectively, as shown in Figure 7.
Figure 7.
Statistics for globule and globule distribution types.
Of the globule and globule distribution types, globules varying in size (OR, 4.72) and shape (OR, 5.37) had the highest ORs for malignant melanoma (Figure 8). Light globules and the small dot-globule variant had ORs of less than 2. The connect-globule variant was not found to be statistically significant. Only 7 lesions (2 malignant melanomas and 5 benign lesions) in our study had a peripheral rim distribution type, too few lesions for significance. Both cases of malignant melanoma with a peripheral rim distribution type had other important indicators of melanoma, as shown in Figure 6.
Figure 8.
Statistics on various lower limits of globule sizes calculated from globule and globule distribution types.
When the original lesion images were used, the ORs for malignant melanoma were 4.80 for the eccentric distribution type and 2.71 for asymmetric clusters distribution type. Knowledge of the diagnosis probably led to bias in distribution type assignment for these subjective measures. When only lesion outlines were used, the OR decreased to 1.94 for the eccentric distribution type and increased to 3.02 for asymmetric clusters distribution type, which suggests bias in distribution type assignments when the original image is used. The 2 observers disagreed on 9.8% of the eccentric distribution type assignments and on 12.9% of the asymmetric clusters distribution type assignments before consensus was reached using the definitions described in the “Methods” section.
COMMENT
Even with dermoscopy, the differentiation of early malignant melanoma from benign pigmented lesions remains a difficult challenge. Of all dermoscopic findings, dots and globules that are of irregular size, shape, and distribution have been found to be among the most important dermoscopic structures to aid in this discrimination.1,4–9,11,12 Annessi et al8 analyzed dots and globules separately and found irregular, nonuniform globules (globules varying in size and shape that had nonuniform distribution) to be among the 6 most sensitive and specific features for the identification of thin melanoma. In that study, nonuniformity in distribution alone had a higher positive predictive value than irregularity in size or shape alone, although both features were needed to achieve statistical significance. These findings are summarized by the clinical rule that “[m]elanomas have globules that are uneven in size and shape and most important, are also unevenly distributed.”5(p238)
We studied globules of varying size, differing shape, and uneven (eccentric) distribution type separately. In our study, all 3 categories achieved significance in melanoma discrimination, with size and shape variations achieving greater melanoma discrimination than uneven distribution. The uneven distribution patterns are the most subjective of all of the features studied. The observers found difficulty in determining eccentric distribution type, especially in borderline cases, because of difficulty in determining lesion and globule centroids.
Statistics obtained for 3 lower limits of globule sizes (Figure 8) show a higher OR for the classical lower limit of 0.10 mm than for 0.05 mm or 0.03 mm. Some support for considering globules smaller than 0.10 mm is found in the study by Scope et al,13 in which aggregates of bright cells as small as 0.05 mm on confocal microscopy were correlated with globules that were barely detectable on dermoscopy. Therefore, a lower limit for globule size of approximately 0.05 mm could be proposed. Inclusion of smaller globules adds the benefit of greater size range. In practice, measurement of globule size is not feasible. An alternative definition of the lower globule size limit could be applied, namely, that globules are large enough to have perceptible shape. This definition has limitations because perception of globule shape can vary with the dermoscopy platform used.
Only 55 of 325 images had globules larger than 0.20 mm. The largest globule that we observed was 0.66 mm. In our study, an empiric upper limit cutoff of 0.70 mm was used to define large globules. We found that 4.5% of benign lesions had globules between 0.20 and 0.70 mm. In contrast, 20.3% of malignant melanomas had globules in this size range.
In addition to the retrospective nature of the study, other limitations are the lack of blinding of diagnosis among observers, the high ratio of malignant melanomas to benign lesions, and the likelihood of errors in globule determination and marking. The possibilities of errors in marking the globules and diagnostic bias were kept to a minimum by the 3-pass technique of an undergraduate student (Y.K. or A.B.) marking the globules, corrected by a medical student (J.X. or D.C.), and then corrected by a dermatologist (W.V.S.) experienced in dermoscopy, who adjusted the students’ markings for each lesion. The students were less influenced by diagnosis in their markings and had less bias in distribution type assignments. The dermatologist corrected less than 15% of the individual globule markings or database entries. The technique of overlaying globule images on the lesion outlines was used to delineate the types of globules and to allow efficient checking of globule classification. Lesion outlines were used for globule distribution typing to reduce the possibility of bias in assessment, but the possibility of bias remained because of lesion outline recognition.
The lesions included in the study were obtained from 3 private dermatology practices in the United States and are believed to be representative of such lesions but may not be generalizable to lesions seen in academic settings or in other geographic locations. The percentage of lesions from our series that had globules was similar to that found in university studies in other locations. Steiner et al14 found 60.7% of nevocellular nevi, 55.0% of dysplastic nevi, and 43.8% of malignant melanomas to have brown globules compared with our totals of 56.6% of nevocellular nevi, 48.3% of dysplastic nevi, and 64.0% of malignant melanomas that had globules and related structures. Menzies et al15 found 60% and 94% of malignant melanomas to have black and brown dots or globules, respectively. The methods of counting globules in these studies are not strictly comparable. The high ratio of malignant melanomas to benign lesions in our study has the disadvantage of a higher ratio than is seen in other settings but has the advantage of a greater number of melanomas to allow better characterization of globules among these lesions.
Another caveat is that globules seem to be less common in earlier melanomas. We have noted fewer globules in the invasive melanomas observed during the past few years. This is in agreement with the observation by Salopek et al,10 who did not find that dots or globules are important in distinguishing early melanoma from atypical nevi.
Nevi with a global cobblestone or globular pattern were scored as lacking globules. There was a potential for confusion of globules with this global cobblestone pattern in nevi. The nevi with a globular pattern usually have larger globules, and they are more regular and less discrete, as found by Hofmann-Wellenhof et al.16 Using the requirement that globules should be discrete or connected to other structures, we found no globules on the 6 nevi with the global cobblestone pattern in our lesion set.
In summary, for this series of lesions with globules, features that are most predictive of malignant melanoma are the following: heavily pigmented (dark), discrete, convex globules; globules exceeding 0.20 mm in diameter; and the presence of globules of varying size or shape. The presence of globules varying in shape had the highest OR for malignant melanoma among all globule types and combinations studied. Asymmetric clusters seem to be more frequently associated with malignant melanoma than eccentric globules. The connect-globule variant did not reach statistical significance for diagnosing malignant melanoma.
Acknowledgments
Funding/Support: This study was supported by Small Business Innovative Research grant R44 CA-101639-02A2 from the National Institutes of Health.
Role of the Sponsor: The sponsor had no role in the design or conduct of the study; in the collection, analysis, or interpretation of data; or in the preparation, review, or approval of the manuscript.
Footnotes
Author Contributions: Ms Xu and Mr Calcara and Drs Gupta and Stoecker had full access to all the data in the study and take responsibility for the integrity of the data and the accuracy of the data analysis. Study concept and design: Stoecker. Acquisition of data: Xu, Stoecker, Krishnamurthy, Rabinovitz, Bangert, Calcara, Oliviero, Malters, and Drugge. Drafting of the manuscript: Xu, Gupta, and Stoecker. Critical revision of the manuscript for important intellectual content: Xu, Gupta, Stoecker, Krishnamurthy, Rabinovitz, Bangert, Calcara, Oliviero, Malters, Drugge, Stanley, Moss, and Celebi. Statistical analysis: Xu, Gupta, Stoecker, and Calcara.
Financial Disclosure: None reported.
Disclaimer: The contents of this article are solely the responsibility of the authors and do not necessarily represent the official views of the National Institutes of Health.
Additional Contributions: Jason Hagerty, BS, served as system administrator.
References
- 1.Argenziano G, Soyer HP, Chimenti S, et al. Dermoscopy of pigmented skin lesions: results of a consensus meeting via the Internet. J Am Acad Dermatol. 2003;48(5):679–693. doi: 10.1067/mjd.2003.281. [DOI] [PubMed] [Google Scholar]
- 2.Menzies SW, Zalaudek I. Why perform dermoscopy? the evidence for its role in the routine management of pigmented skin lesions. Arch Dermatol. 2006;142 (9):1211–1212. doi: 10.1001/archderm.142.9.1211. [DOI] [PubMed] [Google Scholar]
- 3.Binder M, Schwarz M, Winkler A, et al. Epiluminescence microscopy: a useful tool for the diagnosis of pigmented skin lesions for formally trained dermatologists. Arch Dermatol. 1995;131(3):286–291. doi: 10.1001/archderm.131.3.286. [DOI] [PubMed] [Google Scholar]
- 4.Stolz W, Braun-Falco O, Bilek P, Landthaler M, Burgdorf WHC, Cognetta A. Color Atlas of Dermatoscopy. 2. Berlin, Germany: Blackwell Science; 2002. p. 20. [Google Scholar]
- 5.Braun RP, Rabinovitz HS, Oliviero M, Kopf AW, Saurat JH. Pattern analysis: a two-step procedure for the dermoscopic diagnosis of melanoma. Clin Dermatol. 2002;20(3):236–239. doi: 10.1016/s0738-081x(02)00216-x. [DOI] [PubMed] [Google Scholar]
- 6.Soyer HP, Argenziano G, Hofmann-Wellenhof R, Johr R, editors. Color Atlas of Melanocytic Lesions of the Skin. New York, NY: Springer-Verlag New York Inc; 2007. [Google Scholar]
- 7.Marghoob AA, Braun RP, Kopf AW. Atlas of Dermoscopy. Philadelphia, PA: Taylor & Francis Group; 2005. [Google Scholar]
- 8.Annessi G, Bono R, Sampogna F, Faraggiana T, Abeni D. Sensitivity, specificity, and diagnostic accuracy of three dermoscopic algorithmic methods in the diagnosis of doubtful melanocytic lesions: the importance of light brown structureless areas in differentiating atypical melanocytic nevi from thin melanomas. J Am Acad Dermatol. 2007;56(5):759–767. doi: 10.1016/j.jaad.2007.01.014. [DOI] [PubMed] [Google Scholar]
- 9.Argenziano G, Fabbrocini G, Carli P, De Giorgi V, Sammarco E, Delfino M. Epiluminescence microscopy for the diagnosis of doubtful melanocytic skin lesions: comparison of the ABCD rule of dermatoscopy and a new 7-point checklist based on pattern analysis. Arch Dermatol. 1998;134(12):1563–1570. doi: 10.1001/archderm.134.12.1563. [DOI] [PubMed] [Google Scholar]
- 10.Salopek TG, Kopf AW, Stefanato CM, Vossaert K, Silverman M, Yadav S. Differentiation of atypical moles (dysplastic nevi) from early melanomas by dermoscopy. Dermatol Clin. 2001;19(2):337–345. doi: 10.1016/s0733-8635(05)70271-0. [DOI] [PubMed] [Google Scholar]
- 11.Riegelman RK. Studying a Study and Testing a Test: How to Read the Medical Literature. Boston, MA: Little Brown and Company; 1982. [Google Scholar]
- 12.Stolz W, Riemann A, Cognetta AB, et al. ABCD rule of dermatoscopy: a new practical method for early recognition of malignant melanoma. Eur J Dermatol. 1994;4:521–527. [Google Scholar]
- 13.Scope A, Benvenuto-Andrade C, Agero AL, Halpern AC, Gonzalez S, Marghoob AA. Correlation of dermoscopic structures of melanocytic lesions to reflectance confocal microscopy. Arch Dermatol. 2007;143(2):176–185. doi: 10.1001/archderm.143.2.176. [DOI] [PubMed] [Google Scholar]
- 14.Steiner A, Binder M, Schemper M, Wolff K, Pehamberger H. Statistical evaluation of epiluminescence microscopy criteria for melanocytic pigmented skin lesions. J Am Acad Dermatol. 1993;29(4):581–588. doi: 10.1016/0190-9622(93)70225-i. [DOI] [PubMed] [Google Scholar]
- 15.Menzies SW, Ingvar C, McCarthy WH. A sensitivity and specificity analysis of the surface microscopy features of invasive melanoma. Melanoma Res. 1996;6(1):55–62. doi: 10.1097/00008390-199602000-00008. [DOI] [PubMed] [Google Scholar]
- 16.Hofmann-Wellenhof R, Blum A, Wolf IH, et al. Dermoscopic classification of atypical melanocytic nevi (Clark nevi) Arch Dermatol. 2001;137(12):1575–1580. doi: 10.1001/archderm.137.12.1575. [DOI] [PubMed] [Google Scholar]


