Abstract
Purpose: A flat-panel detector based mobile isocentric C-arm for cone-beam CT (CBCT) has been developed to allow intraoperative 3D imaging with sub-millimeter spatial resolution and soft-tissue visibility. Image quality and radiation dose were evaluated in spinal surgery, commonly relying on lower-performance image intensifier based mobile C-arms. Scan protocols were developed for task-specific imaging at minimum dose, in-room exposure was evaluated, and integration of the imaging system with a surgical guidance system was demonstrated in preclinical studies of minimally invasive spine surgery.Methods: Radiation dose was assessed as a function of kilovolt (peak) (80–120 kVp) and milliampere second using thoracic and lumbar spine dosimetry phantoms. In-room radiation exposure was measured throughout the operating room for various CBCT scan protocols. Image quality was assessed using tissue-equivalent inserts in chest and abdomen phantoms to evaluate bone and soft-tissue contrast-to-noise ratio as a function of dose, and task-specific protocols (i.e., visualization of bone or soft-tissues) were defined. Results were applied in preclinical studies using a cadaveric torso simulating minimally invasive, transpedicular surgery.Results: Task-specific CBCT protocols identified include: thoracic bone visualization (100 kVp; 60 mAs; 1.8 mGy); lumbar bone visualization (100 kVp; 130 mAs; 3.2 mGy); thoracic soft-tissue visualization (100 kVp; 230 mAs; 4.3 mGy); and lumbar soft-tissue visualization (120 kVp; 460 mAs; 10.6 mGy) – each at (0.3 × 0.3 × 0.9 mm3) voxel size. Alternative lower-dose, lower-resolution soft-tissue visualization protocols were identified (100 kVp; 230 mAs; 5.1 mGy) for the lumbar region at (0.3 × 0.3 × 1.5 mm3) voxel size. Half-scan orbit of the C-arm (x-ray tube traversing under the table) was dosimetrically advantageous (prepatient attenuation) with a nonuniform dose distribution (∼2 × higher at the entrance side than at isocenter, and ∼3–4 lower at the exit side). The in-room dose (microsievert) per unit scan dose (milligray) ranged from ∼21 μSv/mGy on average at tableside to ∼0.1 μSv/mGy at 2.0 m distance to isocenter. All protocols involve surgical staff stepping behind a shield wall for each CBCT scan, therefore imparting ∼zero dose to staff. Protocol implementation in preclinical cadaveric studies demonstrate integration of the C-arm with a navigation system for spine surgery guidance–specifically, minimally invasive vertebroplasty in which the system provided accurate guidance and visualization of needle placement and bone cement distribution. Cumulative dose including multiple intraoperative scans was ∼11.5 mGy for CBCT-guided thoracic vertebroplasty and ∼23.2 mGy for lumbar vertebroplasty, with dose to staff at tableside reduced to ∼1 min of fluoroscopy time (∼40–60 μSv), compared to 5–11 min for the conventional approach.Conclusions: Intraoperative CBCT using a high-performance mobile C-arm prototype demonstrates image quality suitable to guidance of spine surgery, with task-specific protocols providing an important basis for minimizing radiation dose, while maintaining image quality sufficient for surgical guidance. Images demonstrate a significant advance in spatial resolution and soft-tissue visibility, and CBCT guidance offers the potential to reduce fluoroscopy reliance, reducing cumulative dose to patient and staff. Integration with a surgical guidance system demonstrates precise tracking and visualization in up-to-date images (alleviating reliance on preoperative images only), including detection of errors or suboptimal surgical outcomes in the operating room.
Keywords: cone-beam CT, mobile C-Arm, image-guided surgery, spine surgery, minimally invasive, vertebroplasty, flat-panel detector, image quality
INTRODUCTION
The last decade witnessed a proliferation of cone-beam CT (CBCT) imaging technologies based on flat-panel detectors (FPDs) in a fairly broad scope of clinical applications, ranging from diagnostic imaging (e.g., breast and maxillofacial imaging) to image-guided interventions (e.g., radiotherapy, interventional radiology, and surgery). For image-guided surgery (IGS), implementation of CBCT presents a useful new modality for intraoperative 3D imaging. Embodiments include fixed-room C-arms,1, 2, 3 mobile U-arms,4 mobile O-arms,5, 6 and mobile C-arms.7, 8, 10 The last was initially proposed for guidance of spinal surgery9 and has since been applied to additional orthopaedic sites,11, 12 prostate brachytherapy,13 thoracic surgery,14 and head-and-neck/skull base surgery.15, 16, 17, 18 The C-arm prototype described in early work has formed a useful basis for the development of the technology (e.g., improved image quality and integration with surgical navigation systems), application in various subspecialties, and an advanced C-arm design suitable to broad clinical application.
Spine surgery, which has been identified among the key areas for 3D C-arm imaging, presents a significant set of clinical challenges that can be answered in part by high-quality intraoperative 3D imaging in combination with surgical navigation and fluoroscopy. These include guidance of minimally invasive spinal surgeries involving the placement of spinal instrumentation and/or vertebral augmentation with polymethylmethacrylate (PMMA). While XRII-based mobile C-arms with 3D imaging capability offer an advance in guidance capability, such systems are limited by poor image quality, low spatial resolution, lack of soft-tissue visibility, and small field of view. It is also highly desirable to reduce radiation dose associated with such technology—not only dose to the patient but also to the surgeon and other staff.19, 20 Through the development of soft-tissue CBCT well integrated with a high-precision surgical navigation system, we aim to improve surgical performance and reduce dose to patient and staff. Initial studies9 included investigation of C-arm geometric calibration stability, the effect of respiratory motion and other artifacts on image quality, and potential improvements in surgical precision. The study detailed below extends such work to identify task-specific acquisition protocols (separately for thoracic and lumbar spine) that minimize radiation dose, while maintaining image quality in relation to bone and/or soft-tissue visualization. The associated in-room dose is also investigated, although well-implemented protocols and workflow for 3D imaging potentially involve zero dose to in-room staff (who step away from tableside during 3D scans). By shifting reliance from continuous fluoroscopy to a knowledgeable protocol of 3D scans acquired at specific time points during a surgical procedure combined with real-time surgical navigation, we hope to reduce dose in comparison to conventional, fluoroscopically guided interventions.21 The aim of this manuscript is to provide a basis for image quality, dose, and system integration for translation of the system to clinical pilot studies and broader clinical application in spine surgery.
MATERIALS AND METHODS
Mobile isocentric C-arm for high-quality CBCT
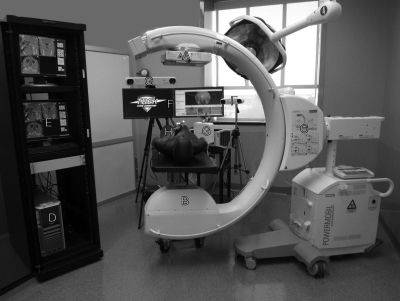
The C-arm prototype has been described in previous work, summarized below and expanded to include a variety of modifications and improvements.7, 8, 9, 10, 18, 22 As illustrated in Fig. 1, the system is based upon a mobile, isocentric C-arm platform (PowerMobil, Siemens Healthcare, Erlangen, Germany) modified to include an FPD in the imaging chain, added beam filtration, expanded field of view, a computer-controlled orbital drive, and system for projection data processing and CBCT reconstruction.9 The C-arm operates in pulsed-fluoroscopic mode (1–12 p/s, pulse width 7 ms) with tube voltage and current ranging from 40 to 120 kVp (0.2 mm Cu added filtration) and 0.6–9.2 mA, respectively. The detector (PaxScan 3030 + , Varian Imaging Products, Palo Alto, CA) incorporates a CsI:TI scintillator, an active matrix of 1536 × 1536 pixels at 194 μm pitch (30 × 30 cm2), and is operated in dual-gain readout mode.23 Orbital range of the gantry is ∼178° and the volumetric field of view is ∼(15 × 15 × 15 cm3). Nominal CBCT acquisition involves detector readout at 3.3 fps, with 200 projections acquired in 64 s, although fast- and slow-scan protocols are also implemented (100 and 600 projections, respectively, giving ∼32–192 s scan time). Geometric calibration is based on the helical BB phantom and method reported by Navab et al.24 Projection data processing included correction of detector offset and gain, defect pixels, time-dependent thermal variations, and angle-dependent gain calibration as described by Schmidgunst et al.25 3D image reconstruction used a variation of the Feldkamp–Davis–Kress (FDK) algorithm implemented on a graphics processing unit (GPU). The reconstruction process does not include advanced post-processing algorithms such as scatter or metal artifact correction and should be considered as fairly “raw” CBCT reconstructions.
Figure 1.
Prototype C-arm and navigation system for CBCT guidance of surgical interventions. The main components of the C-arm prototype are (a) a flat-panel detector, (b) X-ray tube, and (c) a motorized orbit with computer-controlled x-ray exposure, detector readout, and (continuous) C-arm rotation. CBCT reconstructions are computed using a GPU-based variation of the Feldkamp algorithm, with images available on the acquisition computer (d and e) and integrated with video endoscopy, planning data, and surgical navigation at tableside (f). A variety of endoscopic video and tracking technologies (g–i) are integrated with the system.
Integration with a surgical guidance system
Illustrated in Fig. 1 are elements of the surgical guidance system under development for a broad variety of surgical applications. The system is based on an in-house software architecture (“TREK”) that binds open-source libraries for surgical tracking (cisst Libraries, Johns Hopkins University, Baltimore, MD) with front-end image visualization and analysis (3D Slicer, Brigham and Women’s Hospital, Boston, MA). Depending on the requirements of a given application, the system allows various tracking modalities alone or in synchrony [e.g., Polaris Spectrum or Vicra infrared trackers, Aurora electromagnetic trackers (Northern Digital Inc., Waterloo, ON), or MicronTracker optical video trackers (Claron, Toronto, ON)] and various modes of visualization (slice navigation in triplanar views, volume rendering, endoscopic video with or without CBCT data overlay, etc.).26, 27, 28, 29 For the spine surgery studies detailed below, the TREK guidance system incorporated the Polaris Vicra tracker, an assortment of tracked surgical tools, and a combination of tri-planar views and MIP/volumetric image rendering.
Dosimetry
The radiation dose associated with two task-specific protocols (bone visualization and soft-tissue visualization) in two anatomical sites (thoracic and lumbar spine) was assessed. The task-specific protocols were in turn based upon quantitative and qualitative studies of imaging performance in phantom and cadaver. Differentiation of thoracic and lumbar protocols was considered an important distinction, due to the large difference in attenuation. The protocols identified below correspond to a nominal body habitus—specifically, “average” adult body size represented by the phantoms detailed below. Extension of these nominal protocols to obese and pediatric body habitus is the subject of future work.
Dosimetry phantoms
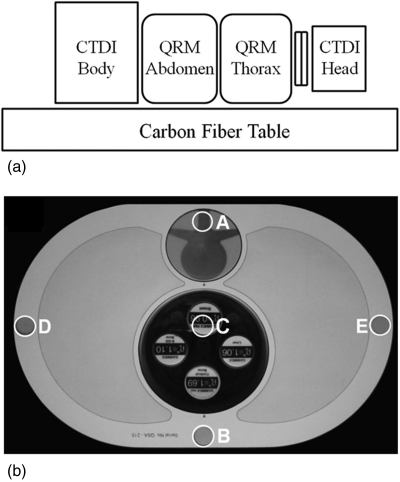
The dosimetry setup is illustrated in Fig. 2, involving a stack of phantoms intended to account for radiation dose from out-of-field X-ray scatter (a significant component of dose in CBCT). The stack was placed on the 4.3 cm thick carbon-fiber tabletop shown in Fig. 1. The four phantoms (from inferior to superior) were: (i) a 32 cm diameter acrylic CTDI body phantom (Gammex RMI, Middleton, WI); (ii) an oblate abdominal phantom (QRM GMBH, Erlangen, Germany); (iii) an oblate thoracic phantom including low-density regions approximate to lung volumes [Fig. 2b, QRM GMBH, Erlangen, Germany]; and (iv) a 16 cm diameter acrylic CTDI head phantom, offset from the thorax by an acrylic (“neck”) cylinder of 12 cm diameter, ∼5 cm length. Each phantom included five boreholes of 10 mm diameter [labeled A–E in Fig. 2b] for central and peripheral dose measurement using a 0.6 cm3 Farmer ionization chamber (RadCal, Monrovia, CA).
Figure 2.
(a) Measurement setup for thoracic and lumbar spine radiation dose and image quality assessment. The long stack of phantoms approximates a realistic setup that includes dose from x-ray scatter. (b) Photograph of the thoracic phantom. The labels A–E show the location of holes for Farmer chamber placement. For image quality (CNR) measurements, the uniform dosimetry inserts at locations A and C were replaced with the simulated vertebra and set of tissue-simulating inserts as shown in (b). The tissue-equivalent inserts were placed within an acrylic cylinder (clockwise from bottom): cortical bone, B-200 bone, breast, and liver. Since spine surgery is most commonly performed with the patient in a prone position, the phantom was arranged with the spine at the top surface.
Dose measurements were acquired across a broad range available on the C-arm through variation of the tube voltage (80–120 kVp) and tube current (0.6–5.2 mA), keeping the number of projections per scan fixed at the nominal technique of Nproj = 200 and the x-ray tube pulse length fixed at tpulse = 0.7 ms. Each measurement was repeated three times, and the average value was calculated. The total exposure measured per scan in the air ionization chamber (Xscan) was corrected for temperature and pressure factors and converted to dose (Dscan) using an f-factor, f, of 0.873 cGy/R,30 denoted Dscan(cGy)=Xscan·f. Dose values analogous to CTDIw defined for axial CT were computed as , where the peripheral dose was determined as the average point dose measurements in locations A, B, D, and E.1, 18, 31 The weighted dose index (Dw) is intended to account for the heterogenous dose distribution associated with the half-scan C-arm orbit as well as the oblate phantom shape. Even for a circularly symmetric CTDI phantom, the half-scan orbit imparts a heterogeneous peripheral dose (viz., for a prone setup and tube-under orbit, highest at the anterior surface (against the operating table), lower at the lateral aspects, and lowest at the posterior surface) and suggests a weighting as in the equation above for the average peripheral dose .
In addition to the measured point dose values, the approximate dose distribution within the body was visualized qualitatively by 2D cubic-spline interpolation and overlay of the resulting “dose map” on a CT image. Such visualization does not pretend to account for the complex perturbations in actual dose associated with realistic tissue inhomogeneities, but it is helpful nonetheless in communicating the strong anterior–posterior non-uniformity in dose associated with a half-scan C-arm orbit. It was also perceived as a clear, simple means of communicating dose in a manner readily appreciated by the surgeon.
In-room exposure
In-room exposure was measured at positions immediately surrounding the operating table and up to 2.0 m distance from isocenter. To present realistic scatter conditions, measurements were performed with the full stack of phantoms shown in Fig. 2 on the table with C-arm isocenter placed in the center of the abdomen phantom. Measurements were performed in air using a 180 cm3 pancake exposure chamber (10X5-180, RadCal, Monrovia, CA) facing toward the isocenter at a height of 1.3 m above the floor (approximately equal to the isocenter height). The measured in-air exposure for a single scan [X (mR)] was converted to exposure assuming shielding apparel equivalent to a 0.5 mm Pb apron and thyroid shield attenuating ∼90% of the incident beam. Therefore, the approximate exposure to a staff-person is:32Xshielded(mR)=0.1·1.5·XBody-unshielded+0.04·XHead-unshielded, where XBody-unshielded and XHead-unshielded were taken equal to the measured unshielded in-air exposure, the former with a factor of 0.1 corresponding to 90% attenuation in the Pb apron. This simplifies to a conservative estimate of: Eshielded(mR)=0.19·Eunshielded. In-air exposure was converted to effective dose [E (mSv)] using E(mSv)=X·f∕100 for both unshielded and shielded exposure using an f-factor of 0.9.32
Staff positions around the table were approximated according to typical locations during a lumbar spine intervention, including the anesthesiologist (∼40–60 cm superior isocenter), the surgeon (∼70 cm lateral from isocenter), a nurse (∼90 cm from isocenter, adjacent to the surgeon), and two assistants (∼70 and 110 cm from the isocenter, opposite the surgeon). In addition, in-air exposure was measured in concentric circles at 1, 1.5, and 2 m distance from the isocenter. The point dose measurements were interpolated using 2D cubic-splines to estimate the dose distribution throughout the OR and quantify the exposure reduction associated with distance from isocenter. The protocol and workflow that is ideal from a radiation standpoint involves all operating room staff stepping away from tableside (e.g., behind a radiation barrier) during each CBCT scan, so that dose to in-room staff is zero irrespective of in-room exposure during the scan. This protocol was followed in all preclinical studies (including actual patient pilot studies) performed to date. This involves additional logistical considerations—e.g., the anesthesiologist must maintain clear view of the patient and all monitoring equipment at all times—but in clinical scenarios examined to date, this protocol has been manageable within acceptable surgical workflow.
Image quality assessment in thoracic and lumbar spine
Analysis of contrast-to-noise ratio versus dose and voxel size
The experimental setup for image quality measurements was similar to the dosimetry setup in Fig. 2, with uniform dosimetry inserts in the oblate thorax and abdomen exchanged with vertebral and tissue-simulating inserts shown in Fig. 2b. Four tissue-equivalent electron density inserts were incorporated within a 10 cm acrylic cylinder (electron density relative to water, ρe = 1.15, 130 HU), including: cortical bone (ρe = 1.69, 1203 HU), breast (ρe = 0.96, −41 HU), liver (ρe = 1.07, 83 HU), and B200 bone (ρe = 1.10, 225 HU), each having a diameter of 28 mm (Gammex RMI, Madison, WI), where HU values were taken from Watanabe.33 Relative to the acrylic cylinder holder, the contrast (signal difference) of each insert is therefore: cortical bone (1073 HU), breast (−171 HU), liver (−47 HU), and B200 bone (95 HU). Image acquisition was performed as a function of dose across the range of kilovolt (peak) and milliampere described above.
CBCT reconstructions of the tissue-equivalent insert in both the lumbar and thoracic phantoms were evaluated in terms of contrast-to-noise ratio (CNR) as a function of dose and slice thickness. Contrast was defined as the absolute difference between two regions of interest (10 × 10 voxels in an axial slice), one within a given tissue-equivalent insert and the other in an immediately adjacent space within the acrylic holder. The mean voxel value and standard deviation were determined in each ROI in 60 successive axial slices (covering ∼1.8 cm length), and the ensemble mean ( and , respectively) and standard deviation ( and , respectively) were determined. The absolute contrast (C) is therefore: . Voxel noise (σ) was taken as the mean of the noise in the tissue-equivalent insert and background, , and the CNR was calculated as the ratio C/σ. At each dose level, CNR was computed for slice thicknesses (tslice) values of 0.3, 0.9, and 1.5 mm (post-reconstruction slice averaging of 0.3 mm voxels) using a fixed filter kernel (Shepp-Logan).
Analysis of image quality and surgical performance in cadaver
For qualitative assessment of imaging performance within a realistic anatomical context of thoracic and lumbar spine, a cadaveric torso was imaged as a function of kilovolt (peak) and milliampere second across the same range of dose, described above. The cadaver was a female of moderately obese body habitus, fixed with a mild solution of formaldehyde to maintain tissue motility. Separate scan protocols appropriate to visualization of high-contrast bone and soft-tissues were identified by qualitative evaluation of the cadaver images acquired versus dose (and slice thickness) in combination with the quantitative values of CNR obtained at equivalent technique. Images were interpreted by a fellowship-trained and experienced spine surgeon and assessed in terms of visibility of high-contrast bony detail as well as surrounding soft-tissue structures, such as fat and muscle.
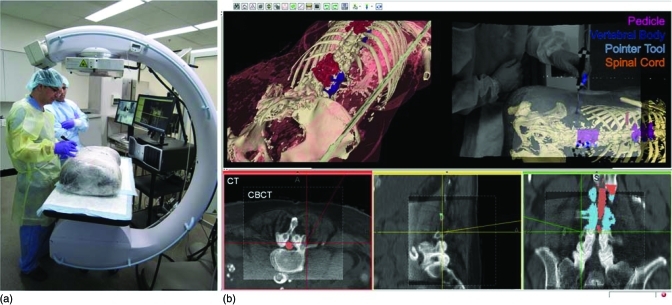
Subsequent to the image quality assessment, the cadaver was used in simulation of image-guided transpedicular vertebroplasty of the thoracic and lumbar spine. Following a preoperative CT scan (Somatom Definition, Siemens Healthcare, Forchheim, Germany), the targeted vertebrae were segmented manually using ITK-Snap (v. 2.1.0).34 The specimen was placed prone on the carbon-fiber table as in Fig. 3, and an initial C-arm CBCT volume was acquired. The 3D image was transferred to the TREK guidance system and registered with the preoperative CT, image segmentations, and the optical tracking system. Although, a variety of deformable registration techniques are under investigation in related research, a simple rigid registration based on corresponding points was used in this experiment. The surgeon was then able to visualize the preoperative CT and planning data within the context of intraoperative CBCT and interact with the data via real-time tracking, as illustrated in Fig. 3.
Figure 3.
Experimental setup for studies of image quality and surgical navigation in a cadaveric specimen. (a) Photograph of the cadaveric torso on the OR table. (b) Screenshot of real-time navigation software showing CBCT registered to preoperative CT and planning data, tool trajectory, as well as rendered patient/target data overlaid with live video stream.
RESULTS
Radiation dose
Scan dose
For CBCT imaging of the thoracic spine, the total dose (Dscan) per milliampere second at the center of the phantom was: 0.014 mGy/mAs (at 80 kVp), 0.031 mGy/mAs (at 100 kVp), and 0.056 mGy/mAs (at 120 kVp). For the lumbar spine, the corresponding Dscan per milliampere second was: 0.009, 0.022, and 0.044 mGy/mAs at 80, 100, and 120 kVp, respectively. Based on the CNR and image quality studies below, task-specific technique selections are summarized in Table Table I.. These defined the “Bone Protocols” for imaging of high-contrast bone structures and “Soft-Tissue Protocols” for visualization of soft-tissues. For example, the “Bone Protocol” in the thoracic spine involved a technique of 100 kVp, 60 mAs, and 200 projections, giving a fairly low dose protocol of Dscan = 1.8 mGy and Dw = 1.9 mGy. Delineated in Table Table I. is the protocol invoked for visualization of soft-tissue structures in the highly attenuating regions about the lumbar spine. This protocol involved 120 kVp, 460 mAs, and 400 projections, giving Dscan = 10.6 mGy, Dw = 12.5 mGy. These values are lower than pelvic CT (e.g., 10–20 mSv), but are sufficiently high as to place some restrictions on the frequency with which such a protocol should be invoked for interventional guidance. An alternative protocol for the lumbar spine was defined to provide images at lower dose and reduced spatial resolution (0.3 × 0.3 × 1.5 mm3 voxels): 100 kVp, 200 mAs, 200 projections, Dscan = 5.1 mGy, Dw = 6.01 mGy.
Table 1.
Technique settings and dosimetry for task-specific protocols in the thoracic and lumbar spine. “Bone Protocol” refers to a lower dose technique sufficient for high-contrast bone visualization. “Soft-Tissue Protocol” refers to a higher dose technique sufficient for soft-tissue visualization.
| Bone protocol | Soft-tissue protocol | ||||
|---|---|---|---|---|---|
| Thoracic spine | Lumbar spine | Thoracic spine | Lumbar spine (LoRes) | Lumbar spine (HiRes) | |
| KVp | 100 | 100 | 100 | 100 | 120 |
| mA | 0.6 | 1.3 | 2.3 | 2.3 | 2.3 |
| mAs | 60 | 130 | 230 | 230 | 460 |
| # Projections | 200 | 200 | 200 | 200 | 400 |
| Dscan (mGy) | 1.81 | 3.16 | 4.26 | 5.1 | 10.6 |
| Dw (mGy) | 1.91 | 3.70 | 4.61 | 6.01 | 12.50 |
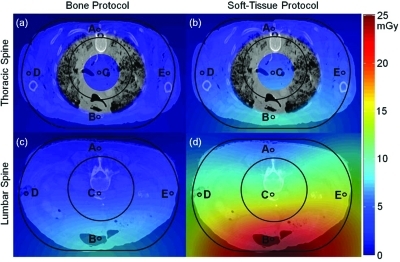
Figure 4 shows the dose (Dscan) measured at locations A–E in the dosimetry phantoms interpolated across an axial slice and superimposed as a colormap in the context of a thoracic and abdominal CT image of the cadaver. The CT image was arbitrarily scaled for purposes of visualization to match the dimensions of the dose phantom, shown by the outer black line tracing the periphery of the oblate QRM phantom. For the thoracic case, the dose distribution interpolated through the region of highly heterogeneous lung tissue was removed to avoid any suggestion that a simple interpolation is an accurate estimate of dose within heterogeneous lung; however, the central dose, peripheral dose, and interpolated dose throughout the mediastinum and periphery are shown to convey an easily interpretable context of the dose values. For the lumbar case, the 2D interpolation is shown throughout, ignoring effects associated with true tissue inhomogeneities. Due to the half-scan “tube-under” C-arm orbit, the dose distribution is asymmetric and a factor of ∼5 lower at the exit side of the patient.
Figure 4.
CBCT dose measured at five locations (A–E) in the dosimetry phantoms, interpolated and superimposed on images of the cadaver. The images are intended as a simple means of communicating the heterogeneous dose distributions, recognizing that they do not represent the true patient dose and do not account for true tissue inhomogeneity. Dose in the region of the lungs is excluded for this reason. (a) Thoracic Spine – “Bone Protocol”. (b) Thoracic spine – “Soft-Tissue Protocol”. (c) Lumbar Spine – “Bone Protocol”. (d) Lumbar spine – “Soft-Tissue Protocol”.
Previous work by Daly et al.18 showed that the tube-under orbit is advantageous in imaging for guidance of head-and-neck/skull base surgery, since the same dose asymmetry afforded significant dose sparing of the eyes in a typical (supine) surgical setup. For the (prone) spine setup the question is raised again, where the tube-under orbit results in elevated dose to the anterior of the patient, a disadvantageous dose distribution for the breasts and gonads, while sparing the spinal cord. However, the tube-under orbit involves lower in-room dose (below), prepatient attenuation in the OR table, and somewhat improved space at tableside when the C-arm is in its normal position for fluoroscopy. The C-arm is capable of either orbit, and the possibility of a tube-over orbit for anterior dose sparing in prone patient setups is recognized, but should be weighed carefully versus factors of in-room dose and tableside ergonomics. In light of the various advantages listed above, the under-table tube orbit was maintained throughout these studies.
In-room exposure
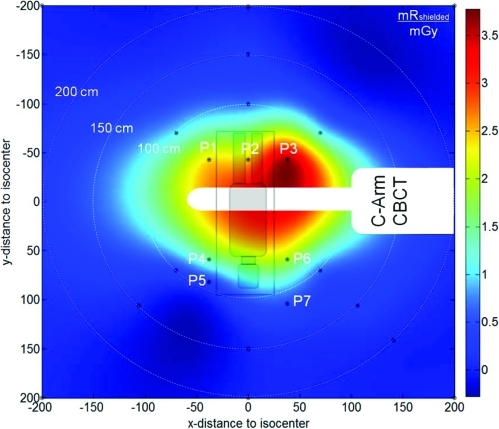
Measurements summarized in Fig. 5 and Table Table II. show the distribution of in-air exposure in the OR. The measured exposure was converted to shielded exposure (Pb apron) as detailed above. The shielded exposure for a “Bone Protocol” scan in the lumbar spine (Dw = 3.7 mGy) ranged from 8.8 mR (0.08 mSv) in proximity to table (43 cm) to <0.06 mR (<0.0005 mSv) at 2.0 m distance. Measurement position P3 experiences the highest in-air exposure due to proximity to the x-ray source and a mostly unobstructed scatter path. Other measurement positions in proximity to table side show about 50% less in-air exposure, attributable to higher scatter angle and a more obstructed path (Table Table II.). With distance to table the in-air exposure declined steeply by a factor of ∼5, ∼30, and ∼250 at 1, 1.5, and 2 m from isocenter (white concentric circles in Fig. 5). These measurements are ∼20% higher than those reported by Daly et al.18 for image-guided head-and-neck surgery, consistent with the larger scattering volume (abdomen and thorax). It bears reiteration that protocols currently in place for both preclinical experimentation and patient pilot studies involved zero dose to staff, since the protocols dictate stepping away from the table (behind a radiation barrier) during scan following ALARA principles.
Figure 5.
In-room exposure around the C-arm and operating table. The exposure values are in units of (mR) per unit scan dose (mGy) for a single CBCT scan, assuming a Pb apron as detailed in the text. Measurement points are marked with black circles, P1–P7 are typical staff positions in spine surgery (P1–P3: anesthesiologist, P4: surgeon, P5: nurse, P6–P7: surgical assistant). Per ALARA principles, staff either leaves the room or step behind a shield wall to receive near approximately zero radiation exposure.
Table 2.
In-air exposure, exposure rate, effective dose, and effective dose rate, assuming standard shielding apparel (Pb apron etc.) at locations about the table and throughout the operating room. The exposure (mR/mGy) and effective dose (mSv/mGy) are per unit absolute dose from a single CBCT scan. The corresponding exposure rate (mR/min) and effective dose rate (mSv/min) correspond to the rate during the scan.
| Position | Xshielded (mR/mGy) | Eshielded (mSv/mGy) | shielded (mR/min) | shielded (mR/min) |
|---|---|---|---|---|
| P1 – 57 cm | 2.38 | 0.021 | 2.23 | 0.020 |
| P2 – 43 cm | 2.48 | 0.022 | 2.33 | 0.021 |
| P3 – 57 cm | 3.61 | 0.033 | 3.38 | 0.031 |
| P4 – 70 cm | 1.90 | 0.017 | 1.78 | 0.016 |
| P5 – 90 cm | 0.49 | 0.004 | 0.46 | 0.004 |
| P6 – 70 cm | 1.40 | 0.013 | 1.31 | 0.012 |
| P7 – 110 cm | 0.36 | 0.003 | 0.34 | 0.003 |
| 1.0 m to isocenter | 0.79 | 0.007 | 0.74 | 0.007 |
| 1.5 m to isocenter | 0.13 | 0.001 | 0.12 | 0.001 |
| 2.0 m to isocenter | 0.01 | 0.0001 | 0.01 | 0.0001 |
Image quality in thoracic and lumbar spine
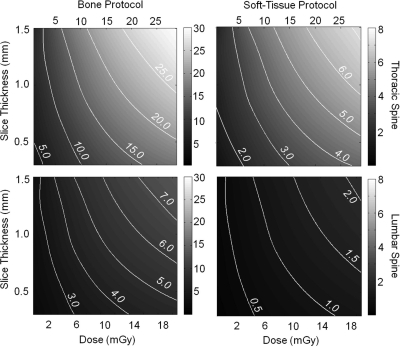
The effect of scan dose on CBCT image quality was evaluated for a range of tissue materials (bone and soft-tissue), dose (0.58–28.8 mGy), and voxel size (0.3 mm nominal isotropic voxel size, increased via MPR to 0.9 and 1.5 mm slice thickness). Figure 6 shows the CNR measured for bone (contrast 1073 HU) and soft-tissue (breast, contrast 171 HU) as a function of scan dose and slice thickness. Contour lines indicate levels of constant CNR, aiding in determining the lowest patient dose possible at a desired level of contrast and spatial resolution. The initial steep CNR improvements with increasing slice thickness level off above a thickness of 1.5 mm, especially for low dose acquisitions.
Figure 6.
CNR as a function of dose and slice thickness. Contour lines indicate constant CNR. (top) Bone and soft-tissue CNR in the thoracic spine. The less attenuating thoracic region yields higher bone visualization at comparable low radiation dose, as well as good soft-tissue visibility with high spatial resolution (MPR 0.9 mm). (bottom) Bone and soft-tissue CNR in the lumbar spine. Good bone detail visibility is achieved with a comparable low dose increase compared to the thoracic spine. Soft-tissue visibility in the more highly attenuating lumbar region requires increased dose to achieve acceptable CNR.
Two nominal dose protocols were identified—one for high-contrast bone visualization (denoted “Bone Protocol” and one for soft-tissue visualization (denoted “Soft-Tissue Protocol”) – separately for regions of the thoracic and lumbar spine, targeting a nominal slice thickness of 0.9 mm. These techniques defined a starting point for establishing scan protocols in image-guided surgical interventions. The “Bone Protocol” imparts a dose ∼1–2 mGy (thoracic) and ∼2–3 mGy (lumbar), corresponding to measured bone CNR of ∼5:1 and 3:1, respectively. The “Soft-Tissue Protocol” imparts ∼5 mGy (thoracic) and ∼10 mGy (lumbar), yielding soft-tissue CNR of ∼2:1 and 1:1, respectively. To reduce patient dose for soft-tissue imaging in the lumbar spine, a second dose protocol reducing dose while increasing slice thickness was also identified (1.5 mm slice thickness, CNR 1:1, ∼5 mGy). This protocol is advantageous to the higher resolution scan for repeat intraoperative scanning.
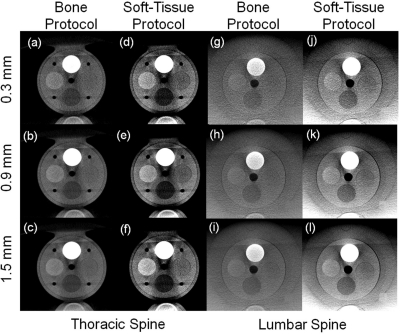
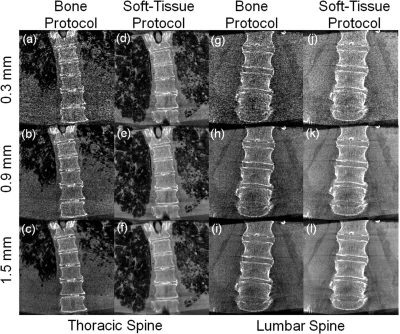
Selection of task-specific protocols involved a combination of quantitative and qualitative methods acknowledging the wide variety in patient habitus. We sought a minimum CNR = 3 for bone imaging and CNR = 1–2 for soft-tissue detail, assuming the former to involve higher spatial-frequency tasks than the latter. Qualitative analysis of C-arm CBCT images of the phantom (Fig. 7) and torso specimen (Fig. 8) was also considered. These criteria reflect trade-offs implicit in the well known Rose criterion, calling for a nominal CNR ∼ 3–5, while more recent studies in CBCT soft-tissue detectability35 suggest confident visualization at CNR ∼1–2. The latter work also involved detection tasks under conditions of known stimuli, analogous to visualization of surgical targets in image-guided surgery.
Figure 7.
Tissue-equivalent inserts in the thoracic and lumbar spine phantoms for “Bone Protocol” and “Soft-Tissue Protocol” at various slice thickness. (a–c) Bone detail in the thoracic spine suggests excellent visibility at thin slices with minimal degradation due to quantum noise. (d–f) Soft-tissue scans in the thoracic spine. Reduction in slice thickness shows substantially increased noise. (g–i) “Bone Protocols” in the lumbar spine, showing good bone visibility at thin slices. (j–l) “Soft-Tissue Protocol” scans in the lumbar spine. Increasing slice thickness yields improved soft-tissue visibility through decreasing noise.
Figure 8.
Thoracic and lumbar spine images of a cadaver scanned using “Bone Protocol” and “Soft-Tissue Protocol” settings, displayed with increasing slice thickness. (a–c) Bone detail visibility for thoracic “Bone Protocol”. (d–f) Soft-tissue thoracic scan protocol. Lung bronchi of 2nd and 3rd generations are easily discernable. (g–i) Low dose “Bone Protocol” acquisition in the lumbar spine. Bone windowing and increased slice thickness (0.9 mm) show good bone detail visualization. (j–l) Soft-tissue visibilities in the lumbar spine for the “Soft-Tissue Protocol (HiRes)” scan protocol. The lumbar paraspinalmuscles and adipose tissue running along the spine, as well as intervertebral discs, can be easily discerned at a slice thickness of 0.9 mm.
Figure 7 displays axial slices of the reconstructed tissue-equivalent inserts for the various scan protocols at varying slice thickness (0.3, 0.9, and 1.5 mm). Following the CNR results, the “Bone” protocol shows good visibility at all slice thicknesses [Figs. 7a–7c]. At 0.3 mm slice thickness, noise is more prominent, while the nominal slice thickness of 0.9 mm reduces both noise and artifacts. “Soft-Tissue Protocol” acquisitions show similar trends, with thin slices exhibiting increased noise, while slice averaging improves soft-tissue visibility at the cost of partial volume effects. All three soft-tissue inserts are easily discernable, concurring with the findings of Tward et al.35 regarding confident detection at CNR ∼1 and supporting the choice of acquisition protocol [Figs. 7d–7f]. Lumbar scans, and especially the “Bone Protocol”, exhibit similar trends as the thoracic scans [Figs. 7g–7i]. Reduction in slice thickness increases noise, but shading artifacts appear reduced compared to the thoracic protocols. Soft-tissue visibility is somewhat reduced in comparison to the thoracic spine, but “breast” and “inner bone” soft-tissue inserts are easily discernable [Figs. 7j–7l]. As expected, all images show the artifact associated with an incomplete arc (∼178°, resulting in a horizontal intensity variation at high contrast borders) and truncation artifacts (image intensity differences along the vertical axis, most pronounced at top and bottom).
A cadaveric torso was scanned using the same protocols and is displayed in Fig. 8. The moderately obese specimen showed high noise in the “Bone Protocol” when viewed at small slice thickness (0.3 mm). With increasing slice thickness, image quality improved through noise reduction [Figs. 8a–8c] at the cost of partial volume effects. In the coronal views the spinal column and intervertebral space could be easily discerned, while lung tissue visibility was reduced [Figs. 8a–8c]. The “Soft-Tissue Protocol” shows good visibility of both the lung bronchi up to 3rd and 4th generations and intervertebral discs [Figs. 8d–8f]. The lower dose “Bone Protocol” in the lumbar spine shows, similar to the thoracic spine, high susceptibility to noise, with improved image quality at increased slice thickness. Due to the specimen habitus, good image quality was only achieved for the highest slice thickness [1.5 mm, Figs. 8g–8i]. The “Soft-Tissue Protocol (HiRes)” for the lumbar spine, while approaching the dose of a diagnostic CT scan, provided good visibility of fat, muscle, and intervertebral discs at lower slice thickness (0.9 mm), suggesting a role primarily as a postprocedural high-quality scan [Fig. 8j–8l], rather than a repeat intraoperative scan.
Performance in image-guided, minimally invasive spine surgery
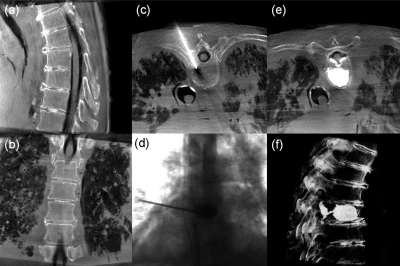
The protocols defined above were applied within a specific scenario of CBCT guidance of a vertebroplasty procedure with cement delivered to the thoracic and lumbar spine in a cadaveric specimen. In each case, an initial CBCT scan of the targeted region [Figs. 9a, 9b] was acquired and registered to preoperative CT, planning data, and the tracking system using the in-house navigation platform. The surgeon was presented with triplanar slice and volumetric views with interaction via tracked tools and the TREK navigation system.29 Incision points were identified for unipedicular approach to the vertebral body using real-time tracking registered to CBCT. Advancement of a tool through the pedicle (e.g., a tracked K-wire, trocar, Jamshidi needle, or a basic pointer tool) was continuously visualized in real-time with the tracking system, allowing the surgeon to assess tool trajectory and position without additional fluoroscopic exposure. Following placement in the vertebral body, a low dose (“Bone Protocol”) image was acquired to confirm correct placement, as illustrated in Fig. 9c. Upon confirmation of tool tip placement, PMMA cement was injected, using single-frame fluoroscopic images acquired on request to confirm appropriate fill of the vertebral body [Fig. 9d]. In these studies, ∼10–20 such images were acquired in the course of a single injection. Before removing the cannula, a “Bone Protocol” CBCT image was acquired to assess the distribution of cement within the vertebra [Fig. 9e]. Depending on the surgeon’s assessment of the distribution, more cement could be injected with the cannula repositioned if necessary. The surgeon “overfilled” the vertebral body intentionally in order to extravasate cement and breach the spinal canal to investigate whether the established imaging protocols allowed the detection of such extravasation. After removing the cannula and allowing the cement to harden, a “Soft-Tissue Protocol (HiRes)” scan was acquired to provide verification of the injection with respect to the vertebral body and surrounding soft-tissues (including anterior fat and muscle as well as the spinal dura) and to provide assessment of the final surgical product through volumetric rendering [Fig. 9f].
Figure 9.
Example images illustrating CBCT and fluoroscopy in the course of vertebroplasty. (a and b) Sagittal and coronal slices of a CBCT acquired prior to first incision (“Bone Protocol”). (c) Axial CBCT image showing the canula through the right mid-thoracic pedicle (“Bone Protocol”). (d) Single-frame fluoroscopy acquired during cement injection. (e) Axial CBCT image after cement injection (“Bone Protocol”). The cement is easily discernable, as is extravasation and breach of the spinal canal (imparted intentionally to test visualization of such complication). (f) Volumetric display of a CBCT scan acquired following the procedure [“Soft-Tissue Protocol (HiRes)”] for verification of the surgical product. The intentional cement leak into the spinal canal was easily seen as posterior extension of the cement through the basiverterbal vein and into the spinal canal (e and f).
The dose associated with the vertebroplasty scenario is summarized in Table Table III.. A single level thoracic vertebra treated by the workflow described above imparted a cumulative dose of 11.5 mGy. For the lumbar spine, the corresponding dose was 23.2 mGy. These values compare favorably to that reported for the conventional fluoroscopically guided approach (33.3–49.8 mGy/8.5–12.7 mSv36) and is well below the dose of a conventional chest/abdomen diagnostic CT. Dose to staff was correspondingly reduced: zero dose was imparted from each CBCT scan, since staff stepped back from tableside (behind a shield wall) during each scan, and fluoroscopy time was reduced from ∼5 to 11 min of fluoro time typical under conventional techniques19, 36, 37 to a series of ∼10–20 single-frames acquired during cement injection. The final “Soft-Tissue Protocol (HiRes)” CBCT verification scan may also suffice for postoperative evaluation of the surgical product, possibly obviating an additional postoperative CT. If further postoperative evaluation involving CT imaging is required, a “Soft-Tissue Protocol (LoRes)” scan could replace the high resolution scan.
Table 3.
Radiation dose associated with CBCT-guided vertebroplasty of the thoracic and lumbar spine using the task-specific protocols identified above. “Bone Protocol” and “Soft-Tissue Protocol (HiRes)” scan acquisitions are as in Table Table I.. Fluoroscopy dose during cement injection was approximated as ∼1 min of fluoroscopic time.
| Thoracic spine | Lumbar spine | ||
|---|---|---|---|
| Task | Acq. Type | Dw (mGy) | Dw (mGy) |
| Overview | Bone protocol | 1.81 | 3.16 |
| Needle placement | Bone protocol | 1.81 | 3.16 |
| Cement injection | Fluoro (<1 min) | 1.81 | 3.16 |
| Confirmation | Bone protocol | 1.81 | 3.16 |
| Post operation | Soft-tissue protocol (HiRes) | 4.26 | 10.6 |
| Total | 11.5 | 23.2 |
DISCUSSION AND CONCLUSION
This manuscript presents an evaluation of image quality and dose for flat-panel CBCT using a prototype mobile C-arm specifically in the context of minimally invasive spine surgery. It extends previous work in head-and-neck surgery8, 15, 16, 18, 27, 28 and cardiovascular interventions3 and provides a basis for study design in patient pilot studies carried out in future work. Task-specific dose protocols were delineated in a manner to minimize dose to the patient while maintaining image quality, and the dose and in-room exposure associated with intraoperative CBCT were quantified. Image quality was evaluated quantitatively in phantom and qualitatively in cadaver, and a vertebroplasty case study was presented that implemented the task-specific protocols and exercised the C-arm CBCT imaging system in combination with a surgical tracking and navigation system.
We evaluated image quality for patient doses ranging from 0.9 to 28.8 mGy for the thoracic spine and 0.6 to 20.6 mGy for the lumbar spine. With a standard reconstruction filter and a MPR slice thickness of 0.9 mm, scan protocols yielding sufficient image quality for surgical guidance were identified at techniques corresponding to 1.81 mGy (thoracic spine) and 3.16 mGy (lumbar spine) for bony visualization and 4.26 mGy (thoracic spine) and 5.1 and 10.6 mGy (lumbar spine) for low and high resolution soft-tissue visualization, respectively. These protocols are significantly below the dose of a standard diagnostic CT dose and support the notion of repeat intraoperative scanning for interventional guidance. Compared to O-Arm (Medtronic, Minneapolis, MN) intraoperative imaging systems, the literature implies similar dose levels but comments that soft-tissue imaging capability is fairly limited in current implementations.5, 6
In-room exposure was assessed for a variety of positions distributed around the surgical table as well as throughout the operating room. For example, for the lumbar spine “Bone Protocol” (which is in the middle range of dose for the various protocols examined, with scan duration of 64 s), the in-room exposure was 0.28 mSv/min at 100 cm from isocenter assuming a 0.5 mm Pb apron (i.e., 0.30 mSv/scan). For the other protocols, we have: thoracic Bone Protocol (0.13 mSv/min and 0.14 mSv/scan); thoracic Soft-Tissue protocol (0.25 mSv/min and 0.27 mSv/scan); and lumbar Soft-Tissue protocol (low-res, 0.43 mSv/min, and 0.46 mSv/scan). For comparison, the dose reported for conventional fluoroscopic interventions is 0.08–0.40 mSv/min19 (i.e., ∼0.9–4.4 mSv for a procedure involving 11 min fluoro time).
In all of the protocols employed to date—including patient pilot studies—the dose to staff from CBCT scans was zero, since workflow was modified such that staff stepped away from tableside, behind a shield wall, in a manner that allowed continuous patient monitoring. Fluoro time was reduced to <1 min (real-time imaging of cement injection) by virtue of up-to-date CBCT and real-time navigation. Reduction of in-room dose not only reduces the likelihood of long-term radiation effects21 but also allows the surgeon and staff to perform more procedures each year while staying within occupational limits.
A variety of limitations and areas of future investigation should be acknowledged. First, the dose values measured in CTDI and similar phantoms are consistent with the rapidly evolving methodology for dosimetry of volumetric X-ray beams, but they do not represent patient dose; moreover, the inhomogeneous distribution of dose imparted by C-arm half-scan acquisition deserves to be more fully investigated, both in terms of the adequacy of conventional effective dose conversion factors and the role of tube-under versus tube-over acquisition for prone and supine patient positions. Protocols appropriate to a broad spectrum of body habitus (including pediatric and obese patients) are yet to be identified. In-room dose was quantified in a manner similar to that for conventional fluoroscopic interventions, but the workflow associated with CBCT-guided interventions remains to be established – in particular, the practicality of stepping away from tableside for each CBCT scan, which has been implemented in research pilot studies in a manner that does not compromise patient safety but is yet to be tested in routine clinical care. The image quality results are representative of the state-of-the-art achieved with a mobile C-arm with a high-performance FPD and 3D filtered back-projection, but at least two areas of image quality improvement are underway. The first is more sophisticated management of x-ray scatter in CBCT, including the role of antiscatter grids38 and improved scatter correction techniques. The second is implementation of statistical/iterative reconstruction methods, which are likely to offer a significant boost in image quality and/or reduction in radiation dose.39 Finally, the C-arm itself represents the latest embodiment of a decade-long development of soft-tissue CBCT on a mobile C-arm, but numerous improvements will be achieved in an advanced clinical prototype. These are based upon a new C-arm designed specifically for soft-tissue CBCT guidance, including a high-power x-ray generator, improved geometric stability, additional FPD readout modes, and enhanced integration with surgical navigation and well defined, task-specific surgical workflow. The measurements reported above provide an important basis for translating C-arm CBCT to pilot studies and more routine clinical use.
ACKNOWLEDGMENTS
The authors acknowledge the support and assistance of faculty and staff at the Minimally Invasive Surgical Training Center (MISTC) at Johns Hopkins University, including Dr. Michael Marohn, Ms. Sue Eller, Ms. Katherine Braid, and Mr. Nicolas Louloudis. Research and collaboration with scientists at Siemens XP (Erlangen, Germany) is gratefully recognized, including numerous discussions and contributions from Dr. Rainer Graumann, Dr. Dieter Ritter, and Dr. Mattias Mitschke. The research was supported in part by academic-industry partnership with Siemens Healthcare and by National Institutes of Health R01 Grant No. CA-127444.
References
- Fahrig R., Dixon R., Payne T., Morin R. L., Ganguly A., and Strobel N., “Dose and image quality for a cone-beam C-arm CT system,” Med. Phys. 33(12), 4541–4550 (2006). 10.1118/1.2370508 [DOI] [PubMed] [Google Scholar]
- Kalender W. and Kyriakou Y., “Flat-detector computed tomography (FD-CT),” Eur. Radiol. 17, 2767–2779 (2007). 10.1007/s00330-007-0651-9 [DOI] [PMC free article] [PubMed] [Google Scholar]
- Boese G. Lauritsch J., Wigstrom L., Kemeth H., and Fahrig R., “Towards cardiac C-arm computed tomography,” Trans. Med. Imaging 25(7), 922–934 (2006). 10.1109/TMI.2006.876166 [DOI] [PubMed] [Google Scholar]
- Zbijewski W. and Stayman J. W., “Volumetric soft tissue brain imaging on xCAT, a mobile flat-panel X-ray CT system,” Proc. SPIE Med. Imaging 7258 (2009).
- Zhang J., Weir V., Fajardo L., Lin J., Hsiung H., and Ritenour E. E., “Dosimetric characterization of a cone-beam O-arm imaging system,” X-Ray Sci. Technol. 17(4), 305–317 (2009). [DOI] [PubMed] [Google Scholar]
- Zhang J., Weir V., Lin J., Hsiung H., and Ritenour E. R., “Image quality of a cone beam O-arm 3D imaging system,” Proc. SPIE Med. Imaging 725850–725850-8 (2009).
- Siewerdsen J. H., Daly M. J., Bachar G., Moseley D. J., Bootsma G., Brock K. K., Ansell S., Wilson G. A., Chhabra S., and Jaffray D. A., “Multimode C-arm fluoroscopy, tomosynthesis, and cone-beam CT for image-guided interventions: from proof of principle to patient protocols,” Proc. SPIE 65101A–65101A-11 (2007).
- Siewerdsen J. H., Daly M. J., Chan H., Nithiananthan S., Hamming N., Brock K. K., and Irish J. C., “High-performance intraoperative cone-beam CT on a mobile C-arm: an integrated system for guidance of head and neck surgery,” Proc. SPIE 72610J–72610J-8 (2009).
- Siewerdsen J. H., Moseley D. J., Burch S., Bisland S. K., Bogaards A., Wilson B. C., and Jaffray D. A., “Volume CT with a flat-panel detector on a mobile, isocentric C-arm: Pre-clinical investigation in guidance of minimally invasive surgery,” Med. Phys. 32(1), 241–254 (2005). 10.1118/1.1836331 [DOI] [PubMed] [Google Scholar]
- Siewerdsen J. H., Cone-beam CT with a flat-panel detector: From image science to image-guided surgery, Nucl. Instr. and Meth. A, doi: 10.1016/j.nima.2010.11.088, 2010. [DOI] [PMC free article] [PubMed]
- Khoury A., Siewerdsen J. H., Whyne C. M., Daly M. J., Kreder H. J., Moseley D. J., and Jaffray D. A., “Intraoperative cone-beam CT for image-guided tibial plateau fracture reduction,” Comput. Aided Surg. 12(4), 195–207 (2007). [DOI] [PubMed] [Google Scholar]
- Khoury A., Whyne C. M., Daly M. J., Moseley D. J., Bootsma G., Skrinskas T., Siewerdsen J. H., and Jaffray D. A., “Intraoperative cone-beam CT for correction of periaxial malrotation of the femoral shaft: A surface-matching approach,” Med. Phys 34(4), 1380–1387 (2007). 10.1118/1.2710330 [DOI] [PubMed] [Google Scholar]
- Jaffray D. A., Siewerdsen J. H., Edmundson G. K., Wong J. W., and Martinez A. A., “Flat-panel cone-beam CT on a mobile isocentric C-arm for image-guided brachytherapy,” Proc. SPIE 4682, 209–217 (2002). 10.1117/12.465561 [DOI] [Google Scholar]
- Schafer S., Uneri A., Mirota D., Nithananiathan S., Stayman J. W., Zbijewski W., Kleinszig G., Schmidgunst C., Sussman M., and Siewerdsen J. H., “C-arm cone-beam CT guidance of video-assisted thoracoscopic surgery (VATS): Image quality, dose, and integration with interventional guidance,” Int J CARS 6(1), S103–S104 (2011). [Google Scholar]
- Bachar G., Siewerdsen J. H., Daly M. J., Jaffray D. A., and Irish J. C., “Image quality and localization accuracy in C-arm tomosynthesis-guided head and neck surgery,” Med. Phys. 34(12), 4664–4677 (2007). 10.1118/1.2799492 [DOI] [PubMed] [Google Scholar]
- Bachar G., Barker E., Nithiananthan S., Chan H., Daly M. J., Irish J. C., and Siewerdsen J. H., “Three-dimensional tomosynthesis and cone-beam computed tomography: An experimental study for fast, low-dose intraoperative imaging technology for guidance of sinus and skull base surgery,” Laryngoscope 119(3), 434–441 (2009). 10.1002/lary.20089 [DOI] [PubMed] [Google Scholar]
- Barker E., Trimble K., Chan H., Ramsden J., Nithiananthan S., James A., Bachar G., Daly M. J., Irish J., and Siewerdsen J. H., “Intraoperative use of cone-beam computed tomography in a cadaveric ossified cochlea model,” Otolaryngology 140(5), 697–702 (2009). [DOI] [PMC free article] [PubMed] [Google Scholar]
- Daly M. J., Siewerdsen J. H., Moseley D. J., Jaffray D. A., and Irish J. C., “Intraoperative cone-beam CT for guidance of head and neck surgery: Assessment of dose and image quality using a C-arm prototype,” Med. Phys. 33(10), 3767–3780 (2006). 10.1118/1.2349687 [DOI] [PubMed] [Google Scholar]
- von Wrangel A., Cederblad A., and Rodriguez M.-Catarino, “Fluoroscopically guided percutaneous vertebroplasty: Assessment of radiation doses and implementation of procedural routines to reduce operator exposure,” Acta Radiol. 50(5), 490–496 (2009). 10.1080/02841850902855391 [DOI] [PubMed] [Google Scholar]
- Synowitz M. and Kiwit J., “Surgeon’s radiation exposure during percutaneous vertebroplasty,” Neurosurg.: Spine 4(2), 106–109 (2006). 10.3171/spi.2006.4.2.106 [DOI] [PubMed] [Google Scholar]
- Vano E., Gonzalez L., Fernandez J. M., Alfonso F., and Macaya C., “Occupational radiation doses in interventional cardiology: A 15-year follow-up,” Br. J. Radiol. 79(941), 383–388 (2006). 10.1259/bjr/26829723 [DOI] [PubMed] [Google Scholar]
- Cho Y., Moseley D. J., Siewerdsen J. H., and Jaffray D. A., “Accurate technique for complete geometric calibration of cone-beam computed tomography systems,” Med. Phys. 32(4), 968–983 (2005). 10.1118/1.1869652 [DOI] [PubMed] [Google Scholar]
- Roos P. G., Colbeth R. E., Mollov I., Munro P., Pavkovich J., Seppi E. J., Shapiro E. G., Tognina C. A., Virshup G. F., and Yu J. M., “Multiple-gain-ranging readout method to extend the dynamic range of amorphous silicon flat-panel imagers,” Proc. SPIE 5368, 139–149 (2004). 10.1117/12.535471 [DOI] [Google Scholar]
- Navab N., Bani A.-Hashemi, Nadar M., Wiesent K., Durlak P., Brunner T., Barth K., and Graumann R., “3D reconstruction from projection matrices in a C-arm based 3D-angiography system,” MICCAI’98, Lecture Notes in Computer Science, Volume 1496/1998, 119–129, 1998. [Google Scholar]
- Schmidgunst C., Ritter D., and Lang E., “Calibration model of a dual gain flat panel detector for 2D and 3D X-ray imaging,” Med. Phys. 34(9), 3649–3664 (2007). 10.1118/1.2760024 [DOI] [PubMed] [Google Scholar]
- Mirota D., Wang H., Taylor R., Ishii M., and Hager G., “Toward Video-Based Navigation for Endoscopic Endonasal Skull Base Surgery,” MICCAI 2009, Lecture Notes in Computer Science, Volume 5761/2009, 91–99, 2009. [DOI] [PMC free article] [PubMed] [Google Scholar]
- Nithiananthan S., Brock K. K., Daly M. J., Chan H., Irish J. C., and Siewerdsen J. H., “Demons deformable registration for CBCT-guided procedures in the head and neck: Convergence and accuracy,” Med. Phys. 36(10), 4755–4764 (2009). 10.1118/1.3223631 [DOI] [PMC free article] [PubMed] [Google Scholar]
- Nithiananthan S., Brock K. K., Daly M. J., Chan H., Irish J. C., and Siewerdsen J. H., “Demons deformable registration for cone-beam CT guidance: registration of pre- and intra-operative images,” Proc. SPIE 76250L–76250L-7 (2010).
- Uneri A., Schafer S., Mirota D., Nithiananthan S., Otake Y., Reaungamornrat S., Yoo J., Stayman J. W., Reh D., Gallia G., Khanna A. J., Hager G., Taylor R., Kleinszig G., and Siewerdsen J. H., “Architecture of a high-performance surgical guidance system based on C-arm cone-beam CT: Software platform for technical integration and clinical translation,” Proc. SPIE 796422–796422-7 (2011).
- Khan F. M., The Physics of Radiation Therapy (Williams & Wilkins, Baltimore, 1984). [Google Scholar]
- Kroon J. N., “3-Dimensional rotational X-ray imaging, 3D-RX: Image quality and patient dose simulation for optimisation studies,” Radiat. Prot. Dosim. 114, 341–349 (2005). 10.1093/rpd/nch576 [DOI] [PubMed] [Google Scholar]
- Webster E. W., “EDE for exposure with protective aprons,” Health Phys. 56(4), 568–569 (1989). [PubMed] [Google Scholar]
- Watanabe Y., “Derivation of linear attenuation coefficients from CT numbers for low-energy photons,” Phys. Med. Biol. 44(9), 2201–2211 (1999). 10.1088/0031-9155/44/9/308 [DOI] [PubMed] [Google Scholar]
- Yushkevich P. A., Piven J., Hazlett H. C., Smith R. G., Ho S., Gee J. C., and Gerig G., “User-guided 3D active contour segmentation of anatomical structures: Significantly improved efficiency and reliability,” NeuroImage 31(3), 1116–1128 (2006). 10.1016/j.neuroimage.2006.01.015 [DOI] [PubMed] [Google Scholar]
- Tward D. J., Siewerdsen J. H., Daly M. J., Richard S., Moseley D. J., Jaffray D. A., and Paul N. S., “Soft-tissue detectability in cone-beam CT: Evaluation by 2AFC tests in relation to physical performance metrics,” Med. Phys. 34(11), 4459–4471 (2007). 10.1118/1.2790586 [DOI] [PubMed] [Google Scholar]
- Perisinakis K., Damilakis J., Theocharopoulos N., Papadokostakis G., Hadjipavlou A., and Gourtsoyiannis N., “Patient exposure and associated radiation risks from fluoroscopically guided vertebroplasty or kyphoplasty,” Radiology 232(3), 701–707 (2004). 10.1148/radiol.2323031412 [DOI] [PubMed] [Google Scholar]
- Mroz T. E., Yamashita T., Davros W. J., and Lieberman I. H., “Radiation exposure to the surgeon and the patient during kyphoplasty,” Spinal Disord. Tech. 21(2), (2008). [DOI] [PubMed] [Google Scholar]
- Siewerdsen J. H., Moseley D. J., Bakhtiar B., Richard S., and Jaffray D. A., “The influence of antiscatter grids on soft-tissue detectability in cone-beam computed tomography with flat-panel detectors,” Med. Phys. 31(12), 3506–3520 (2004). 10.1118/1.1819789 [DOI] [PubMed] [Google Scholar]
- Bian J., Siewerdsen J. H., Han X., Sidky E. Y., J.Prince L., C.Pelizzari A., and Pan X., “Evaluation of sparse-view reconstruction from flat-panel-detector cone-beam CT,” Phys. Med. Biol. 55, 6575–6599 (2011). 10.1088/0031-9155/55/22/001 [DOI] [PMC free article] [PubMed] [Google Scholar]


