Abstract
Purpose: Localization prior to delivery of SBRT to free-breathing patients is performed by aligning the planning internal target volume (ITV) from 4DCT with an on-board free-breathing cone-beam CT (FB-CBCT) image. The FB-CBCT image is assumed to also generate an ITV that captures the full range of motion, due to the acquisition spanning multiple respiratory cycles. However, the ITV could potentially be underestimated when the ratio of time spent in inspiration versus time spent in expiration (I/E ratio) deviates from unity. Therefore, the aim of this study was to investigate the effect of variable I/E ratios on the FB ITV generated from a FB-CBCT scan.
Methods: This study employed both phantom and patient imaging data. For the phantom study, five periodic respiratory cycles were simulated with different I/E ratios. Six patient respiratory cycles with variable I/E ratios were also selected. All profiles were then programmed into a motion phantom for imaging and modified to exhibit three peak-to-peak motion amplitudes (0.5, 1.0, and 2.0 cm). Each profile was imaged using two spherical targets with 1.0 and 3.0 cm diameters. 2D projections were acquired with full gantry rotation of a kiloVoltage (kV) imager mounted onto the gantry of a modern linear accelerator. CBCT images were reconstructed from 2D projections using a standard filtered back-projection reconstruction algorithm. Quantitative analyses for the phantom study included computing the change in contrast along the direction of target motion as well as determining the area (which is proportional to the target volume) inside of the contour extracted using a Canny edge detector. For the patient study, projection data that were previously acquired under an investigational 4D CBCT slow-gantry imaging protocol were used to generate both FB-CBCT and 4D CBCT images. Volumes were then manually contoured from both datasets (using the same window and level) for quantitative comparison.
Results: The phantom study indicated a reduction in contrast at the inferior edge of the ITV (corresponding to inspiration) as the ratio decreased, for both simulated and patient respiratory cycles. For the simulated phantom respiratory cycles, the contrast reduction of the smallest I/E ratio was 27.6% for the largest target with the smallest amplitude and 89.7% for the smallest target with the largest amplitude. For patient respiratory cycles, these numbers were 22.3% and 94.0%, respectively. The extracted area from inside of the target contours showed a decreasing trend as the I/E ratio decreased. In the patient study, the FB-CBCT ITVs of both lung tumors studied were underestimated when compared with their corresponding 4D CBCT ITV. The underestimations found were 40.1% for the smaller tumor and 24.2% for the larger tumor.
Conclusions: The ITV may be underestimated in a FB-CBCT image when a patient’s respiratory pattern is characterized by a disparate length of time spent in inspiration versus expiration. Missing the full target motion information during on-board verification imaging may result in localization errors.
Keywords: cone-beam CT, localization, on-board imaging, organ motion, image-guided radiotherapy
INTRODUCTION
The success of radiotherapy relies on the accurate delivery of radiation, with maximum dose delivered to the target and minimal dose delivered to surrounding healthy tissue. Mobile tumors such as lung cancer, present a challenge to all steps of the treatment process, from simulation to localization and finally with delivery of radiation. Due to the wide prevalence of this disease, there has been a large amount of work on the development of motion management techniques, especially because studies have shown that respiration widely varies from patient to patient.1 The advent of four-dimensional CT (4DCT) is one example that allows motion assessment, by providing volumetric information of the tumor as it moves during the respiratory cycle.2, 3, 4, 5, 6 In order to incorporate this information into the treatment process, the International Commission on Radiation Units and Measurements report 62 (ICRU62) defined the internal target volume (ITV) for mobile tumors to include the full range of target motion during respiration.7
Once a 4D planning model has been established and the ITV has been contoured, the next crucial step in the delivery of radiation therapy with motion management is to localize the target volume with on-board imaging prior to treatment delivery. Currently, cone-beam CT (CBCT) is widely used during the verification process when 3D information is required. Multiple studies have demonstrated the benefits of CBCT imaging, including large improvements in localization error and reduced margins due to its soft-tissue matching capabilities.8, 9, 10, 11, 12 Ideally, CBCT imaging and treatment could both be performed within the duration of a breath-hold, to minimize the interplay of motion and facilitate matching of a static target. For patients and treatments that satisfy these conditions, CBCT imaging has proven to be an important tool in the localization process.13, 14 Unfortunately, however, not all patients are capable of holding their breath and, thus, must be imaged and treated under free-breathing (FB) conditions.
This additional variable of motion provides another potential source of error for localization, which is especially troubling for stereotactic body radiation therapy (SBRT), a treatment that relies on extremely accurate target localization due to the limited number of fractions and high dose per fraction. The typical clinical procedure for free-breathing treatments involves calculating the dose on the average CT image, but then localizing the target according to the 4DCT ITV contour.15 An average CT is generated by taking the average pixel values from all phase images of the 4DCT dataset. The 4DCT ITV contour on the other hand is generated from the maximum intensity projection (MIP) image, which takes the maximum pixel values across all phase images. Real-time target verification is performed with a FB-CBCT image, whose acquisition spans multiple respiratory cycles and so this image is meant to represent the time-averaged position of the target. The average CT image should also theoretically display the time-averaged position of the target, but due to the different nature of CT image acquisition and reconstruction, average CT images are often prone to artifacts that can lead to disparities from CBCT images. Because the 4DCT ITV contour generated from the MIP is meant to represent the area where the tumor moves, it is crucial to place the ITV generated from FB-CBCT inside of the 4DCT ITV contour.
The use of the FB-CBCT ITV for localization with a planning 4DCT ITV for SBRT was investigated by Wang et al.16 In their study, four sinusoidal profiles were input into a dynamic phantom with different period lengths and motion amplitudes, and the 4DCT ITV was compared with the ITV generated from FB-CBCT. These volumes were also compared for two lung cancer patients undergoing SBRT. The results demonstrated that this was a feasible technique for on-board verification because the volumes (phantom and patients) between 4DCT ITV and FB-CBCT ITV matched fairly well. However, the study mainly focused on sinusoidal shaped respiratory profiles that follow a consistent trajectory in their phantom experiments. Respiratory characteristics such as breathing profile and motion amplitude were not specified for the two patient cases. Thus, it is important to note that patients often do not exhibit such regular respiration and, in fact, experience a multitude of breathing variabilities. One in particular that caught our attention was the tendency to spend more time exhaling than inhaling during respiration.
If a patient presents with such respiratory characteristics, we hypothesize that the FB-CBCT ITV is likely to underestimate the true range of motion due to the nature of CBCT image acquisition and reconstruction. This is because there will be a greater number of projections acquired during the exhalation phase, leading to a higher contrast of the target at that location. Depending on how severe the disparity between inspiration and expiration is, the contrast reduction for the inspiration phase may be extreme enough to degrade the visibility of the target during that phase. This effect could then cause underestimation of the ITV, which may potentially result in localization errors due to incorrect center-to-center matchup. It is therefore the aim of this study to investigate the effects such a breathing disparity may have on the ITV generated by a FB-CBCT dataset.
METHODS AND MATERIALS
Phantom data study
Respiratory cycles
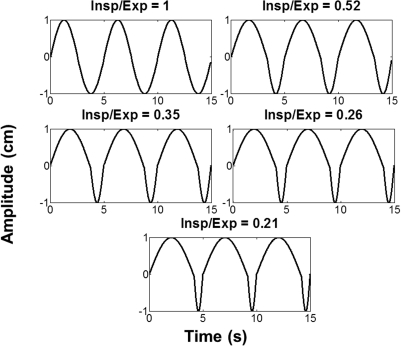
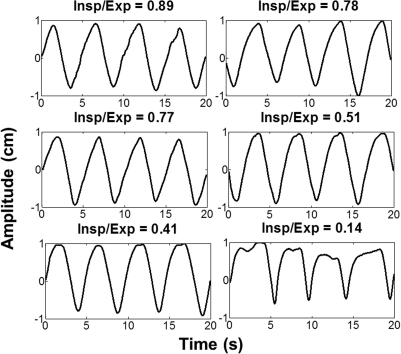
In order to examine the effect of unequal time spent in inspiration as compared with expiration, sinusoidal profiles exhibiting these disparities were simulated with MATLAB software (The Mathworks, Inc. Natick, Massachusetts). Five respiratory cycles, depicted in Fig. 1, were generated with average inspiration to expiration (I/E) ratios of 1.0, 0.52, 0.35, 0.26, and 0.21. These were calculated by taking the ratio of the number of points that were within 25% of the peak inhale and exhale portions of the cycle and averaging over 60 s of respiration. However, most patients do not exhibit ideal sine curve breathing patterns with constant peak amplitudes. Therefore, similar disparities in the presence of natural variations in respiratory amplitudes and durations of respiratory cycles were studied by simulating patient respiratory motion traces. Respiratory motion traces are used and recorded during 4DCT scans in our clinic. Varian’s Real-time Position Management device (RPM) (Varian Medical Systems, Palo Alto, CA) is used to obtain traces by tracking markers placed on the patient’s abdomen. We selected six motion traces to use as templates for simulating natural respiratory motion with our motion phantom.
Figure 1.
Simulated respiratory profiles with five different inspiration to expiration ratios with a motion amplitude of 2 cm.
The patient respiratory profiles were chosen in a manner such that they exhibited a minimal amount of other breathing irregularities (such as baseline drift and inconsistent peak amplitudes) and displayed a variety of I/E ratios. They were also chosen to exhibit fairly continuous motion with no abrupt fluctuations (as can often be seen in RPM data) to more realistically model tumor motion. The profiles were normalized and then smoothed in order to remove the jaggedness that is typically present in patient RPM data prior to input into the phantom. The six patient respiratory profiles used are shown in Fig. 2.
Figure 2.
Smoothed and normalized patient respiratory profiles with six varying inspiration to expiration ratios plotted as a function of 2 cm amplitude.
Image acquisition
The 11 respiratory profiles were input into a CIRS model 008 dynamic thorax phantom (CIRS Inc., Norfolk, VA) for imaging. All profiles were input in such a way that one respiratory cycle of each is approximately 5 s in duration. The phantom represents an average thorax in terms of size and composition and consists of a cylindrical rod mounted to a motion actuator box, which can create three-dimensional motion through translation and rotation. Spherical targets (ρ = 1.04 g/cm3) of different sizes can be inserted into the lung equivalent rod (ρ = 0.21 g/cm3). In our case, we employed two target diameters of 1.0 and 3.0 cm and only examined superior–inferior motion of the targets with three amplitudes of 0.5, 1.0, and 2.0 cm to emulate small, medium, and large motions of small and large sized tumors. Sixty-six FB-CBCT scans were acquired to obtain images for the 11 respiratory profiles, each with 6 variables.
These 66 different scenarios were imaged with an On-Board Imager® (OBI) kiloVoltage (kV) imaging system (Varian Medical Systems, Palo Alto, CA). The OBI imager consists of a kV x-ray tube and a flat-panel detector, which measures 40 × 30 cm2 in size with a pixel matrix of 2048 × 1536 pixels and pixel pitch of 194 μm. The acquired kV projections were downsampled to a matrix size of 512 × 384 for reconstruction. The digital projections were acquired with a full-fan bow-tie filter and the following exposure parameters: 100 kVp, 80 mA, and 25 ms per projection. Approximately 680 projections were collected per CBCT acquisition, which encompassed a 360° rotation around the isocenter. The scan took approximately 60 s. For the majority of the profiles, a single CBCT was acquired. However, four profiles were selected for 4D CBCT reconstruction and so five FB-CBCTs were acquired for each of those profiles, in order to have an adequate number of projections. The four selected profiles (two simulated and two patients) were imaged with a target diameter of 3.0 cm and motion amplitude of 2.0 cm. For these profiles, the first of the five CBCTs acquired was chosen for FB-CBCT reconstruction. The phantom location remained stationary for all acquisitions, and only the profile and/or tumor size changed per scenario, so that calculations made on all cases could be appropriately compared.
3D and 4D CBCT image reconstruction
Volumes of 512 × 320 × 401 with in-plane pixel size of 0.507 mm2 and plane spacing of 0.5 mm were reconstructed with a Feldkamp-type algorithm.17, 18 It is important to note that this reconstruction algorithm incorporates a blank scan, in order to correct for the inhomogeneities present in each beam as a result of the bow-tie filter and anode heel effect. Volumes were reconstructed per respiratory profile, target size, and motion amplitude. Figure 3 presents a sample of what the resultant images look like for the five simulated sinusoidal profiles for the case of a 3.0 cm target with 2.0 cm of motion.
Figure 3.
FB-CBCT images of the five simulated respiratory profiles. The ratio of time spent in inspiration to expiration is indicated on the bottom right corner of each FB-CBCT.
The same algorithm and reconstruction parameters were applied for reconstructing phase images from sorted projections for a 4D CBCT dataset. 4D CBCT has been investigated to potentially serve as a motion management technique for the verification stage of radiotherapy as compared with 4DCT, which is used to manage motion during the planning stage. The implementation of 4D CBCT involves acquiring projections over multiple respiratory cycles with an on-board imager (kV or MV) so that they can be retrospectively sorted and binned according to either amplitude or phase. The binned projections are then reconstructed and provide volume images of the target for certain periods of respiration. The reconstructed dataset, thus, supplies us with the information of how the target moves during respiration.19, 20, 21, 22, 23, 24, 25, 26
In order to reconstruct 4D CBCT phase images of select respiratory profiles imaged with the dynamic phantom, a respiratory signal was first generated from each of the five sets of projections by manually tracking the motion of the target. Projections corresponding to the peak inspiration phase (0%), where phase is defined as the percentage of the respiratory cycle that has passed since peak inspiration, were recorded. Peak inspiration was identified as the most inferior position of the target throughout the projection dataset. A MATLAB script was then implemented to take this information and linearly interpolate the sorting of projections into ten phase bins (0%–100%) with 10% phase windows. The ten phase bins were centered at 0, 10, 20, 30%, etc., with a 5% window on each side, so that the 20% phase bin corresponds to a 15%–25% phase range. Since peak inspiration corresponds to the 0% phase, peak expiration subsequently corresponds to the 50% phase bin. This binning convention for 4D image reconstruction is consistent with what is currently being implemented by other investigators.
Once each of the CBCTs was sorted and binned, projections were then combined from all five datasets, according to phase bin. Bins 0 and 50% were then individually reconstructed using the aforementioned Feldkamp reconstruction technique. Typically when reconstructing 4D phase images from a single CBCT scan, a severe degradation of image quality occurs due to limited sampling and large angular gaps between projections. While this would require some sort of postprocessing27, 28, 29, 30, 31 to ensure that the resulting reconstructions are reliable, this was not performed in this study because instead five sets of CBCT scans were combined retrospectively in order to increase the amount of projections per bin and consequently eliminate such artifacts. Alternatively, these artifacts can be avoided by appropriately adjusting the image acquisition and reconstruction parameters according to a patient’s specific respiratory cycle.32
The purpose of the 4D CBCT images was for visual comparison to the FB-CBCT images, in order to demonstrate the full extent of the target motion. All quantitative analyses were performed solely on the FB-CBCT reconstructions.
Contrast reduction
The main goal of this study was to characterize the effect that different inspiration to expiration durations would have on the image of a moving target. We hypothesized that the main effect of spending a longer time in expiration than in inspiration would result in a decrease in contrast of the target at the location corresponding to inspiration, due to fewer projections of that phase input into the reconstruction. In order to quantify this potential loss of contrast, regions-of-interest (ROIs) were selected of 100 by 5 pixels (length× width) for the 1.0 cm tumor and 150 × 5 pixels for the 3.0 cm tumor to measure the reconstructed intensity values in a single coronal slice. We chose the coronal plane to study the superior–inferior motion of the target, but a sagittal reconstruction would have worked as well. The five columns of each ROI were averaged together to represent a line profile along the direction of target motion. The number of columns averaged did not impact the results.
Since the phantom body remained stationary throughout all acquisitions, the appropriate ROI was applied to the same slice of all FB-CBCT images in the same location, per target size. The local contrast was calculated along this line, where Ib is the background pixel value and It is the target pixel:
| (1) |
Ib was calculated by taking the average pixel value in an ROI of 10 × 10 pixels placed on the background signal, adjacent to the target. It corresponded to the averaged pixel value along the line profile. The contrast was then plotted as a function of target size and motion amplitude per group of respiratory profiles (i.e., simulated or patient).
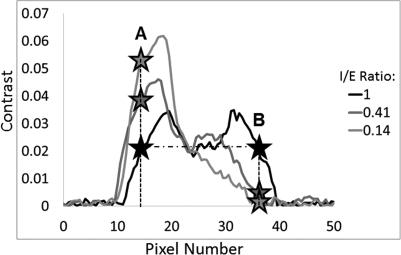
The reduction in contrast was then computed by selecting pixel locations according to the “ideal” sinusoidal respiratory cycle with a 1:1 I/E ratio. These pixels were selected such that they exhibited the same contrast along the extreme ends of the target motion of the ideal respiration. This is demonstrated with the two black stars along the same horizontal dotted line of the black curve labeled 1 in Fig. 4. (The legend in Fig. 5 indicates the I/E ratio per curve.) These same pixel locations were then selected for all of the other line profiles (per target size and amplitude), as depicted with the different color stars along the vertical dashed lines in the figure. The contrast at these two points was compared and the percent reduction of point B relative to point A was calculated and tabulated for all 66 cases:
| (2) |
Figure 4.
Demonstration of the calculation of percentage contrast reduction along the direction of motion of the ITV from the FB-CBCT image.
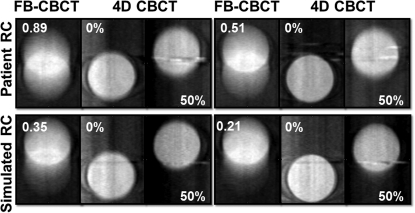
Figure 5.
FB and 4D phase images of two patient respiratory profiles (top row) and two simulated respiratory profiles (bottom row). The number indicated on FB image represents the inspiration to expiration ratio, whereas the percentage indicated on the adjacent images represents the phase bin. Peak inspiration corresponds to 0% and peak expiration corresponds to 50%.
Area reduction
In order to further correlate the effects on contrast with the displayed motion, the visible area on the FB-CBCT image generated per respiratory profile, tumor size, and motion amplitude was calculated. This was first implemented by objectively locating the contour with an image-processing technique known as Canny edge detection17 using MATLAB software. The function allows the adjustment of the two thresholds used for detecting strong and weak edges, as well as the sigma of the Gaussian filter, which determines the size of the smoothing filter that is convolved with the image prior to application of the thresholds.
The two thresholds were automatically selected by the algorithm for each image because this allowed the algorithm to most easily pick up the entire contour. Applying an identical threshold to all cases often resulted in disconnected contours. Three different sigmas (σ = 1, 2, and 3) were implemented, while the thresholds were kept constant per image, in order to have an objective measure of the contours as a function of sigma. Once the contours were obtained, the area (i.e., the number of pixels inside of the contour) was calculated across all images per sigma value. These areas were then plotted as a function of respiratory profile, target size, motion amplitude, and sigma value.
Patient data study
Data acquisition and reconstruction
Volume underestimation was also demonstrated using patient data that was previously acquired with a slow-gantry rotation technique.23 The specific data used for this study were of a lung cancer patient with two different size posterior lung tumors, one in each lung. The slow-gantry CBCT acquisition resulted in a total of 1983 projections, which were then used to reconstruct both FB-CBCT and 4D CBCT images.
Approximately 400 projections were evenly selected from the full (unsorted) dataset to reconstruct a FB-CBCT. These projections were then input into the aforementioned algorithm for reconstruction of output volumes of 512 × 320 × 401 with 0.507 mm2 pixel size and 0.5 mm slice thickness.
As before, the respiratory signal was derived from manual tracking of structures in the projection images for 4D CBCT reconstruction. The same convention of ten phase bins with 10% phase windows was applied to the sorting process. Upon completion of sorting, reconstruction volumes per respiratory phase were produced with the Feldkamp-like algorithm.
Volume underestimation
For the patient case, there was obviously no gold-standard respiratory profile with perfect periodic motion available, and so comparing contrast calculations was not feasible. Instead, the effect of disparate respiration was evaluated by comparing volumes between FB-CBCT and 4D CBCT dataset. Thus, once all of the 11 reconstruction volumes were generated (ten phases + FB-CBCT), they were converted into Digital Imaging and Communications in Medicine files for importing into Eclipse Treatment Planning System (Varian Medical Systems, Palo Alto, CA). Both tumors were then manually contoured on each dataset, starting with the FB-CBCT volume first. Using the Boolean operators present in the software, the contours from each of the ten phases of the 4D CBCT were combined in order to obtain the 4D ITV. The FB ITV was calculated from the FB-CBCT dataset and then compared with the 4D ITV for both tumors, using the following equation:
| (3) |
RESULTS
Phantom study
Figure 3 displays the FB-CBCT images produced of a 3.0 cm target moving 2.0 cm in amplitude for each of the simulated respiratory profiles. These images visually demonstrate what happens to the ITV in a FB-CBCT image as the deviation between time spent in inspiration versus expiration increases. It is evident that as this disparity becomes more severe, the contrast decreases in the inferior portion of the ITV—the location of the target during the inspiration phase.
This problem is further highlighted in Fig. 5, where FB-CBCT images are displayed adjacent to the 4D CBCT images of the target at the 0 and 50% phases of the respiratory cycle. Two patient and two simulated respiratory profiles, all with different I/E ratios are depicted in the figure. As the I/E ratio (marked in the top left corner of the FB-CBCT image) decreases, we see that the full extent of target motion is much more obvious with the 4D phase images than solely with the free-breathing image. It is important to note that the metal streak artifacts (caused by a localization marker embedded in the phantom) in the 4D CBCT are more conspicuous than those in the FB-CBCT due to the limited number of projections in the phase reconstructions for 4D CBCT.
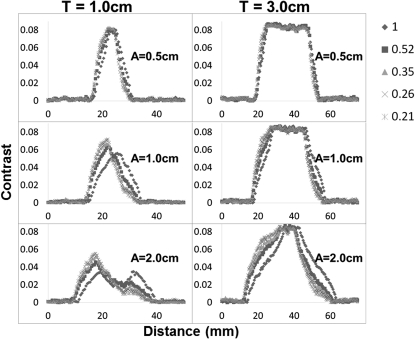
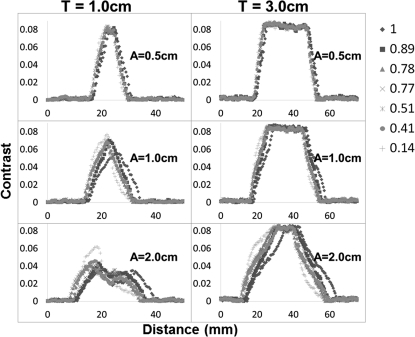
Figures 67 provide quantitative validation of what is visually observed in the images of Fig. 3, for all respiratory profiles, target sizes, and motion amplitudes. Local contrast is the metric that is plotted on the y-axis of each plot, along the direction of motion of the target. The changes in plot shape that are illustrated in the figures allow us to infer that this type of breathing disparity is more consequential for smaller tumors that move large amplitudes rather than large tumors that move very little. This is clearly demonstrated by the two-peak curve (I/E = 1.0) transforming into a single-peak curve (I/E = 0.21) for the 1.0 cm target moving 2.0 cm in amplitude versus a relatively unchanged shape for all profiles of the 3.0 cm target moving only 0.5 cm in amplitude. The loss of the second peak essentially represents a loss of contrast or disappearance of the target at the inferior portion of the ITV, so that it looks like it is only located at the superior location. This effect is further confirmed by the results in Table TABLE I., which reports the percentage of contrast reduction that occurs along the direction of motion for each case.
Figure 6.
The local contrast computed along line profiles of the FB-CBCT images of the simulated respiratory cycles for both target sizes (T) and all three motion amplitudes (A). The legend on the right indicates the correlation between respiratory profile and marker shape.
Figure 7.
Local contrast plotted for patient respiratory profiles along the direction of motion in the FB-CBCT images for all target sizes (T) and motion amplitudes (A), in addition to the gold-standard profile, which has a perfect simulated inspiration to expiration ratio of one. The legend relates each respiratory profile with its corresponding marker shape.
Table 1.
Percentage of contrast reduction computed from FB-CBCT images of motion phantom for all cases. The first five rows of the table display the results for the simulated respiratory cycles and the last six rows depict the results for the patient respiratory cycles. T represents target size and A represents amplitude, both in centimeters so that T1A0.5 = 1.0 cm target and 0.5 cm amplitude, T3A2 = 3.0 cm target and 2.0 cm amplitude, etc.
| Insp/exp ratio | T1A0.5 contrast reduction (%) | T1A1 contrast reduction (%) | T1A2 contrast reduction (%) | T3A0.5 contrast reduction (%) | T3A1 contrast reduction (%) | T3A2 contrast reduction (%) |
|---|---|---|---|---|---|---|
| 1 | 0.2 | 0.8 | 0.5 | 4.2 | 0.1 | 0.4 |
| 0.51 | 37.9 | 59.1 | 66.2 | 7.4 | 35 | 39 |
| 0.35 | 53.9 | 77 | 76.4 | 20 | 45.4 | 46.4 |
| 0.26 | 61.1 | 82.4 | 82.7 | 24.6 | 49.7 | 51.1 |
| 0.21 | 67.3 | 87.2 | 89.7 | 27.6 | 50.8 | 54 |
| 0.89 | 18.4 | 50.3 | 49.7 | 9.4 | 25.9 | 25.7 |
| 0.78 | 30.3 | 61.2 | 70.6 | 16.3 | 34 | 32.9 |
| 0.77 | 16.7 | 79 | 97.3 | 28.1 | 42.2 | 44.5 |
| 0.51 | 51.3 | 74.3 | 88.5 | 29.9 | 44.6 | 48.7 |
| 0.41 | 41.4 | 68.2 | 81.5 | 22.1 | 43.9 | 43.1 |
| 0.14 | 73.1 | 92.6 | 94 | 22.3 | 55.4 | 64.9 |
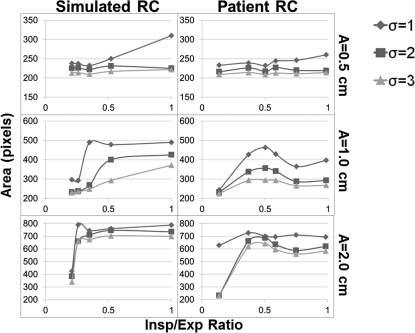
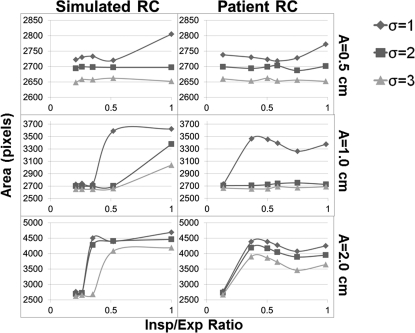
Although the line profiles and contrast reduction calculations explain what is visually taking place, a more relevant task to radiation oncology would be to observe the effect of this specific breathing disparity on the contour of the target displayed by the FB-CBCT. These contours were determined using Canny edge detection and the areas within them are plotted in Figs. 89. As expected, these data lead to similar conclusions about the effect of decreasing the I/E ratio on the FB-CBCT image. The plots show the general decreasing trend in the area picked up by the algorithm as the disparity becomes more severe for all profiles, tumor sizes, motion amplitudes, and sigma values. It is also evident that as the standard deviation of the smoothing filter of the algorithm is increased, the area inside of the extracted contour becomes relatively smaller.
Figure 8.
Area in pixels calculated using Canny edge detection for the 1.0 cm target for both simulated and patient respiratory profiles. The area is computed as a function of the standard deviation of the filter used by the image-processing technique.
Figure 9.
The results for the pixel area computed using Canny edge detection on the FB-CBCT images of the 3.0 cm target for all respiratory profiles (simulated and patient) for three sigma values. These sigma values represent the standard deviation of the filter used to determine the edges by the algorithm.
Patient study
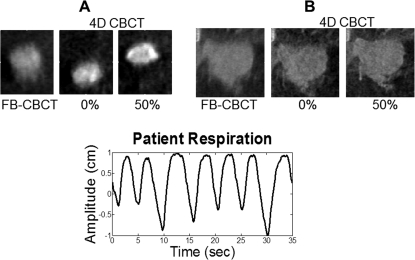
The lung patient data further demonstrate the potential for underestimation of the ITV generated from a FB-CBCT (average I/E ratio = 0.307). Figure 10 presents adjacent coronal FB-CBCT and 4D CBCT (0 and 50%) phase images of the two tumors studied in this patient, as well as the patient’s breathing pattern. The results comparing the volumes contoured from free-breathing CBCT data versus 4D CBCT data are given in Table TABLE II.. It is apparent that the ITV derived from the FB-CBCT is underrepresented as compared to the ITV derived from the 4D CBCT for both the small (A) and large (B) tumor.
Figure 10.
Coronal slices of FB-CBCT and 4D CBCT phase images for the lung cancer patient tumors along with the corresponding RPM profile.
Table 2.
Percent underestimation of the 4D CBCT ITV by the FB-CBCT ITV for both patient lung tumors A and B.
| Tumor | Free-breathing ITV (cm3) | 4D ITV (cm3) | Volume underestimation (%) |
|---|---|---|---|
| A | 1.78 | 2.97 | 40.1 |
| B | 35.62 | 46.98 | 24.2 |
DISCUSSION
This study has illustrated that the presence of an I/E ratio of less than one can adversely affect the ability of a FB-CBCT image to accurately represent the full range of a moving target. The severity of this effect increases as the I/E ratio decreases. Underestimation of the ITV during the verification process could lead to improper alignment of the planning ITV with the on-board image of the FB-CBCT ITV if the center-to-center technique is maintained. Therefore, this type of breathing disparity has the potential to lead to localization errors, which may not be covered by margin expansion if the motion was large enough.
Patient RPM data were used as templates to simulate patient respiratory motion with natural variations in amplitude and durations of respiratory cycles. The RPM profiles were scaled to exhibit a range of amplitudes (0.5, 1.0, and 2.0 cm) consistent with actual lung tumor motion amplitudes reported in the literature.1 However, the relative differences in amplitude that typically occur from cycle to cycle were predetermined from the input RPM profiles. The normal variations in respiratory cycle duration were also inherently present in the RPM data. These features are important because they help the experiment and, thus, the results, be more clinically applicable. In some cases, abdominal motion may not correlate well with tumor motion, but several studies have shown that, in general, there is some degree of correlation (in particular, for tumor displacement in the superior–inferior direction).33, 34, 35, 36, 37, 38, 39, 40, 41, 42 Of course correlation does not guarantee identical changes in tumor orientation and amplitude, which is why we rescaled the amplitudes to match what has been reported in the literature and only concentrated on superior–inferior motion. So, while our motion traces are not authentic, they are reasonable representations of natural tumor motions and allowed us to make appropriate conclusions regarding the effects of breathing irregularities (both amplitude and cycle duration irregularities) on CBCT images.
Although our experiments effectively demonstrated the impact unequal durations of inspiration and expiration can have on images, there are other breathing irregularities that often appear in patient respiration that were not acknowledged here. Those include baseline shift and varying peak inspiration amplitudes. Our study attempted to isolate the irregularity of interest, but small variations in inspiration amplitudes of patient derived profiles were mildly confounding. An example of these variations can be seen in Fig. 2.
The results shown in Figs. 89 exhibited some fluctuations in the extracted area and, thus, did not always precisely follow the expected decreasing trend in area as the I/E ratio decreased. These fluctuations were more abundant for the patient respiratory cycles than for the simulated ones. One explanation may be the presence of the confounding factor of inconsistent peak amplitudes in the patient profiles. However, the more likely explanation is that the flaws of the image-processing algorithm itself may have introduced some error into the data during the contour extraction process. The Canny edge algorithm determines the edges by looking for local maxima of the gradient of the image, which is calculated with the derivative of the Gaussian filter. It has often been found to perform superiorly to other edge detection methods because it uses two thresholds, which detect strong and weak edges, but only includes the weak edges in the output contour if they are connected to the strong edges. This is done in order to minimize the influence of noise so that the algorithm is more likely to detect the true weak edges. Nonetheless, for several of the profiles, the algorithm was unable to extract the full contour from the image, thus requiring manual closing in order to calculate the area inside. For this reason, Canny edge detection was only implemented to calculate area in a single image slice instead of the entire volume. The minimal adjustments consisted of simply connecting the two closest edges with a vertical or horizontal line. Although this made the results somewhat more subjective and may have introduced some error, using the Canny edge detector allowed us to study the phantom target contours more objectively than manual contouring. However, manual contouring was employed for the determination of the FB-CBCT and 4D CBCT volumes of the patient study. This is because the Canny edge detector showed some difficulty in consistently extracting closed contours of simple phantom anatomy composed of only two densities. Therefore, it did not seem feasible to use this technique for more intricate patient anatomy exhibiting a multitude of densities.
Variations in peak inspiration amplitudes were also exhibited in the RPM profile (Fig. 10) of the lung patient example. In addition, upon examining the respiratory cycle, the average inspiration to expiration ratio was calculated to be 0.307, which is rather low on the spectrum. These two factors are likely to explain the underestimations of the volumes of both tumors demonstrated in Table TABLE II.. As far as the large differences in percent underestimation, the FB-CBCT versus 4D CBCT comparison images in Fig. 10 provide some insight into that, demonstrating that tumor A is much more affected by respiratory-induced motion than tumor B.
While our investigations allowed us to determine trends and make conclusive statements, they are not without limitations. Most phantom studies often fall short of the real-life clinical scenario and our phantom is limited as well, due to its simplistic anatomy. The acquired images consisted of only two densities: lung and soft-tissue equivalent materials. There was much less confounding anatomy (no ribs, breast, adipose tissue, etc.) than would be present in a typical patient case, which explains why a small trace of the target could still be seen in the images of even the most extreme respiration disparities. Thus, it would be reasonable to assume that the contrast reduction percentages would likely be higher and the contoured areas would likely be smaller in a clinical scenario with true patient anatomy.
The effects of spending different amounts of time in inspiration and expiration on FB-CBCT imaging of a moving target have been made apparent in this paper. However, FB-CBCT ITV underestimation may be minimized with the use of a 4D CBCT image, where the 0 and 50% phase bins of the 4D CBCT represent the estimated full extent of target motion based on the given 4D imaging protocol, as demonstrated with Figs. 510. But high doses and long acquisition times required for conventionally proposed 4D CBCT imaging protocols have prevented 4D CBCT from translation into routine clinical use. Maurer et al.32 proposed a formalism that allows optimized selection of acquisition parameters for customized on-board 4D imaging.
Their study presents a method for optimizing the slow-gantry acquisition of 4D digital tomosynthesis (4D-DTS) or 4D CBCT images using a set of equations that relate the patient’s specific respiration characteristics to the scan acquisition and reconstruction parameters. The resulting dose and scan time are dependent upon the required visibility of the tumor and so can either be smaller/shorter (particularly if only 0 and 50% phase images are needed) or slightly larger/longer than for a conventional 3D CBCT scan. Although this study does not directly suggest the use of this technique for addressing breathing inconsistencies, its capability to produce fast, low dose 4D images inadvertently solves our problem. If a patient presents with a breathing disparity where different amounts of time are spent inhaling and exhaling, the 0 and 50% phase images generated from this optimized protocol will still illustrate the peaks of the target motion. Combining that information allows us to determine the full range of motion, which can then be accurately verified with the planning 4DCT ITV information immediately prior to delivery of treatment.
The data presented in this paper suggest the importance of being aware of patients that present with large tumor motion and such disproportionate breathing conditions. However, prior to incorporating a procedure to correct for the potential localization errors of such patients, the dosimetric consequences first need to be assessed. Recent publications by Trofimov et al.43 and Mutaf et al.44 indicate that there may be dosimetric consequences due to incorrect center-to-center volume matching between planning and on-board ITVs for large motion amplitudes. Trofimov et al.43 demonstrated that without applying their proposed tumor trailing strategy nor 1 cm margin expansion, the shifts resulting from the “ultracyclic motion” of respiration can lead to cold spots of 85% of the planned dose to the target over a sum of four delivered fractions. Although the interplay effect between MLC motion and respiratory-induced target motion has been shown to average out over the many fractions of IMRT,45, 46, 47, 48, 49, 50, 51, 52 it may be more concerning for SBRT treatments due to the fewer amount of fractions with higher dose per fraction.53 Mutaf et al.44 also studied the effect of a different type of respiratory shift on the dose distribution delivered to the CTV. Their study found that for uncharacteristic respiratory motion, where a shift occurs between the 4D-CT determined CTV motion amplitude and the actual patient respiration during treatment, the dose reductions to the CTV can be 4.1% ± 1.7% for 1 cm amplitudes and 9.6% ± 1.7% for 2 cm amplitudes. The shift that may occur as a result of volume underestimation due to the respiratory motion presented in this paper can draw parallels from the aforementioned publications. Therefore, the dosimetric significance of the current work is further being investigated in our ongoing study.
Ultimately, underdosage of the target is a result of localization errors that may occur due to underestimation of the ITV. As an example of the magnitude of the error that may occur, a rough estimate can be computed here. For the worst case scenario in our phantom study: a 1.0 cm target moving 2.0 cm in amplitude with an I/E ratio of 0.21, the length of the planning ITV obtained from 4D-CT would be 3.0 cm long (assuming that the 4D-CT is unaffected by the disparity between inspiration and expiration). Adding the typical setup margin of 0.5 cm to the ITV to make it a PTV would extend the length to 4.0 cm. Now assuming that such a disparity ratio would only provide enough contrast for the 1.0 cm target to be visible at the location corresponding to peak expiration, aligning the center of this 1.0 cm FB-CBCT ITV with the 4.0 cm PTV would result in 0.5 cm of the target moving out of the PTV margin during peak inspiration. Clearly, this is a very rough estimate due to all of the mentioned assumptions and thus warrants a much more involved prospective patient study, which in addition to the dosimetric significance needs further investigation.
CONCLUSIONS
The internal target volume generated by a FB-CBCT scan has the potential to be underrepresented as the time spent in inspiration becomes more disparate from the time spent in expiration. Our study emphasizes the importance of being aware of such a specific respiration disparity and its effects, so that the likely consequences of localization error may be avoided.
ACKNOWLEDGMENTS
This work was supported by NIH Grant No. T32EB007185 and in part by a research grant from Varian Medical Systems. The authors want to thank Dr. Devon Godfrey for allowing us to use his reconstruction algorithm, as well as Dr. Tinsu Pan at MD Anderson Cancer Center for the slow-gantry patient data.
References
- Keall P. J. et al. , “The management of respiratory motion in radiation oncology report of AAPM Task Group 76,” Med. Phys. 33(10), 3874–3900 (2006). 10.1118/1.2349696 [DOI] [PubMed] [Google Scholar]
- Rietzel E., Pan T., and Chen G. T., “Four-dimensional computed tomography: Image formation and clinical protocol,” Med. Phys. 32, 874–889 (2005). 10.1118/1.1869852 [DOI] [PubMed] [Google Scholar]
- Underberg R. W. et al. , “Four-dimensional CT scans for treatment planning in stereotactic radiotherapy for stage I lung cancer,” Int. J. Radiat. Oncol., Biol., Phys. 60(4), 1283–1290 (2004). 10.1016/j.ijrobp.2004.07.665 [DOI] [PubMed] [Google Scholar]
- Rietzel E. et al. , “Moving targets: Detection and tracking of internal organ motion for treatment planning and patient set-up,” Radiother. Oncol. 73(Suppl 2), S68–S72 (2004). 10.1016/S0167-8140(04)80018-5 [DOI] [PubMed] [Google Scholar]
- Keall P. J. et al. , “Acquiring 4D thoracic CT scans using a multislice helical method,” Phys. Med. Biol. 49(10), 2053–2067 (2004). 10.1088/0031-9155/49/10/015 [DOI] [PubMed] [Google Scholar]
- Pan T. et al. , “4D-CT imaging of a volume influenced by respiratory motion on multi-slice CT,” Med. Phys. 31(2), 333–340 (2004). 10.1118/1.1639993 [DOI] [PubMed] [Google Scholar]
- Wambersie A., Landberg T., and Gahbauer R., “Prescribing, recording and reporting photon beam therapy: The problem of margins (the recent ICRU recommendations, Report #62, 1999),” Patras Med. Phys. 99, 25–31, 358 (1999) [Google Scholar]
- Purdie T. G. et al. , “Cone-beam computed tomography for on-line image guidance of lung stereotactic radiotherapy: Localization, verification, and intrafraction tumor position,” Int. J. Radiat. Oncol., Biol., Phys. 68(1), 243–252 (2007). 10.1016/j.ijrobp.2006.12.022 [DOI] [PubMed] [Google Scholar]
- Yeung A. R. et al. , “Tumor localization using cone-beam CT reduces setup margins in conventionally fractionated radiotherapy for lung tumors,” Int. J. Radiat. Oncol., Biol., Phys. 74(4), 1100–1107 (2009). 10.1016/j.ijrobp.2008.09.048 [DOI] [PubMed] [Google Scholar]
- Grills I. S. et al. , “Image-guided radiotherapy via daily online cone-beam CT substantially reduces margin requirements for stereotactic lung radiotherapy,” Int. J. Radiat. Oncol., Biol., Phys. 70(4), 1045–1056 (2008). 10.1016/j.ijrobp.2007.07.2352 [DOI] [PubMed] [Google Scholar]
- Yin F. F. et al. , “Integration of cone-beam CT in stereotactic body radiation therapy,” Technol. Cancer Res. Treat. 7(2), 133–139 (2008). [DOI] [PubMed] [Google Scholar]
- Yin F. F., Wang Z., Yoo S., Godfrey D., and Wum W.-R., “In-room radiographic imaging for localization,” Proceedings AAPM Summer School Integrating New Technologies into the Clinic: Monte Carlo and Image Guided Radiation Therapy, Ontario, Canada, June 18–22, 2006. .
- Duggan D. M. et al. , “Deep-inspiration breath-hold kilovoltage cone-beam CT for setup of stereotactic body radiation therapy for lung tumors: Initial experience,” Lung Cancer 56(1), 77–88 (2007). 10.1016/j.lungcan.2006.11.012 [DOI] [PubMed] [Google Scholar]
- Yin F. F. et al. , “Physics and imaging for targeting of oligometastases,” Semin. Radiat. Oncol. 16(2), 85–101 (2006). 10.1016/j.semradonc.2005.12.004 [DOI] [PubMed] [Google Scholar]
- Admiraal M. A., Schuring D., and Hurkmans C. W., “Dose calculations accounting for breathing motion in stereotactic lung radiotherapy based on 4D-CT and the internal target volume,” Radiother. Oncol. 86(1), 55–60 (2008). 10.1016/j.radonc.2007.11.022 [DOI] [PubMed] [Google Scholar]
- Wang Z. et al. , “Cone-beam CT localization of internal target volumes for stereotactic body radiotherapy of lung lesions,” Int. J. Radiat. Oncol., Biol., Phys. 69(5), 1618–1624 (2007). 10.1016/j.ijrobp.2007.08.030 [DOI] [PubMed] [Google Scholar]
- Feldkamp L. A., Davis L. C., and Kress J. W., “Practical cone-beam algorithm,” J. Opt. Soc. Am. A Opt. Image Sci. Vis. 1(6), 612–619 (1984). 10.1364/JOSAA.1.000612 [DOI] [Google Scholar]
- Godfrey D. J. et al. , “Digital tomosynthesis with an on-board kilovoltage imaging device,” Int. J. Radiat. Oncol., Biol., Phys. 65(1), 8–15 (2006). 10.1016/j.ijrobp.2006.01.025 [DOI] [PubMed] [Google Scholar]
- Sonke J. J. et al. , “Respiratory correlated cone beam CT,” Med. Phys. 32(4), 1176–1186 (2005). 10.1118/1.1869074 [DOI] [PubMed] [Google Scholar]
- Dietrich L. et al. , “Linac-integrated 4D cone beam CT: First experimental results,” Phys. Med. Biol. 51(11), 2939–2952 (2006). 10.1088/0031-9155/51/11/017 [DOI] [PubMed] [Google Scholar]
- Li T. et al. , “Four-dimensional cone-beam computed tomography using an on-board imager,” Med. Phys. 33(10), 3825–3833 (2006). 10.1118/1.2349692 [DOI] [PubMed] [Google Scholar]
- Purdie T. G. et al. , “Respiration correlated cone-beam computed tomography and 4DCT for evaluating target motion in stereotactic lung radiation therapy,” Acta Oncol. 45(7), 915–922 (2006). 10.1080/02841860600907345 [DOI] [PubMed] [Google Scholar]
- Lu J. et al. , “Four-dimensional cone beam CT with adaptive gantry rotation and adaptive data sampling,” Med. Phys. 34(9), 3520–3529 (2007). 10.1118/1.2767145 [DOI] [PubMed] [Google Scholar]
- Chang J. W. et al. , “Integrating respiratory gating into a megavoltage cone-beam CT system,” Med. Phys. 33(7), 2354–2361 (2006). 10.1118/1.2207136 [DOI] [PubMed] [Google Scholar]
- Kriminski S. et al. , “Respiratory correlated cone-beam computed tomography on an isocentric C-arm,” Phys. Med. Biol. 50(22), 5263–5280 (2005). 10.1088/0031-9155/50/22/004 [DOI] [PubMed] [Google Scholar]
- Sillanpaa J. et al. , “Developments in megavoltage cone beam CT with an amorphous silicon EPID: Reduction of exposure and synchronization with respiratory gating,” Med. Phys. 32(3), 819–829 (2005). 10.1118/1.1861522 [DOI] [PubMed] [Google Scholar]
- Li T. et al. , “Motion correction for improved target localization with on-board cone-beam computed tomography,” Phys. Med. Biol. 51(2), 253–267 (2006). 10.1088/0031-9155/51/2/005 [DOI] [PubMed] [Google Scholar]
- Leng S. et al. , “Streaking artifacts reduction in four-dimensional cone-beam computed tomography,” Med. Phys. 35(10), 4649–4659 (2008). 10.1118/1.2977736 [DOI] [PMC free article] [PubMed] [Google Scholar]
- Leng S. et al. , “High temporal resolution and streak-free four-dimensional cone-beam computed tomography,” Phys. Med. Biol. 53(20), 5653–5673 (2008). 10.1088/0031-9155/53/20/006 [DOI] [PMC free article] [PubMed] [Google Scholar]
- Bergner F. et al. , “Autoadaptive phase-correlated (AAPC) reconstruction for 4D CBCT,” Med. Phys. 36(12), 5695–5706 (2009). 10.1118/1.3260919 [DOI] [PMC free article] [PubMed] [Google Scholar]
- Rit S. et al. , “On-the-fly motion-compensated cone-beam CT using an a priori model of the respiratory motion,” Med. Phys. 36(6), 2283–2296 (2009). 10.1118/1.3115691 [DOI] [PubMed] [Google Scholar]
- Maurer J., Pan T., and Yin F. F., “Slow gantry rotation acquisition technique for on-board four-dimensional digital tomosynthesis,” Med. Phys. 37(2), 921–933 (2010). 10.1118/1.3285291 [DOI] [PubMed] [Google Scholar]
- Vedam S. S. et al. , “Quantifying the predictability of diaphragm motion during respiration with a noninvasive external marker,” Med. Phys. 30(4), 505–513 (2003). 10.1118/1.1558675 [DOI] [PubMed] [Google Scholar]
- Gierga D. P. et al. , “The correlation between internal and external markers for abdominal tumors: Implications for respiratory gating,” Int. J. Radiat. Oncol., Biol., Phys., 61, 1551–1558 (2005), 10.1016/j.ijrobp.2004.12.013 [DOI] [PubMed] [Google Scholar]; Erratum: 62(4), 1257 (2005).
- Ozhasoglu C. and Murphy M. J., “Issues in respiratory motion compensation during external-beam radiotherapy,” Int. J. Radiat. Oncol., Biol., Phys. 52(5), 1389–1399 (2002). 10.1016/S0360-3016(01)02789-4 [DOI] [PubMed] [Google Scholar]
- Ahn S. et al. , “A feasibility study on the prediction of tumour location in the lung from skin motion,” Br. J. Radiol. 77(919), 588–596 (2004). 10.1259/bjr/64800801 [DOI] [PubMed] [Google Scholar]
- Hoisak J. D. et al. , “Correlation of lung tumor motion with external surrogate indicators of respiration,” Int. J. Radiat. Oncol., Biol., Phys. 60(4), 1298–1306 (2004). 10.1016/j.ijrobp.2004.07.681 [DOI] [PubMed] [Google Scholar]
- Tsunashima Y. et al. , “Correlation between the respiratory waveform measured using a respiratory sensor and 3D tumor motion in gated radiotherapy,” Int. J. Radiat. Oncol., Biol., Phys. 60(3), 951–958 (2004). 10.1016/j.ijrobp.2004.06.026 [DOI] [PubMed] [Google Scholar]
- Koch N. et al. , “Evaluation of internal lung motion for respiratory-gated radiotherapy using MRI: Part I—Correlating internal lung motion with skin fiducial motion,” Int. J. Radiat. Oncol., Biol., Phys. 60(5), 1459–1472 (2004). 10.1016/j.ijrobp.2004.07.673 [DOI] [PubMed] [Google Scholar]
- Yan H. et al. , “The correlation evaluation of a tumor tracking system using multiple external markers,” Med. Phys. 33(11), 4073–4084 (2006). 10.1118/1.2358830 [DOI] [PubMed] [Google Scholar]
- Korreman S. et al. , “Comparison of respiratory surrogates for gated lung radiotherapy without internal fiducials,” Acta Oncol. 45(7), 935–942 (2006). 10.1080/02841860600917161 [DOI] [PubMed] [Google Scholar]
- Ionascu D. et al. , “Internal-external correlation investigations of respiratory induced motion of lung tumors,” Med. Phys. 34(10), 3893–3903 (2007). 10.1118/1.2779941 [DOI] [PubMed] [Google Scholar]
- Trofimov A. et al. , “Tumor trailing strategy for intensity-modulated radiation therapy of moving targets,” Med. Phys. 35(5), 1718–1733 (2008). 10.1118/1.2900108 [DOI] [PMC free article] [PubMed] [Google Scholar]
- Mutaf Y. D. et al. , “A simulation study of irregular respiratory motion and its dosimetric impact on lung tumors,” Phys. Med. Biol. 56(3), 845–859 (2011). 10.1088/0031-9155/56/3/019 [DOI] [PubMed] [Google Scholar]
- Bortfeld T. et al. , “Effects of intra-fraction motion on IMRT dose delivery: Statistical analysis and simulation,” Phys. Med. Biol. 47(13), 2203–2220 (2002). 10.1088/0031-9155/47/13/302 [DOI] [PubMed] [Google Scholar]
- Jiang S. B. et al. , “An experimental investigation on intra-fractional organ motion effects in lung IMRT treatments,” Phys. Med. Biol. 48(12), 1773–1784 (2003). 10.1088/0031-9155/48/12/307 [DOI] [PubMed] [Google Scholar]
- Chui C. S., Yorke E., and Hong L., “The effects of intra-fraction organ motion on the delivery of intensity-modulated field with a multileaf collimator,” Med. Phys. 30(7), 1736–1746 (2003). 10.1118/1.1578771 [DOI] [PubMed] [Google Scholar]
- Schaefer M. et al. , “Influence of intra-fractional breathing movement in step-and-shoot IMRT,” Phys. Med. Biol. 49(12), N175–N179 (2004). 10.1088/0031-9155/49/12/N03 [DOI] [PubMed] [Google Scholar]
- Gierga D. P. et al. , “Quantification of respiration-induced abdominal tumor motion and its impact on IMRT dose distributions,” Int. J. Radiat. Oncol., Biol., Phys. 58(5), 1584–1595 (2004). 10.1016/j.ijrobp.2003.09.077 [DOI] [PubMed] [Google Scholar]
- Berbeco R. I., Pope C. J., and Jiang S. B., “Measurement of the interplay effect in lung IMRT treatment using EDR2 films,” J. Appl. Clin. Med. Phys. 7(4), 33–42 (2006). [DOI] [PMC free article] [PubMed] [Google Scholar]
- Duan J. et al. , “Dosimetric and radiobiological impact of dose fractionation on respiratory motion induced IMRT delivery errors: A volumetric dose measurement study,” Med. Phys. 33(5), 1380–1387 (2006). 10.1118/1.2192908 [DOI] [PubMed] [Google Scholar]
- Seco J. et al. , “Effects of organ motion on IMRT treatments with segments of few monitor units,” Med. Phys. 34(3), 923–934 (2007). 10.1118/1.2436972 [DOI] [PMC free article] [PubMed] [Google Scholar]
- Kang H. et al. , “Evaluation of tumor motion effects on dose distribution for hypofractionated intensity-modulated radiotherapy of non-small-cell lung cancer,” J. Appl. Clin. Med. Phys. 11(3), 78–89 (2010). [DOI] [PMC free article] [PubMed] [Google Scholar]


