

Abstract
Epidemic theory predicts that the vaccination threshold required to interrupt local transmission of an immunizing infection like measles depends only on the basic reproductive number  and hence transmission rates. When the search for optimal strategies is expanded to incorporate economic constraints, the optimum for disease control in a single population is determined by relative costs of infection and control, rather than transmission rates. Adding a spatial dimension, which precludes local elimination unless it can be achieved globally, can reduce or increase optimal vaccination levels depending on the balance of costs and benefits. For weakly coupled populations, local optimal strategies agree with the global cost-effective strategy; however, asymmetries in costs can lead to divergent control optima in more strongly coupled systems—in particular, strong regional differences in costs of vaccination can preclude local elimination even when elimination is locally optimal. Under certain conditions, it is locally optimal to share vaccination resources with other populations.
Keywords: eradication threshold, transboundary model, resource allocation
The impact of vaccination against infectious disease is one of the triumphs of public health (1–5). The dynamic response of strongly immunizing infections to vaccination is well captured by theory (6, 7). In the simplest formulation, vaccination in a well-mixed population near birth reduces the basic reproduction ratio of infection,  , to an effective value
  (1 − p) (6). This reduction in effective transmission leads to a well-known criterion for local elimination of transmission: pc = 1 − 1/
 . Various factors including spatial and social heterogeneity, seasonality in transmission, and stochasticity complicate this picture (2, 6, 8–12), but the simple calculation captures the essential impact of herd immunity remarkably well (11).
However, pc depends only on epidemiological parameters and does not account for the costs of vaccination campaigns and the resultant health and (ultimately) economic benefits of reduction or elimination of cases. Given the current focus on potential elimination of measles and polio (13–17), it is timely to add an economic component to the basic epidemiological theory of herd immunity (18). Traditionally, the main economic benefit of disease elimination was envisaged in terms of cessation of vaccination after interruption of infection (19–21). For instance, it is estimated the United States recoups its investment in the smallpox eradication campaign through averted costs of vaccination every 26 d (22, 23). However, with advances in pathogen genomics and molecular biology, such that important viral pathogens could be regenerated from genomic information (24), vaccination at some level would likely continue into the longer term even if transmission of a given pathogen were interrupted globally (25). Assuming that herd immunity is maintained at eradication levels (Conclusions), the economic benefits of eradication are then simply the health benefits derived from preventing disease.
Results and Discussion
To synthesize epidemiological and economic forces, we modify the classic susceptible–infected–removed (SIR) model for the dynamics of immunizing infections (7, 26, 27) to allow for the costs and benefits of vaccination (Materials and Methods). Beginning with a model with implicit importation of infected cases, we distinguish between vaccination costs that increase exponentially with coverage and infection costs that are proportional to both the severity of the disease and its prevalence in the population. It may sometimes be useful to formulate disease-related costs more explicitly in terms of mortality, morbidity, loss of productivity, or even treatment and hospitalization costs (28, 29). However, here by infection costs we focus on the simplest case, in terms of the severity of the disease and its burden. Assuming that vaccination continues after elimination, we find optimal vaccination coverage (Materials and Methods) for a single population and extend the result for a spatial model with populations coupled through migration. Looking first for the optimal coverage at equilibrium, we later relax this assumption and fully account for epidemic dynamic and transient behavior in a seasonal and spatial setting (details in SI Appendix).
Surprisingly, the optimal vaccination coverage p′ that incorporates economic considerations is independent of transmission rate β and determined mostly by the ratio of disease burden and vaccination costs,  (see also ref. 30). Local elimination is optimal only for low
  values that result in a critical elimination threshold pc that is smaller than p′. As illustrated in Fig. 1 A and B (and in SI Appendix, Figs. S2B and S3), very severe infections (high per-capita burden cI) increase the economic optimum and can recover the elimination threshold (Eqs. 4 and 5). However, for less serious infections with low cI, the economic optimum may be well below pc: essentially the economic optimum is to tolerate some cases of less serious infections, especially if vaccination costs are high. (Dependence of these optima on infectious period is explored in SI Appendix, Fig. S2A).
Fig. 1.

(A) One-patch SIR model without immigration: vaccination costs (black line) and disease costs for two different values of  (
( = 1.5 in blue lines,
  = 5 in green lines) for two different values of per-capita cost of infection (solid lines, moderate cost; dashed lines, high cost). Vertical colored lines indicate the critical level of coverage, pc = 1 − 1/
 , needed to eliminate the disease in the absence of economic constraints. Parameters: 1/ν = 14, 1/μ = 80 y. (B) Total costs for the case when there is no immigration (combined vaccination and disease costs). Solid (moderate cost) and dashed (high cost) blue and green lines represent the total coverage for, respectively,
  = 1.5 and
  = 5, until the elimination coverage indicated by colored vertical lines. Dotted line represents the coverage cost after the elimination. Black vertical lines indicate the level of coverage that minimizes total costs (solid, moderate cost; dashed, high cost) given by Eq. 3. (C) Optimal coverage as a function of immigration likelihood in the one-patch SIR model with immigration. Solid line, moderate infection cost; dashed line, high infection cost. Vertical colored lines indicate the level of immigration for which equilibrium prevalence and total costs are shown in D and E: blue, η = 0; green, η = 0.00065; red, η = 0.01.
Adding immigration of infection (η > 0) to a single population precludes elimination by local vaccination alone (31, 32). Immigration also has significant effects on economic optima for vaccination (Fig. 1 C–E). Consider first a nonsevere, low- infection with moderate infection cost. The zero immigration optimum coincides with the elimination threshold (Fig. 1B); however, a low level of infective immigration (Fig. 1C, solid black line) markedly reduces the optimal vaccination level. This reduction happens because even low levels of immigration significantly increase the prevalence of infection above pc (Fig. 1D), so that considerable (and expensive) vaccination efforts are required to lower prevalence and thus achieve infection cost benefits. For higher immigration rates, a larger increase in prevalence (Fig. 1D) results in magnifying the costs of disease and thus increasing the optimal vaccination level (Fig. 1C, solid black line). For high infection costs (Fig. 1C, dashed black line), the increase in optimal vaccination with immigration is monotonic and the rate of increase is greater than for moderate infection costs.
These equilibrium results are robust to adding epidemiological dynamics and explicit space in terms of a variety of models for two-patch SIR systems (Materials and Methods and SI Appendix). The explicit two-patch case also allows us to explore the match between local and global vaccination cost optima. Whereas the global optimum minimizes overall costs in the region, local optima focus entirely on minimizing their own local costs. If each population chooses a strategy that minimizes its local costs, given the neighboring vaccination coverage, the populations are at the joint optimum (Nash equilibrium), where neither population can benefit by changing its strategy unilaterally (33). The key metric here is the match between the global optimum for the two populations and their Nash equilibrium (full analysis in SI Appendix). It is useful here to distinguish weakly coupled populations [corresponding in our one-patch plus immigration model to η << μ (the turnover rate of the population)] from strongly coupled populations (η ≥ μ). For weakly coupled populations (Fig. 2A), local and global vaccination optima are very close; this outcome occurs over a wide range of parameter space and applies even if epidemiological and economic parameters are relatively different across patches. However, if local optima are on either side of the elimination threshold (due, for example, to asymmetries in vaccination costs arising from differences in supply chain and overall health delivery efficiency or asymmetric disease costs), local and overall optima can diverge with increased coupling [so that global elimination is not the optimum (Fig. 2B)]. Increasing the seriousness of disease (infection costs) recovers the optimal coverage dictated by  (SI Appendix, Fig. S11: optimal coverage is equal to the eradication threshold). The effect of local asymmetries in epidemiological or economic parameters is much stronger at higher levels of coupling (Fig. 2 C and D), when there is a much larger area of parameter space where local and global vaccination optima differ.
Fig. 2.

Two-patch SIR model. Colored lines show contours of the total costs (both patches) as a function of coverage levels in each patch. The coverage levels for which the global costs are minimized are indicated with a blue circle. Black lines indicate the cost minimizing coverage values at one patch for a given coverage in the other patch, and the black circle is the Nash equilibrium. (A) Weak coupling, η = μ/10, asymmetric vaccination costs (a1 > a2),  =
=  = 5, cI1 = cI2 = 5. (B) Same as A but strong coupling, η = 10μ. (C) Asymmetric disease costs, cI1 > cI2,
  =
=  = 5, a1 = a2 = 0.1, η = μ. (D) Asymmetry in
  values,
  >
>  , cI1 = cI2, = 5, a1 = a2 = 0.1, η = μ.
When the Nash equilibrium marches with the global optimum, both populations achieve optimal coverage levels without additional cooperation. The optimal level of coverage depends on relative costs of coverage and burden of infection and can fall anywhere from no vaccination (when cost of coverage is too high but disease is not severe) to elimination (when cost of coverage is low and disease burden is high), previously proved for a case when vaccination stops after eradication (19, 20, 23). Divergent optima, on the other hand, can result in local strategies that can be harmful to neighboring populations, requiring a global vaccination policy to ensure a globally optimal solution.
In sum, local and global vaccination optima tend to coincide when populations are weakly coupled (such that movement is a fraction of population turnover)—we might, for example, see this at the level of coupling between countries. On the other hand, if movement is much larger (for example, between regions or social groups within a country or in cities where mass movements occur), local and global optima may not coincide, especially with respect to elimination.
Finally, a key generalization of these results is the optimal spatial control of the infection under limited resources. Fig. 3 explores the extension of our two-patch model and optimal allocation of limited local and global resources. Fig. 3A shows optimal allocation of global (or external) resources that minimizes overall infection burden (infection costs), allowing for a transient epidemic dynamic during the control period. When budgets are limited, preference is given to the patch where it is easier to achieve the herd immunity threshold (due to either a lower  value or lower campaign costs). These results are in agreement with work by Rowthorn et al. (34) (see also refs. 35–37). Once the elimination threshold can be achieved in one patch, resources are split between both patches, eventually facilitating global elimination. The allocation of local resources depends greatly on the time frame over which we are minimizing infection costs (Fig. 3 B–D). Assuming that the second patch has sustained coverage at 95% of its elimination threshold (high vaccination coverage, but not enough to eliminate the infection), we seek to find the optimal budget allocation of the local, patch-1 resources, which minimizes its infection costs. Short-term minimization of patch-1 disease burden leads to investment of all of its resources toward local herd immunity, except for very small levels of local budget. Budget levels that can achieve <5% local coverage are better invested in eliminating the infection in the other patch, thereby achieving a benefit of minimized incoming infections (Fig. 3B). Minimizing long-term infection costs results in sharing of the patch-1 resources close to its elimination threshold, thereby facilitating the elimination in both patches (Fig. 3 C and D).
Fig. 3.

Optimal allocation of globally and locally available resources. (A) Long-term optimal allocation of global (or external) resources. Shaded area represents a range of equally cost-effective strategies that lead to elimination; solid and dashed vertical red lines indicate the budget required to reach the elimination threshold in patch 1 and patch 2, respectively (pc1 and pc2); green vertical line indicates global elimination threshold, and black vertical line indicates the budget required to vaccinate everyone. (B) Short-term optimal allocation of patch-1 resources. Red vertical line indicates the level of budget required to reach the elimination threshold in patch 1, and black vertical line indicates budget required to vaccinate everyone in patch 1. (C) Long-term optimal allocation of patch-1 budget. Shaded area represents multiple optimal strategies for patch 1, where increasing allocation makes patch 2 better off while patch 1 remains at optimum (Pareto improvement). Red curve is the Pareto optimal strategy (no further Pareto improvements can be made). Red vertical line indicates the level of budget required to reach elimination threshold in patch 1, and black vertical line indicates budget required to vaccinate everyone in patch 1. (D) Magnification of the threshold area in C. Parameters:  =
=  = 3; a1 = 1, a2 = 0.5; cI1 = cI2 5; η = 10μ.
Conclusions
Epidemiological criteria for vaccination coverage have been well described for decades (6, 38), but there have been no generalizable results generated by including economic constraints into epidemic models, in a world where postelimination cessation of vaccination is not an option. We find that introducing the costs of infection and vaccination dramatically alters the conditions under which it is optimal to eliminate a disease. When the cost of infection is finite, the optimal vaccination coverage is independent of transmission and is set at the level where the benefit of lower cost of infection is balanced against the cost of increasing coverage. Large enough cost of infection (Eq. 5) recovers the original paradigm for critical vaccination coverage that is a function of  .
.
From a microbial perspective, no country is an island. Therefore, incentives for the manager of a single patch (a country or group within a country) are also influenced by the rate of entry of infecteds from other patches. Immigration retards the ability of a country to eliminate a disease; that is well known. However, we find that the optimal response, almost always, to increasing immigration is to increase vaccination coverage. The only exception is when the cost of infection is low—here, for very low levels of immigration, it makes sense to cut back vaccination coverage because of the inability to control disease in the presence of an external source of infecteds.
Our synthesis of epidemiological and economic constraints in a spatial framework yields counterintuitive results not just from an epidemiological perspective, but also from an economic one. The case for disease elimination has typically been made on the back of the significant gains from cessation of routine vaccination once the disease has been stamped out (19–21). However, when postelimination cessation of vaccination is not an option, we find that it may even be optimal for a country to vaccinate at a level exceeding the critical vaccination coverage rate in the presence of incoming infecteds, if the costs of disease are high enough and vaccination is affordable enough. Extending these results to full epidemic metapopulations is an important area for future work (but should not affect our qualitative results).
In practice, the posteradication strategy might be to maintain some herd immunity by vaccination, but at a lower level than needed for eradication (e.g., changing from a two-dose to one-dose schedule posteradication). This method would emphasize the benefits of eradication, but not affect our results qualitatively, assuming that substantial vaccination effort must remain postelimination. Other complexities not explicitly considered here center on the role of heterogeneity [in individual or age-specific transmission, in vaccination rates by age or social group (39), and in space], as well as on the impact of imperfect immunity and pathogen evolution. Again, these processes (all important avenues for future work) will not qualitatively affect our findings about the balance of epidemiological and economic forces on optimal policy (SI Appendix).
Our results show that the strength of coupling between populations has important consequences for incentives of local decision makers. Stronger coupling with other populations promotes free-riding in vaccination efforts between populations and results in lower levels of vaccination in each subpopulation relative to the global optimum. Conversely, when each population is isolated, its incentives are no different from those of a global decision maker. The notion that incentives to vaccinate may be diminished in a more interconnected world is a surprising result for disease modelers but entirely rational and consistent with the assumption of locally focused policymakers.
Finally, we show that, even though local and global optima mostly march together, coordination of vaccination efforts can be required to achieve global elimination (especially in asymmetric cases and when elimination is not dictated by relative infection and vaccination costs). Allocation of limited global (or external) vaccine resources results in focusing on the patch in which the elimination threshold is most readily achievable. The benefit to other patches is thereby provided in terms of reduced incoming infections, which would not be present if the resources were scattered among patches. Focusing on local budgetary limitations, we find the present value of infecteds is so high in short-term cost-effective strategies that the cost of current infections outweighs the benefit of preventing cases in the future. Long-term optimal strategies, on the other hand, stress the value of herd immunity to the extent that it might make sense for a patch to spend on vaccination in another patch rather than its own. When faced with a constraint in total vaccine expenditure, the long-term strategy facilitates elimination; this result in turn stresses the need for long-term funding and budget commitments to sustain and enhance herd immunity.
Materials and Methods
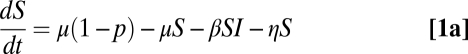
We begin with a model for a single well-mixed population, with an implicit input rate of infection from other populations, η (27, 40–42):
 |
 |
 |
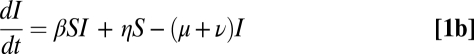
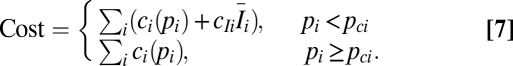
Here, S, I, and R are proportions of susceptible, infected, and recovered individuals, respectively, with transmission rate β, births balancing deaths (at the rate μ), and the average duration of infection given by 1/ν. A proportion, p, of individuals is vaccinated at birth (strictly at the end of maternal immunity) (43). We distinguish between the costs of the vaccination campaign (vaccination costs), which we assume to increase exponentially with coverage (details in SI Appendix, Fig. 1S), and costs of infection (infection costs) that we use as an index of the severity of the disease. The total infection costs are proportional to the total number of the infective individuals in the population. Because there is little evidence for increasing or decreasing marginal costs of infection within a single population (the change in total costs that arises from having one additional infection in the population), we assume constant marginal cost and model the costs of infection as a linear function of the infecteds (as in, for example, refs. 30 and 44–48). The total cost of vaccination plus infection is then,
 |
with per-capita burden cI. The cost of coverage is c(p) = aexp, where a is the cost of vaccinating the first child (the cost of setting up the program), and x captures the increase in costs with the increasing coverage p.
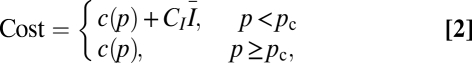
When there is no immigration, we can calculate the economic optimum by minimizing Eq. 2 to find the level of coverage that minimizes total costs,
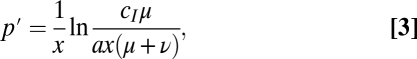 |
which is independent of transmission. If the economic optimum p′ is above the critical elimination threshold, pc = 1 − 1/ , the optimal strategy is to eliminate the infection locally:
(details in SI Appendix). Local elimination can be optimal also in the case of very severe diseases. In fact, for large enough per-capita burden cI, i.e.,
 |
the economic optimum p′ is always above pc, and optimal vaccination coverage p* is reduced to the critical elimination threshold determined by  (Eq. 4).
This basic result is robust to adding random vaccination (rather than vaccination at birth), fully incorporating transient disease dynamics, seasonality in both transmission and immigration, and stochastic importations of infecteds (SI Appendix).
We further develop and analyze an explicit spatial model where populations are coupled through migration of infected individuals following ref. 11,
 |
 |
 |
 |
where i, j = 1, 2, i ≠ j and the coverage in each patch is given by V. We look for global optimal vaccination coverage by minimizing the joint costs of coverage and infection for both populations,
 |
Local optima minimize total costs in individual populations as in Eq. 2.
Finally, we put a constraint on vaccine expenditure and fully incorporate the transient dynamics of the disease and look at how to best allocate the limited resources between two populations to minimize infection costs. For a given budget B we look for a proportion q of the budged allocation to population 2 such that
 |
subject to Eqs. 6 and minimizing the cost function
 |
where the term e−δt accounts for discounting (details in SI Appendix). We compare the central planner strategy (global policy) that looks to minimize global infection pressure to the local (decentralized) strategy where the local population minimizes its own infection costs.
Supplementary Material
Acknowledgments
This research was supported by the Bill and Melinda Gates Foundation, the Research and Policy for Infectious Disease Dynamics program of the Science and Technology Directorate, Department of Homeland Security, and the Fogarty International Center, National Institutes of Health (B.G.). P.K. acknowledges support from the United Nations Educational, Scientific, and Cultural Organization-L'Oréal for Women in Science Program.
Footnotes
The authors declare no conflict of interest.
This article is a PNAS Direct Submission.
This article contains supporting information online at www.pnas.org/lookup/suppl/doi:10.1073/pnas.1101694108/-/DCSupplemental.
References
- 1.Fenner F. A successful eradication campaign. Global eradication of smallpox. Rev Infect Dis. 1982;4:916–930. doi: 10.1093/clinids/4.5.916. [DOI] [PubMed] [Google Scholar]
- 2.Ferrari MJ, et al. The dynamics of measles in sub-Saharan Africa. Nature. 2008;451:679–684. doi: 10.1038/nature06509. [DOI] [PubMed] [Google Scholar]
- 3.Henderson DA. Smallpox eradication. Public Health Rep. 1980;95:422–426. [PMC free article] [PubMed] [Google Scholar]
- 4.Orenstein W, et al. Technical Consultative Group to the World Health Organization on the Global Eradication of Poliomyelitis. “Endgame” issues for the global polio eradication initiative. Clin Infect Dis. 2002;34:72–77. doi: 10.1086/338262. [DOI] [PubMed] [Google Scholar]
- 5.Roberts L. Polio endgame. Polio: The final assault? Science. 2004;303:1960–1968. doi: 10.1126/science.303.5666.1960. [DOI] [PubMed] [Google Scholar]
- 6.Anderson R, May R. Infectious Diseases of Humans. Oxford: Oxford Univ Press; 1991. [Google Scholar]
- 7.Keeling M, Rohani P. Modeling Infectious Diseases in Humans and Animals. Princeton: Princeton Univ Press; 2008. [Google Scholar]
- 8.Grenfell BT, Bolker BM, Kleczkowski A. Seasonality and extinction in chaotic metapopulations. Proc R Soc Lond B Biol Sci. 1995;259:97–103. [Google Scholar]
- 9.Grenfell BT, Bjørnstad ON, Kappey J. Travelling waves and spatial hierarchies in measles epidemics. Nature. 2001;414:716–723. doi: 10.1038/414716a. [DOI] [PubMed] [Google Scholar]
- 10.Keeling MJ, Rohani P. Estimating spatial coupling in epidemiological systems: A mechanistic approach. Ecol Lett. 2002;5:20–29. [Google Scholar]
- 11.Keeling MJ, Woolhouse ME, May RM, Davies G, Grenfell BT. Modelling vaccination strategies against foot-and-mouth disease. Nature. 2003;421:136–142. doi: 10.1038/nature01343. [DOI] [PubMed] [Google Scholar]
- 12.Lloyd-Smith JO, Schreiber SJ, Kopp PE, Getz WM. Superspreading and the effect of individual variation on disease emergence. Nature. 2005;438:355–359. doi: 10.1038/nature04153. [DOI] [PMC free article] [PubMed] [Google Scholar]
- 13.Cutts FT, Henao-Restrepo A, Olivé JM. Measles elimination: Progress and challenges. Vaccine. 1999;17(Suppl 3):S47–S52. doi: 10.1016/s0264-410x(99)00309-6. [DOI] [PubMed] [Google Scholar]
- 14.Gounder C. The progress of the Polio Eradication Initiative: What prospects for eradicating measles? Health Policy Plan. 1998;13:212–233. doi: 10.1093/heapol/13.3.212. [DOI] [PubMed] [Google Scholar]
- 15.Hopkins DR, Hinman AR, Koplan JP, Lane JM. The case for global measles eradication. Lancet. 1982;1:1396–1398. doi: 10.1016/s0140-6736(82)92510-7. [DOI] [PubMed] [Google Scholar]
- 16.Moss WJ, Griffin DE. Global measles elimination. Nat Rev Microbiol. 2006;4:900–908. doi: 10.1038/nrmicro1550. [DOI] [PMC free article] [PubMed] [Google Scholar]
- 17.Orenstein WA, et al. Measles eradication: Is it in our future? Am J Public Health. 2000;90:1521–1525. doi: 10.2105/ajph.90.10.1521. [DOI] [PMC free article] [PubMed] [Google Scholar]
- 18.Brisson M, Edmunds WJ. Economic evaluation of vaccination programs: The impact of herd-immunity. Med Decis Making. 2003;23:76–82. doi: 10.1177/0272989X02239651. [DOI] [PubMed] [Google Scholar]
- 19.Barrett S. Global disease eradication. J Eur Econ Assoc. 2003;1:591–600. [Google Scholar]
- 20.Barrett S. Eradication versus control: The economics of global infectious disease policies. Bull World Health Organ. 2004;82:683–688. [PMC free article] [PubMed] [Google Scholar]
- 21.Barrett S, Hoel M. Optimal disease eradication. Environ Dev Econ. 2007;12:627–652. [Google Scholar]
- 22.Fenner F. The eradicatoin of smallpox. Impact Sci Soc. 1988;38:147–158. [Google Scholar]
- 23.Miller M, Barrett S, Henderson D. Disease Control Priorities in Developing Countries. 2nd Ed. New York: Oxford University Press; 2006. Control and eradication; pp. 1163–1176. [Google Scholar]
- 24.Cello J, Paul AV, Wimmer E. Chemical synthesis of poliovirus cDNA: Generation of infectious virus in the absence of natural template. Science. 2002;297:1016–1018. doi: 10.1126/science.1072266. [DOI] [PubMed] [Google Scholar]
- 25.Cello J, Paul AV, Wimmer E. Vaccines should be kept even if polio is wiped out. Nature. 2002;418:915. doi: 10.1038/418915a. [DOI] [PubMed] [Google Scholar]
- 26.Kermack WO, McKendrick AG. A contribution to the mathematical theory of epidemics. Proc R Soc London Ser A. 1927;115:700–721. [Google Scholar]
- 27.Bauch CT, Earn DJ. Vaccination and the theory of games. Proc Natl Acad Sci USA. 2004;101:13391–13394. doi: 10.1073/pnas.0403823101. [DOI] [PMC free article] [PubMed] [Google Scholar]
- 28.Currie CSM, Floyd K, Williams BG, Dye C. Cost, affordability and cost-effectiveness of strategies to control tuberculosis in countries with high HIV prevalence. BMC Public Health. 2005 doi: 10.1186/1471-2458-5-130. 10.1186/1471-2458-5-130. [DOI] [PMC free article] [PubMed] [Google Scholar]
- 29.Graves N, Jarvis W, Halton K. Economics and Preventing Healthcare Acquired Infection. New York: Springer; 2009. [Google Scholar]
- 30.Kleczkowski A, Oles K, Gudowska-Nowak K, Gilligan CA. Searching or the most cost-effecitve strategy for controlling epidemics spreading on regular and small-world networks. J R Soc Interface. 2011 doi: 10.1098/rsif.2011.0216. 10.1098/rsif.2011.0216. [DOI] [PMC free article] [PubMed] [Google Scholar]
- 31.Brauer F, van den Driessche P. Models for transmission of disease with immigration of infectives. Math Biosci. 2001;171:143–154. doi: 10.1016/s0025-5564(01)00057-8. [DOI] [PubMed] [Google Scholar]
- 32.Piccolo C, Billings L. The effect of vaccinations in an immigrant model. Math Comput Model. 2005;42:291–299. [Google Scholar]
- 33.Vicary S, Sandler T. Weakest-link public goods: Giving in-kind or transferring money. Eur Econ Rev. 2002;46:1501–1520. [Google Scholar]
- 34.Rowthorn RE, Laxminarayan R, Gilligan CA. Optimal control of epidemics in metapopulations. J R Soc Interface. 2009;6:1135–1144. doi: 10.1098/rsif.2008.0402. [DOI] [PMC free article] [PubMed] [Google Scholar]
- 35.Forster GA, Gilligan CA. Optimizing the control of disease infestations at the landscape scale. Proc Natl Acad Sci USA. 2007;104:4984–4989. doi: 10.1073/pnas.0607900104. [DOI] [PMC free article] [PubMed] [Google Scholar]
- 36.Sun P, Yang L, de Vericourt F. Selfish drug allocation for containing an international influenza pandemic at the onset. Oper Res. 2009;57:1320–1332. [Google Scholar]
- 37.Anderson S, Laxminarayan R, Salant S. Diversify or focus? Spending to combat infectious diseases when budgets are tight. Resources for the Future. 2010;DP 10-15:1–24. doi: 10.1016/j.jhealeco.2012.05.001. Available at http://www.cddep.org/publications/diversify_or_focus_spending_combat_infectious_diseases_when_budgets_are_tight. [DOI] [PubMed] [Google Scholar]
- 38.Dietz K. In: Epidemiology. Ludwig D, Cooke KL, editors. Philadelphia: SIAM; 1975. pp. 104–121. [Google Scholar]
- 39.Medlock J, Galvani AP. Optimizing influenza vaccine distribution. Science. 2009;325:1705–1708. doi: 10.1126/science.1175570. [DOI] [PubMed] [Google Scholar]
- 40.Alonso D, McKane AJ, Pascual M. Stochastic amplification in epidemics. J R Soc Interface. 2007;4:575–582. doi: 10.1098/rsif.2006.0192. [DOI] [PMC free article] [PubMed] [Google Scholar]
- 41.Choisy M, Guegan J, Rohani P. Dynamics of infectious diseases and pulse vaccination: Teasing apart the embedded resonance effects. Physica D. 2006;223:26–35. [Google Scholar]
- 42.Earn DJD, Rohani P, Bolker BM, Grenfell BT. A simple model for complex dynamical transitions in epidemics. Science. 2000;287:667–670. doi: 10.1126/science.287.5453.667. [DOI] [PubMed] [Google Scholar]
- 43.Metcalf CJE, et al. Modelling the first dose of measles vaccination: the role of maternal immunity, demographic factors, and delivery systems. Epidemiol Infect. 2011;139:265–274. doi: 10.1017/S0950268810001329. [DOI] [PMC free article] [PubMed] [Google Scholar]
- 44.Sanders JL. Quantitative guidelines for communicable disease control programs. Biometrics. 1971;27:883–893. [PubMed] [Google Scholar]
- 45.Sethi SP. Quantitative guidelines for communicable disease control programs: A complete synthesis. Biometrics. 1974;30:681–691. [PubMed] [Google Scholar]
- 46.Sethi SP, Staats PW. Optimal control of some simple deterministic epidemic models. J Oper Res Soc. 1978;29:129–136. [Google Scholar]
- 47.Goldman SM, Lightwood J. Cost optimization in the sis model of infectious disease with treatment. Top Econ Anal Pol. 2002;2 Article 4. [Google Scholar]
- 48.Reluga TC. Game theory of social distancing in response to an epidemic. PLoS Comput Biol. 2010;6:e1000793. doi: 10.1371/journal.pcbi.1000793. [DOI] [PMC free article] [PubMed] [Google Scholar]
Associated Data
This section collects any data citations, data availability statements, or supplementary materials included in this article.