Abstract
Purpose: The authors investigate the CB artifact behavior of the factorization approach recently suggested for image reconstruction in circular cone-beam computed tomography. This investigation is carried out in a typical C-arm geometry and involves simulated data and for the first time also phantom and clinical CB data acquired with a commercially available angiographic system.
Methods: The CB artifact level is first measured using quantitative figures-of-merit that are computed from the reconstructions of the mathematical FORBILD head phantom and of a modified disk phantom. The authors then show reconstructions from a physical thorax phantom and clinical head data sets for a visual assessment of image quality. The performance of the factorization method is primarily compared to that of short-scan FDK, but the authors also show the results obtained with the full-scan FDK and the virtual PI-line BPF method for the simulation studies, as a benchmark.
Results: Quantitatively, the FORBILD head phantom reconstructions of both FDK methods show a spatially averaged bias of up to 1.2% in the axial slices about 9 cm away from the plane of the scan, which is placed 4 cm below the central slice through the phantom. The artifact level for the short-scan FDK method and the virtual PI-line BPF method noticeably depends on the scan orientation. The factorization approach can significantly reduce both, this dependency as well as the reconstruction bias. It also shows visually an improved quality of the clinical images compared to short-scan FDK, particularly close to the spine and in the subcranial regions of the clinical data sets.
Conclusions: The factorization approach comes with noticeably lower reconstruction bias than the FDK methods and is least sensitive to the scan orientation among all considered short-scan methods. The data inconsistencies contained in the real data sets, such as scatter, beam hardening, or data truncation, show only little impact on the factorization results. Hence, in both, reconstructions from real and simulated data, the factorization method yields better image quality than short-scan FDK, albeit at the cost of some slight, directed high-frequency artifacts that are mostly visible in axial slices.
Keywords: image reconstruction, computed tomography, cone-beam ct
INTRODUCTION
It is well-known that CT image reconstruction in the short-scan circular cone-beam geometry is an ill-posed problem, because circular data acquisition does not yield a complete set of the three-dimensional (3D) Radon values of the investigated object.1 This complete set, however, would be required for an exact and stable reconstruction of the object attenuation coefficient.2 Missing Radon data causes CB artifacts in the reconstruction results. The strength and appearance of these artifacts depend on the structure of the investigated object but typically also differ significantly from one reconstruction algorithm to another.
Many attractive algorithms have been suggested over the years for short-scan CB reconstruction, see for instance Refs. 3, 4, 5, 6, 7, 8, 9. One recently introduced method is the factorization approach.10 In this algorithm, the 3D problem is decomposed into a set of independent 2D inversion problems using analytical steps. A solution to each 2D problem is then estimated iteratively, involving a gradient-descent scheme with early stopping regularization. First numerical results indicated that the factorization approach is fairly robust with respect to the missing 3D Radon information.10
In this paper, we will further investigate the CB artifact behavior of the factorization approach in a typical C-arm geometry. We will do so using both computer-simulations and, for the first time, real phantom data as well as clinical CB data, thereby allowing assessment of robustness to truncation and to deviations from the line integral model that are due to beam hardening, scatter, and noise, which are all significant sources of errors with C-arm systems. For comparison, we will show the reconstructions obtained with the widely used short-scan FDK method and also give results obtained with full-scan FDK and another recent short-scan algorithm (the virtual PI-line BPF method7) for the simulation studies. Note that the virtual PI-line BPF method shares some similarities with the factorization approach in the sense that both methods first compute an intermediate function in 3D and then transform that function into the sought object attenuation coefficient using operations in the image domain. The virtual PI-line method uses a computationally efficient but heuristic 1D filtering for that second step. The factorization approach, in contrast, involves for that transformation an iterative 2D filtering operation that is theoretically exact but more computationally demanding.
The paper is divided in six sections. Section 2 describes the geometrical preliminaries used throughout the paper, and Sec. 3 provides a brief description of reconstruction parameters applied in the considered methods. Section 4 gives a detailed quantitative assessment of CB artifacts occurring in reconstructions of the mathematical FORBILD head phantom. Section 5 presents reconstructions from real data acquired with a state-of-the-art medical C-arm system. Finally, Sec. 6 summarizes the results of our investigations.
GEOMETRICAL SETUP
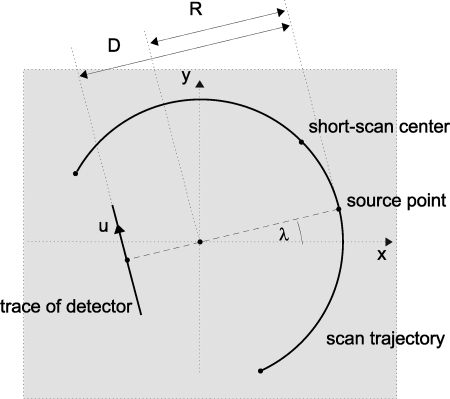
In Secs. 4, 5, we will present reconstructions from several CB data sets. Each data set was acquired (or simulated) using a planar x-ray source trajectory of circular shape. The symbol R denotes the trajectory radius, and λ gives the angular position of the source during the scan.
Relative to the source trajectory, we introduce a right-handed system of coordinates (x, y, z) such that the plane of the scan is at z = 0 mm, and λ is the polar angle in the (x, y)-plane. CB projections are collected∕simulated in the interval [λc − λs∕2 and λc + λs∕2], with λs describing the short-scan length and λc giving the central location on the source trajectory. The angular increment between two adjacent projections is denoted as Δλ. We use a flat panel detector that is at fixed distance D from the source during the whole scan. The detector pixels have size Δu in horizontal and Δv in vertical direction. See Fig. 1 for an illustration and Table Table I. for the specific values of the data acquisition parameters used in the evaluations.
Figure 1.
Top-view illustration of the considered CB acquisition geometry.
Table I.
Geometry parameters fixed during evaluation.
| Simulation | Real data | |
|---|---|---|
| Trajectory radius (mm) | R = 750 | R = 750 |
| Detector-source distance (mm) | D = 1200 | D = 1200 |
| Angular increment (°) | Δλ = 0.4 | Δλ = 0.4 |
| Detector pixel width (mm) | Δu = 0.8 | Δu = 0.616 |
| Detector pixel height (mm) | Δv = 0.8 | Δv = 0.616 |
| Detector size (mm × mm) | 336 × 400 | 382 × 296 |
IMPLEMENTATION DETAILS
In this section, we present some details about the implementation of the considered reconstruction methods. For an in-depth description of these algorithms we redirect the reader to Ref. 11 for full-scan FDK, to Ref. 3 for short-scan FDK, to Ref. 7 for the virtual PI-line BPF method, and to Ref. 10 for the factorization approach.
For the results presented throughout this paper, we applied the FDK methods with sinc-apodization on the ramp-filter Kernel and bilinear interpolation for the backprojection step. Moreover, as short-scan FDK requires a weighting function to approximately cope with redundant data, we selected the extended Parker weighting scheme described in Ref. 12.
The implementation of the factorization approach is identical to that suggested in Ref. 10 and achieves reconstruction by computing the object attenuation coefficient on vertical planes that are orthogonal to the line through the origin and the short-scan center. Note that the algorithm in Ref. 10 requires the selection of several parameters: ε and σ allow control on discretization and sampling artifacts, α enables a balancing between different portions of the input data, and γthres and γmax define the stopping criteria for the iteration process. In this paper, we did not aim at optimizing these parameters, but carried out all calculations with the selection given in Ref. 10, namely α = 0.01, ε = 0.01, σ = 0.07, γthres = 0.002, and γmax = 400.
The virtual PI-line BPF method was implemented according to the scheme described in Ref. 7. Among the two algorithmic alternatives suggested in that paper, we selected the one that involves all acquired projections and uses the Parker-like weighting scheme according to Ref. 12 to handle data redundancies. The virtual PI lines are chosen in the same vertical planes as the planes used in the factorization approach to allow for a fair comparison.
QUANTITATIVE CB ARTIFACT MEASUREMENTS
This section presents a quantitative assessment of CB artifacts using simulated data sets of two mathematical phantoms, namely of a modified disk phantom and of the FORBILD head phantom. Artifact quantification is based on comparing the reconstruction result fe to the true object f using a relative reconstruction error, that is defined for each point x = (x, y, z) at which f(x) ≠ 0 as
| (1) |
This quantity is expressed in percents and its distribution over specific object regions will be used to estimate the CB artifact level, as described below. We also show profiles through the reconstructions fe to further quantify the reconstruction errors.
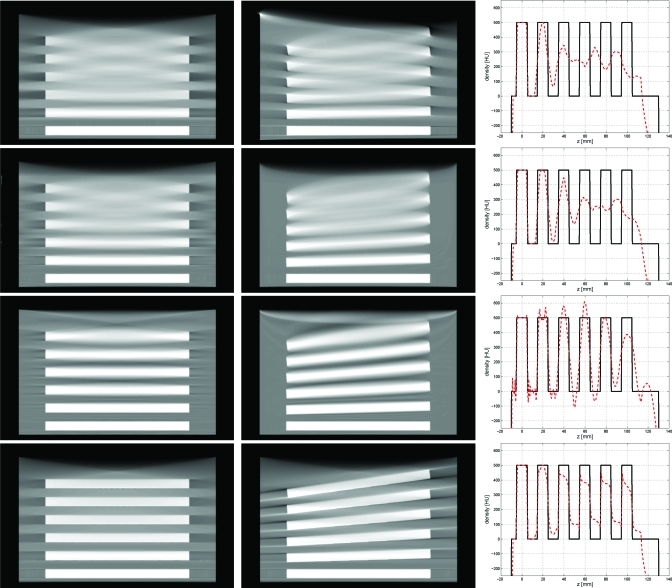
In our first study, we used a phantom that consists of a water cylinder of radius 11 cm and height 14 cm. Inside the cylinder, we placed a stack of six disks, each again cylindrical and of attenuation 500 HU, which are arranged such that the centers of all disks are on the z-axis. The bottom disk is aligned horizontally and placed at the plane of the scan. The centers of any two adjacent disks are 2 cm apart from each other, and the disks become more and more tilted from bottom to top. The tilt is achieved by a rotation about the y-axis, using an angle that increases by 1.5° from one disk to another; see Fig. 2. Data simulation was carried out with no noise and no data truncation, using a short-scan of length 200° that is centered on λc = 0°. Note that the phantom was designed so as to have a significant information content in the region of the 3D Radon space that is not explicitly acquired with circular short-scan data. The projection acquired at λ = 180° allows the disks to be clearly distinguished but this and closeby projections are, however, not part of the simulated short-scan, and only available for the full-scan reference reconstruction.
Figure 2.
Slices though the true phantom values. (Left) The slice x = 0 mm of the FORBILD head phantom, (center, right) slices x = 0 mm, and y = 0 mm though the modified disk phantom, respectively. The dashed lines at z = 0 mm indicate the plane of the scan. The additional dashed lines in the left and right images show the location of the plane investigated in Fig. 4 (z = 52.5 mm) and the location of the profile used in Fig. 3 (x = 0 mm).
Figure 3 shows the reconstructed values on the two vertical slices, x = 0 mm and y = 0 mm, as well as a vertical profile of these results along the line indicated in Fig. 2. In the full-scan FDK reconstruction, the disks boundaries are sharply delineated allowing a clear distinction between disks and gaps in the entire phantom. There are shadow artifacts remaining around to the disks but altogether, the full-scan results clearly outperform the short-scan FDK reconstructions, as expected. The factorization method and the virtual PI-line BPF method both noticeably reduce the shadow artifacts, particularly in the slice y = 0 mm. However, whereas the virtual PI-line method does not significantly improve the disk separation compared to short-scan FDK, the factorization method is capable of recovering the overall disk structure fairly well. The factorization results come visually close to that of full-scan FDK that we will use as our benchmark throughout the rest of this section.
Figure 3.
Reconstructions of the modified disk phantom, all in [−500 and 500 HU], for (from top to bottom) short-scan FDK, the virtual PI-line method, the factorization approach and full-scan FDK. (left) The slice x = 0 mm, (center) the slice y = 0 mm, (right), and the z-profile through the reconstruction at x = 0 mm and y = 0 mm in red color, next to the original values in black.
The following CB artifact quantification study is based on the FORBILD head phantom, which was shifted vertically so that its central slice is at z = 40 mm, as depicted in the left of Fig. 2. CB projections were generated according to the values in Table Table I. without noise for several short-scan configurations, all of them of length λs = 210°, and for a full-scan (to enable the benchmark reconstruction with full-scan FDK). Note that the detector size assumed during simulation was again large enough to avoid any truncation in the projections.
We then investigated image quality on a slice by slice basis, using axial slices, i.e., slices that are orthogonal to the z-axis. A region Sz was identified within each axial slice; this region is the set of points that have true values of f between 30 and 80 HU, and that are at least 0.5 mm away from the discontinuities in the object, to avoid effects of finite spatial resolution. CB artifacts were then quantified using the distribution of the relative reconstruction error ε(x) for ; we here represent this distribution by its mean and its standard deviation . Note that a mean value different from indicates a reconstruction bias, while describes the heterogeneity of the CB artifact structure.
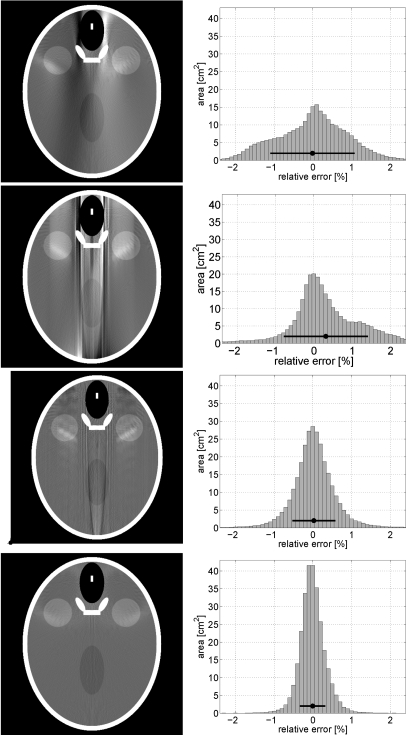
Figure 4 presents results for the short-scan centered at λc = 0° and also for the full-scan reconstruction. The left column shows the reconstructed densities within the slice of z = 52.5 mm. The corresponding distribution of ε within Sz is presented in the histogram on the right. The two figures-of-merit (FOMs) and are indicated with a black circle and a black horizontal line in each histogram, respectively. We observe that short-scan FDK and the BPF method yield a fairly wide-spread error histogram, while in the factorization results, the distribution is much more compact and closer to the benchmark reconstruction obtained with full-scan FDK. Visually, the remaining artifacts of the factorization method in these axial slices tend to appear like light, thin streaks that affect only localized regions within the reconstructions. This behavior is different from that of short-scan FDK, which comes with low-frequency, more globally distributed CB artifacts.
Figure 4.
CB artifact assessment in the reconstructions of the FORBILD head phantom for (from top to bottom) short-scan FDK, the virtual PI-line method, the factorization approach and full-scan FDK. (Left) The slice z = 52.5 mm in the gray-scale window [0 and 100 HU] and (right) histograms of the relative reconstruction error for pixels within region Sz for the presented slice. The horizontal bar in each histogram shows the mean (circle) and standard deviation (half-width of the bar) of the histogram.
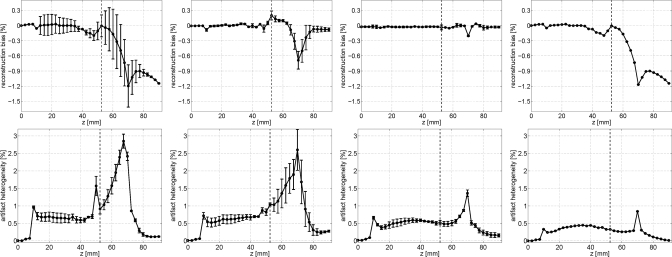
In short-scan geometries, CB artifacts typically vary with the scan orientation. To investigate this issue, the quantification described above was carried out for six short-scans with varying scan center λc = {0°, 60°, 120°, 180°, 240°, and 300°}. Doing so, we obtain for each slice 6 values for the reconstruction bias. These six values are summarized by their mean and standard deviation. The top of Fig. 5 shows these two quantities as a function of the slice z. The artifact heterogeneity is quantified in a similar way, using for each slice the mean and standard deviation of across the six experiments; see the bottom of Fig. 5 for an illustration of the artifact heterogeneity FOM.
Figure 5.
The CB artifact FOMs (top) reconstruction bias and (bottom) artifact heterogeneity, as a function of z. The black circles indicate the mean of these FOMs across six CB data sets with different short-scan center λc, while the errorbars illustrate the FOM standard deviations across these six different data sets. From (left) to (right): the short-scan FDK method, the virtual PI-line BPF method, the factorization method and full-scan FDK.
As expected, all methods perform well close to the plane of the scan, but farther away from this plane, in particular where the object density varies significantly in z, the strength of CB artifacts increases noticeably. For short-scan FDK, we observe a strong bias (reaching up to 1.2%), a strong artifact heterogeneity of maximum 3%, and a high sensitivity to the scan orientation (see the long error bars in the corresponding plots). Compared to short-scan FDK, the virtual PI-line method provides a good improvement in the reconstruction bias and its dependence on the scan orientation, but not in the artifact heterogeneity, which is of the same magnitude (although the artifact appearance is certainly different—more streaky) and depends more strongly on the scan orientation. The factorization approach performs much better than short-scan FDK and the virtual PI-line method: the dependence on the scan orientation is very small, the reconstruction bias is very low, and the artifact heterogeneity is strongly reduced. Compared to full-scan FDK, the factorization approach appears better in terms of reconstruction bias, but not in terms of artifact heterogeneity, which remains significantly larger, as one could expect.
REAL DATA RECONSTRUCTIONS
We now present several reconstructions from short-scan CB data collected on a commercially available C-arm system (Siemens AXIOM Artis13) for visual inspection of image quality in a real data setting. From now on, we compare the factorization method only to the results of the short-scan FDK method, i.e., the method that is the standard in the practical application. In contrast to the simulated data, the real data contains inconsistencies that are caused by physical effects in the acquisition process or by some data preprocessing algorithms. Our focus is to see if the factorization method can handle these inconsistencies robustly and retain its image quality benefits compared to short-scan FDK. Note that the acquisition geometry of a real C-arm system slightly deviates from the ideal assumptions described in Sec. 2; the geometrical deviations were accounted the same way for the investigated algorithms, namely by adjusting the backprojection step.
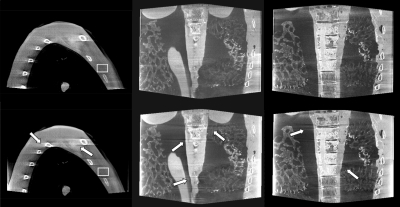
In a first, preclinical study, we scanned a fairly wide physical thorax phantom using a short-scan of length λs = 215°, centered on λc = 107.5°, and using two distinct scenarios of truncation. In scenario A, the projection of the thorax was never truncated across the upper detector boundary, and transaxial truncation occurred near the ends of the short-scan (specifically, over the ranges λ ∈ [0°,80°] and λ ∈ [150°,215°]). In scenario B, the CB projections were always truncated in the axial direction, and severe transaxial truncation occurred mainly away from the short-scan ends (specifically over the range of λ ∈ [40°,175°]). Figure 6 presents the reconstruction results in both scenarios on vertical planes, each of which was obtained by averaging three planar results that are spaced by 0.25 mm. The averaging reduces noise and contributes to a better visibility of potential CB artifacts in the images. Note that the planes in Fig. 6, and also the ones in Fig. 7 later on are parallel to the choice of planes on which the 2D iteration occurred in the factorization approach.
Figure 6.
Reconstruction from the real C-arm data sets in scenario A (left) and scenario B (center and right), obtained with (bottom) short-scan FDK and (top) the factorization approach. The results are presented selecting gray-scale-windows such that the mean of the reconstructed values in specific ROIs gave identical gray values in both images. One such ROI is illustrated in the images on the left side. The arrows highlight some regions where short-scan FDK shows strong CB artifacts.
Figure 7.
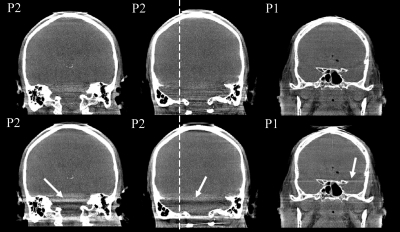
Coronal slices through the reconstructions of the clinical C-arm data sets, obtained with (bottom) short-scan FDK and (top) the factorization approach. The gray-scale window was set to a width of 700 units on the Hounsfield scale. The white arrows again highlight artifact regions in the short-scan FDK results and the label at the top-left in each image indicates the data set (P1–patient 1 and P2–patient 2).
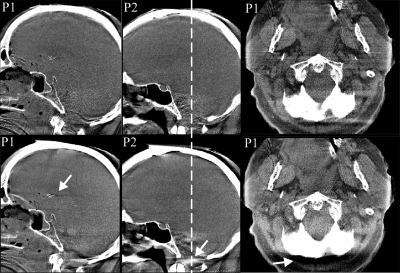
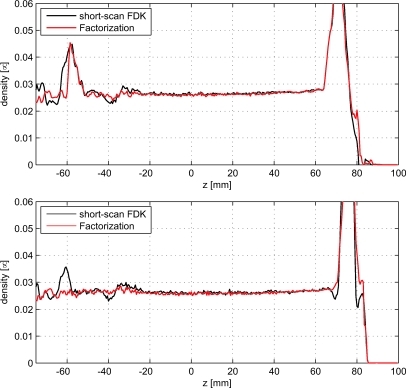
In a second real data study, we used clinical head data sets of two patients (named P1 and P2) acquired at the Department of Neuroradiology, University of Erlangen. Figure 7 presents three coronal planes of thickness 3 mm through the reconstruction results, in a HU window of width 700; Sagittal and axial slices are presented in Fig. 8. Intensity profiles through some of these slices are given in Fig. 9.
Figure 8.
Sagittal and axial slices through the clinical C-arm data sets, in a HU window of width 700, reconstructed with (bottom) short-scan FDK and (top) the factorization approach.
Figure 9.
Profiles through the reconstructed values in (top) the slice in the center of Fig. 6 and (bottom) the slice in the center of Fig. 7. The profiles show the densities along the z-direction and were obtained by using the reconstructed values in a narrow strip of width 10 mm, centered on the white dashed lines in the respective slices, rather than from a single line, to reduce noise.
From these results, we observe that the short-scan FDK approach yields fairly strong artifacts tangent to the bony object structures, as indicated with the white arrows. The factorization approach shows a clear reduction of these artifacts and also more tolerance with respect to transaxial truncation (as can be observed near the ribs in the thorax reconstructions). The remaining artifacts tend to be streaklike and directed along the direction of the factorization planes, so that they can be visible in axial slices. Altogether, however, we can see that, in comparison with the FDK method, the factorization approach provides significant improvements in image quality. These improvements are particularly visible near the spine in the thorax phantom study and in the subcranial regions in the clinical data sets, and they come with no noticeable change in robutsness for physical-effect imperfections in the data.
CONCLUSIONS AND OUTLOOK
In this paper, we investigated in more details the CB artifact behavior of the factorization approach that was recently suggested for short-scan circular CB CT. We carried out a quantitative artifact assessment that demonstrated that the factorization approach yields a very low reconstruction bias and strong improvements in artifact heterogeneity, in comparison with short-scan FDK and the virtual PI-line BPF method. Additionally, the scan orientation was shown to play much less of a role on the artifact strength.
The image quality improvements observed in the simulation study also hold for medical data sets, as demonstrated on the reconstructions of a physical thorax phantom and of neuro data sets acquired with the Siemens AXIOM Artis C-arm system. These benefits for clinical applications were not obvious, since the real CB data contains various physical effects that are inconsistent with the data model that the factorization approach relies on (as well as the FDK methods). Despite these inconsistencies, the factorization approach significantly reduced the CB artifacts that are present in the short-scan FDK results close to the vertebrae and in the subcranial regions. The left-over artifacts of the factorization method are low-intensity, directed streaks which affect only small areas within the results, but which could be disturbing when looking at axial slices. It would be interesting to investigate if these streaks can be reduced by adding, e.g., an algorithmic constraint within the 2D iteration procedure that enforces similarity between the reconstructions of adjacent planes. This strategy, however, is a part of future research.
The paper focused on comparisons using one hand the short-scan FDK method, because this method is widely used in commercial systems, and on the other hand using the virtual PI-line method, for which attractive results were shown in Ref. 7. We acknowledge that several other reconstruction algorithms3, 4, 5, 6, 8, 9 that showed improvements over the short-scan FDK method have been proposed in the literature. It would be interesting to compare the performance of these methods to that of the factorization approach, but such a comprehensive comparison was outside the scope of this paper.
ACKNOWLEDGEMENT
The authors thank Dr. med. Tobias Struffert, Department of Neuroradiology, University of Erlangen, for providing the clinical patient data sets. The concepts and information presented in this paper are based on research and are not commercially available. This work was partly supported by the U.S. National Institutes of Health (NIH) under Grant No: R21 EB-009168.
References
- Finch D.V., “Cone-beam reconstruction with sources on a curve,” SIAM J. Appl. Math. 45(4), 665–673 (1985). 10.1137/0145039 [DOI] [Google Scholar]
- Tuy H. K., “An inversion formula for cone-beam reconstruction,” SIAM J. Appl. Math. 43(3), 546–552 (1983). 10.1137/0143035 [DOI] [Google Scholar]
- Wang G., Liu Y., Lin T. H., and Cheng P. C., “Half-scan cone-beam X-ray microtomography formula,” Scanning 16(4), 216–220 (1994). 10.1002/sca.4950160406 [DOI] [PubMed] [Google Scholar]
- Turbell H., Cone-Beam Reconstruction Using Filtered Backprojection (Linkoeping studies in science and technology, Linkoeping University, 2001). [Google Scholar]
- Yu H. and Wang G., “Feldkamp-type VOI reconstruction from super-short-scan cone-beam data,” Med. Phys. 31(6), 1357–1362 (2004). 10.1118/1.1739298 [DOI] [PubMed] [Google Scholar]
- Grass M., Koehler T., and Proksa R., “3D cone-beam CT reconstruction for circular trajectories,” Phys. Med. Biol. 45(2), 329–347 (2000). 10.1088/0031-9155/45/2/306 [DOI] [PubMed] [Google Scholar]
- Yu L., Zou Y., Sidky E. Y., Pelizzari C. A., Munro P., and Pan X., “Region of interest reconstruction from truncated data in circular cone-beam CT,” IEEE Trans. Med. Imaging 25(7), 869–881 (2006). 10.1109/TMI.2006.872329 [DOI] [PubMed] [Google Scholar]
- Nett B. E., Zhuang T. L., Leng S., and Chen G. H., “Arc-based cone-beam reconstruction algorithm using an equal weighting scheme,” J. X-Ray Sci. Technol. 15(1), 19–48 (2007). [Google Scholar]
- Hsieh J. and Tang X., “Conjugate backprojection approach for cone beam artifact reduction,” Proc. SPIE 6142, 758–764 (2006). [Google Scholar]
- Dennerlein F., Noo F., Schoendube H., Hornegger J., and Lauritsch G., “A factorization approach for cone-beam reconstruction on a circular short-scan,” IEEE Trans. Med. Imaging 27(7), 887–896 (2008). 10.1109/TMI.2008.922705 [DOI] [PMC free article] [PubMed] [Google Scholar]
- Feldkamp L. A., Davis L. C., and Kress J. W., “Practical cone-beam algorithm,” J. Opt. Soc. Am. A 1(6), 612–619 (1984). 10.1364/JOSAA.1.000612 [DOI] [Google Scholar]
- Silver M. D., “A method for including redundant data in computed tomography,” Med. Phys. 27(4), 773–774 (2000). 10.1118/1.598939 [DOI] [PubMed] [Google Scholar]
- AXIOM Artis dBA, “Biplane C-arm system with flat detector for angiography,” Siemens AG, Medical solutions.


