

Abstract
11C-PBR28 PET can detect the 18-kDa translocator protein (TSPO) expressed within macrophages. However, quantitative evaluation of the signal in brain tissue from donors with multiple sclerosis (MS) shows that PBR28 binds the TSPO with high affinity (binding affinity [Ki], ~4 nM), low affinity (Ki, ~200 nM), or mixed affinity (2 sites with Ki, ~4 nM and ~300 nM). Our study tested whether similar binding behavior could be detected in brain tissue from donors with no history of neurologic disease, with TSPO-binding PET ligands other than 11C-PBR28, for TSPO present in peripheral blood, and with human brain PET data acquired in vivo with 11C-PBR28.
Methods
The affinity of TSPO ligands was measured in the human brain post-mortem from donors with a history of MS (n = 13), donors without any history of neurologic disease (n = 20), and in platelets from healthy volunteers (n = 13). Binding potential estimates from thirty-five 11C-PBR28 PET scans from an independent sample of healthy volunteers were analyzed using a gaussian mixture model.
Results
Three binding affinity patterns were found in brains from subjects without neurologic disease in similar proportions to those reported previously from studies of MS brains. TSPO ligands showed substantial differences in affinity between subjects classified as high-affinity binders (HABs) and low-affinity binders (LABs). Differences in affinity between HABs and LABs are approximately 50-fold with PBR28, approximately 17-fold with PBR06, and approximately 4-fold with DAA1106, DPA713, and PBR111. Where differences in affinity between HABs and LABs were low (~4-fold), distinct affinities were not resolvable in binding curves for mixed-affinity binders (MABs), which appeared to express 1 class of sites with an affinity approximately equal to the mean of those for HABs and LABs. Mixed-affinity binding was detected in platelets from an independent sample (HAB, 69%; MAB, 31%), although LABs were not detected. Analysis of 11C-PBR28 PET data was not inconsistent with the existence of distinct subpopulations of HABs, MABs, and LABs.
Conclusion
With the exception of 11C-PK11195, all TSPO PET ligands in current clinical application recognize HABs, LABs, and MABs in brain tissue in vitro. Knowledge of subjects’ binding patterns will be required to accurately quantify TSPO expression in vivo using PET.
Keywords: TSPO, mixed-affinity binding, radioligand binding
The 18-kDa translocator protein (TSPO) is expressed within microglia and macrophages and has been used as a target for PET ligands to study disease processes that involve microglial activation or the recruitment of macrophages, such as multiple sclerosis (MS) and Alzheimer disease (1,2). The PET radioligand 11C-PK11195 has been used most frequently for this purpose, but signal quantification is limited by poor specific signal-to-background ratio (1).
11C-PBR28 is a new high-affinity TSPO PET radioligand with a more favorable specific–to–nonspecific binding ratio than 11C-PK11195 (3). However, PET studies using 11CPBR28 have shown that approximately 10% of healthy volunteers do not show a specific binding signal in either the brain or the peripheral organs (4). Lymphocytes isolated from these subjects, compared with the rest of the population, also have a marked reduction in affinity for PBR28, suggesting a global reduction in affinity of PBR28 for the TSPO (5). This hypothesis is supported by our work using brain tissue donated predominantly from individuals with an antemortem diagnosis of MS. That study found that, compared with tissue samples from donors designated as high-affinity binders (HABs; 46%), samples from those designated as low-affinity binders (LABs; ~23%) demonstrated a reduced affinity for PBR28 (binding affinity [Ki], ~4 vs. ~200 nM) (6). We also identified a third group of donors, designated as mixed-affinity binders (MABs; 31%), who showed behavior consistent with the presence of 2 PBR28 binding sites in approximately equal number, with affinities similar to those of LABs and HABs (~4 and ~300 nM) (6). In contrast to PBR28, PK11195 binds with similar affinity in all subjects, which may explain why non-binding has not been reported with this radioligand. It has not been established whether mixed-affinity binding is a phenomenon specific to MS or whether it also occurs in nondiseased brain tissue. It is also unknown whether mixed-affinity binding is unique to brain tissue.
The presence of differing affinities in the general population complicates the quantitative assessment of PET data, because differences in 11C-PBR28 signal cannot be safely interpreted as differences in target density. LABs are easily identifiable from a 11C-PBR28 PET scan because their specific signal is negligible (5) and are therefore easily eliminated from a cohort. MABs, however, cannot be distinguished from HABs in a single PET scan, although it may be possible to classify a subject’s status by testing TSPO in blood and assuming that the binding affinity measured in peripheral blood reflects that in the brain. Population corrections then could be applied to compare subjects even when their binding affinities are different.
The phenomenon of low-affinity binding has not been reported with other TSPO PET ligands currently in clinical use, such as 18F-PBR111, 18F-PBR06 (7), 11C-DPA713 (8), and 11C-DAA1106 (2), possibly because these ligands do not distinguish between HABs and LABs. Alternatively, it may be that differences in affinity exist but, because a PET signal is dependent on both receptor density and affinity, the differences have not been recognized in vivo.
Our study had 4 aims. First, we tested whether the phenomenon of mixed-affinity binding was restricted to MS or whether it was also found in neuropathologically normal brain tissue. Second, we examined whether the 3 binding patterns defined with PBR28 also were found with other TSPO ligands in clinical use. Third, we investigated whether it may be feasible to identify MABs from a peripheral blood assay by analysis of platelet binding. Finally, using a set of 11C-PBR28 PET brain scans acquired previously, we tested whether there was any evidence for mixed-affinity binding in humans in vivo.
MATERIALS AND METHODS
Human Tissue
Brain Tissue
Tissue was obtained from the U.K. Multiple Sclerosis Tissue Bank at Imperial College. Of the 33 donors, 13 had been diagnosed with MS, and 20 had no history of neurologic disease. All tissue blocks obtained included only normal-appearing tissue, without immunohistochemical evidence of demyelination or significant inflammatory infiltrate. The tissue was stored at −80°C until use. Demographic, tissue-handling, and clinical information concerning the donor is found in Supplemental Table 1 (supplemental materials are available online only at http://jnm.snmjournals.org). The binding profiles for donors B1–B15 inclusive (13/15 with MS and 2/15 with no history of neurologic disease) had been established previously using PBR28 (6). Tissue from these donors was used to measure binding affinity with PBR06, PBR111, DPA713, and DAA1106. Because of tissue shortage, not all assays used all 15 donors. Tissue from donors B14–B33 inclusive (20/20 with no history of neurologic disease) was used to estimate the proportions of the binding profiles in nondiseased brains.
Platelets
In an independent sample, 13 healthy volunteers (P1–P13) were recruited and venesection performed. These procedures were approved by the local Research Ethics Committee (reference no. 09/H0711/4). Demographic details concerning the volunteers are found in Supplemental Table 2.
Materials
3H-PK11195 (3H-1-(2-chlorophenyl)-N-methyl-N-(1-methylpropyl)-3-isoquinolinecarboxamide; specific activity, 2.96 TBq/mmol [80 Ci/mmol]; radioactive concentration, 37 MBq/mL [1.0 mCi/mL]) was purchased from Perkin Elmer, and 3H-PBR28 (N-{[2-(methyloxy) phenyl]methyl}-N-[4-(phenyloxy)-3-pyridinyl]acetamide; specific activity, 3.034 TBq/mmol [82 Ci/mmol]; radioactive concentration, 37 MBq/mL [1.0 mCi/mL]) was custom-labeled by GE Healthcare. Unlabeled PK11195 was obtained from Sigma; PBR06 and PBR111 were gifts from MNI. DPA713 and DAA1106 were synthesized in-house according to previously described procedures (9,10). 11C-PBR28 for intravenous injection into human subjects was produced under a U.S. exploratory investigational new drug application by 11C-methylation of its O-desmethyl precursor, as previously described (7).
Membrane Preparation (Brain Tissue)
Tissue blocks were homogenized in 10 times w/v buffer (0.32 mM sucrose, 5 mM Tris base, 1 mM MgCl2, pH 7.4, 4°C). Homogenates were centrifuged (32,000g, 20 min, 4°C), followed by removal of the supernatant. Pellets were resuspended in at least 10 times w/v buffer (50 mM Tris base, 1 mM MgCl2, pH 7.4, 4°C), followed by 2 washes by centrifugation (32,000g, 20 min, 4°C). Membranes were suspended in buffer (50 mM Tris base, 1 mM MgCl2, pH 7.4, 4°C) at a protein concentration of approximately 4 mg of protein/mL, and aliquots were stored at −80°C until use.
Membrane Preparation (Platelets)
Whole blood (20 mL) was collected from each volunteer into ethylenediaminetetraacetic acid–containing tubes and centrifuged (180g, 15 min, 4°C). The supernatant (platelet-rich plasma) was collected and centrifuged (1,800g, 15 min, 4°C). The supernatant was discarded, and the platelet-containing pellet was stored at −80°C until use. Platelet pellets were homogenized in 10 times w/v buffer (0.32 mM sucrose, 5 mM Tris base, 1 mM MgCl2, pH 7.4, 4°C). Homogenates were centrifuged (48,000g, 15 min, 4°C), followed by removal of the supernatant. Pellets were resuspended in at least 10 times w/v buffer (50 mM Tris base, 1 mM MgCl2, pH 7.4, 4°C), followed by 2 washes by centrifugation (48,000g, 15 min, 4°C). Membranes were suspended in buffer (50 mM Tris base, 1 mM MgCl2, pH 7.4, 4°C) at a protein concentration of approximately 4 mg of protein/mL, and aliquots were stored at −80°C until use.
Competition Binding Assays
Aliquots (~250 μg of protein/mL) of membrane suspension were prepared using assay buffer (50 mM Tris base, 140 mM NaCl, 1.5 mM MgCl2, 5 mM KCl, 1.5 mM CaCl2, pH 7.4, 37°C) and incubated with 3H-PK11195 (5 nM) and 1 of 12 concentrations of ligand (either PBR06, PBR111, DAA1106, or DPA713), ranging from 0.1 nM to 300 μM, in a final volume of 500 μL for 60 min at 37°C. The specific binding component was determined using unlabeled PK11195 (10 μM). After incubation, assays were terminated via filtration through Whatman GF/B filters, followed by 3 × 1-mL washes with ice-cold buffer (50 mM Tris base, 1.4 mM MgCl2, pH 7.4, 4°C). Whatman GF/B filters were preincubated with 0.05% polyethyleneimine (60 min) before filtration. Scintillation fluid (4 mL/vial; Ultima Gold MV [Perkin Elmer]) was added and vials counted on a Perkin Elmer Tricarb 2900 liquid scintillation counter. For each donor, each point was performed in triplicate. Ki (nM) values were determined using GraphPad Prism software (version 5.0; GraphPad Software Inc.). To measure the affinity of PBR111 for the low-affinity site only, the assay was performed as above but with the addition of unlabeled PBR28 (50 nM) in each well. At this concentration, PBR28 will occupy approximately 94% of binding sites in HABs and approximately 21% of binding sites in LABs. PBR111 was chosen for this assay as an example of a ligand that does not identify 2 binding sites in the MABs.
Protein Concentration Determination
Protein concentrations (micrograms of protein per milliliter) were determined using a bicinchoninic acid assay (BCA Kit; Sigma-Aldrich), and absorption was read at 562 nm.
Data Analysis
All competition data were analyzed using the iterative nonlinear regression curve-fitting software supplied with GraphPad Prism 5.0. Single-site and 2-site competition models were fitted to the data using the least-squares algorithm, and the model was selected using an F test. The null hypothesis, that the data fitted a single-site model, was rejected if the P value was less than 0.05. A dissociation constant (Kd) of 29.25 nM for 3H-PK11195 (6) was used to generate the Ki for PK11195, PBR28, PBR06, PBR111, DAA1106, and DPA713 according to the Cheng and Prusoff equation (11). Subjects were classified by their behavior in competition assays with PBR28: HABs were defined as subjects with a single class of binding sites with Ki less than 15 nM, LABs were defined as subjects with a single class of binding sites with Ki greater than 100 nM, and MABs were defined as subjects with 2 binding sites. There were no subjects who showed a best fit to a single class of binding sites with between 15 and 100 nM. Data are expressed as the mean ± SEM. The Student t test (GraphPad Prism 5.0) was used to determine statistical significance.
Analysis of 11C-PBR28 PET Scans
Thirty-five healthy volunteers (24/35 were men; age range, 19–70 y; mean age, 41.4 y) who had undergone PET with 11C-PBR28 using an Advance camera (GE Healthcare) were analyzed to determine whether there was evidence of multimodal distribution in the population. Parametric images of total volume of distributions (VT) were created by the Logan plot (12) using brain data acquired for 120 min and a metabolite-corrected arterial input function. After spatial normalization of the parametric images to the Montreal Neurologic Institute space using coregistered T1-weighted MRI, VT in the entire frontal cortex was obtained using the template developed by Tzourio-Mazoyer et al. (13). In addition, an associated measure of the plasma free fraction (fP), derived from ultrafiltration (4), allowed for the calculation of the volume of distribution in relation to the free plasma concentration (VT/fP). VTs from approximately 10% (3/35) of patients could not be determined because the specific signal was too low (4); these patients are likely to represent LABs, and these data were excluded from the following analysis. For the remaining subjects, a gaussian-mixture model was fitted separately to population estimates of VT, fP, and VT/fP to investigate the likely number of components evident in the in vivo data. The method involved fitting a combination of univariate normal-density functions to the data series, implemented in MATLAB (The MathWorks). The data were fit with 1, 2, 3, 4, and 5 gaussians, and the Akaike information criterion (AIC) was obtained to assist with model order determination (a lower AIC value, indicating a more parsimonious model). Data are expressed as mean ± SD.
RESULTS
Detection of MABs in Brain Tissue Donors with No History of Neurologic Disease (Donors B14–B33)
Binding affinity with PBR28 was measured in brain samples from 20 patients with no history of neurologic disease (Fig. 1). Nine of 20 (45%) bound to a single class of high-affinity receptors (Ki = 2.9 ± 0.26 nM) and were therefore classified as HABs. Four of 20 (20%) bound to a single class of low-affinity receptors (Ki = 237 ± 35.0 nM) and were classified as LABs. In 7 of 20 (35%), the data fitted best to a 2-site model with affinities of 3.6 ± 2.0 and 1,409 ± 803 nM. These subjects were classified as MABs. For the MABs, the mean fraction of high-affinity sites was 58% ± 6.6%, with values ranging from 38% to 83%.
FIGURE 1.
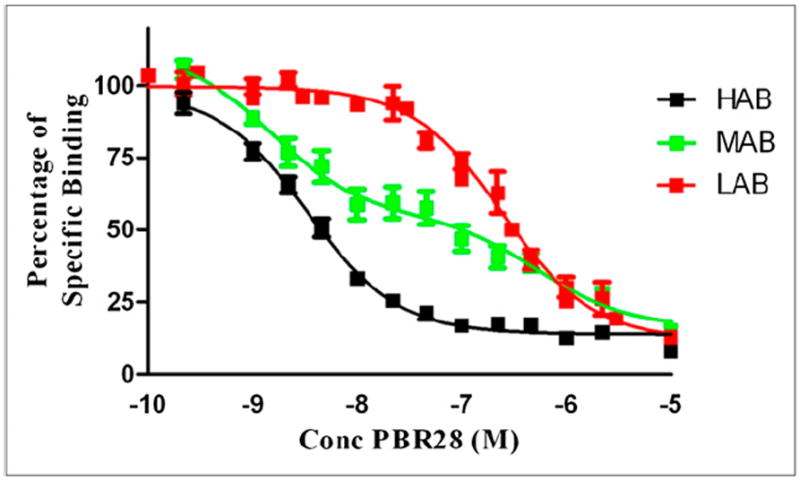
Competition assay with 3H-PK11195 and unlabeled PBR28, using tissue from donors with no history of neurologic disease. Each data point represents mean value of all subjects, and error bars represent SEM. Conc = concentration.
Estimation of PBR06 Ki in Brain Tissue (Donors B1–B15)
Competition assays with unlabeled PBR06 were performed with tissue from 13 donors (Fig. 2). The mean Ki value for the HABs (8.6 ± 2.0 nM, n = 5) was significantly lower than that of the LABs (149 ± 46.6 nM, n = 4; P < 0.01; Table 1). The Ki value for the high-affinity MAB site (13.4 ± 3.4 nM, n = 4) was similar to that of HABs, and the Ki value for the low-affinity MAB site (176 ± 103 nM, n = 4) was similar to that of LABs.
FIGURE 2.
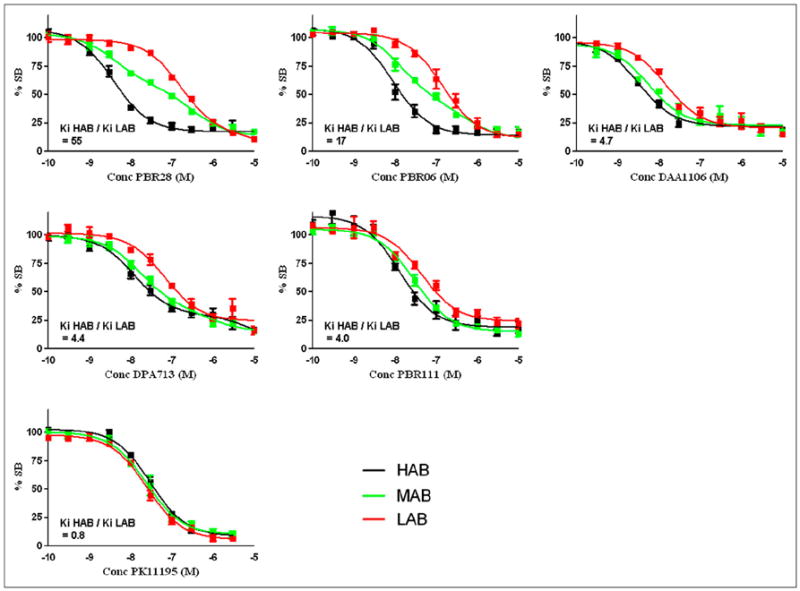
Competition assays with 3H-PK11195 and unlabeled TSPO ligand using brain tissue previously characterized as HAB, LAB, or MAB by PBR28 assays. Each data point represents mean value of at least 4 subjects, and error bars represent SEM. (A) Phenoxyphenyl acetamide derivatives. (B) Bicyclic linker derivatives. (C) Phenyl–isoquinolinecarboxamide derivatives. Conc = concentration; SB = specific binding.
TABLE 1.
Competition Binding Studies with PK11195, PBR28, PBR06, PBR111, DPA713, and DAA1106
| Binding class |
Ki (nM) of…
|
|||||
|---|---|---|---|---|---|---|
| PK11195* | PBR28* | PBR06 | DPA713 | DAA1106 | PBR111 | |
| HABs | 28.3 ± 4.0 (n = 6) | 3.4 ± 0.2 (n = 6) | 8.6 ± 2.0 (n = 5) | 15.0 ± 2.2 (n = 5) | 2.8 ± 0.3 (n = 4) | 15.6 ± 3.7 (n = 5) |
|
| ||||||
| LABs | 22.3 ± 2.2 (n = 5) | 188 ± 7.0 (n = 5) | 149 ± 46.6 (n = 4) | 66.4 ± 7.8 (n = 4) | 13.1 ± 1.3 (n = 4) | 61.8 ± 10.7 (n = 5) |
|
| ||||||
| MABs | 23.6 ± 5.5 (n = 4) | Two receptors detected (n = 4): 4.0 ± 1.2 (high) and 313 ± 38 (low) | Two receptors detected (n = 4): 13.4 ± 3.4 (high) and 176 ± 103 (low) | 26.8 ± 2.9 (n = 4) | 4.8 ± 0.4 (n = 4) | 30.3 ± 4.1 (n = 4) |
|
| ||||||
| Ki ratio of LAB to HAB | 0.8 | 55 | 17 | 4.4 | 4.7 | 4.0 |
|
| ||||||
| t test | ||||||
| HAB vs. LAB | P < 0.25 | P < 0.0001 | P < 0.011 | P < 0.001 | P < 0.001 | P < 0.003 |
| MAB vs. LAB | P < 0.82 | NA | NA | P < 0.003 | P < 0.001 | P < 0.04 |
| MAB vs. HAB | P < 0.50 | NA | NA | P < 0.01 | P < 0.005 | P < 0.03 |
Data reproduced from Owen et al. (6).
NA = not applicable.
Data are expressed as mean ± SEM. All data in Table 1 were generated from donors B1–B15, inclusive.
Estimation of DPA713 Ki in Brain Tissue (Donors B1–B15)
Competition assays with unlabeled DPA713 were performed with tissue from 13 donors (Fig. 2). The mean Ki value for the HABs (15.0 ± 2.2 nM, n = 5) was significantly lower than that of the LABs (66.4 ± 7.8 nM, n = 4; P < 0.001; Table 1). The data from all MABs were best described by a single-site model, with a mean Ki value (26.8 ± 2.9 nM, n = 4) similar to the mean Ki value of HABs and LABs (40.7 nM).
Estimation of DAA1106 Ki in Brain Tissue (Donors B1–B15)
Competition assays with unlabeled DAA1106 were performed with tissue from 12 donors (Fig. 2). The mean Ki value for the HABs (2.8 ± 0.3 nM, n = 4) was significantly lower than that of the LABs (13.1 ± 1.3 nM, n = 4; P < 0.001; Table 1). For the MABs, all data fitted best to a single-site model (4.8 ± 0.4 nM, n = 4), which was similar to the mean Ki value of HABs and LABs (8.0 nM).
Estimation of PBR111 Ki in Brain Tissue (Donors B1–B15)
Competition assays with unlabeled PBR111 were performed with tissue from 14 donors (Fig. 2). The mean Ki value for the HABs (15.6 ± 3.7 nM, n = 5) was significantly lower than that for the LABs (61.8 ± 10.7 nM, n = 5; P < 0.003; Table 1). The data from all MABs were best described by a single-site model, with a mean Ki value (30.3 ± 4.1 nM, n = 4) similar to the mean Ki value of HABs and LABs (38.7 nM).
Because data from MABs with PBR111 were best described by a single-site model, with a mean Ki value similar to the mean Ki value of HABs and LABs, we hypothesized that 2 sites were present in MABs but too close in affinity to resolve. To test this hypothesis the assays were repeated in the presence of PBR28 (50 nM) to block the high-affinity sites in all samples. For the HABs, the specific signal decreased by 70% after blockade with PBR28, rendering the signal-to-noise ratio too low to determine the affinity to the HAB site (Table 2). For the LABs, the specific signal dropped by 21% because of the PBR28 occupying a fraction of the LAB sites, but the Ki value did not significantly change (61.8 ± 10.7 nM to 51.7 ± 12.2 nM [n = 4]; P = 0.55; Table 2; Fig. 3). For the MABs, the specific signal dropped by 49%, and the Ki value increased significantly from 30.3 ± 4.1 nM, which is similar to the mean Ki value of HABs and LABs, to 54.4 ± 5.3 nM (n = 4, P < 0.01), which is similar to the mean Ki value of the LABs (Fig. 3). Data from all patients were best described by a single-site model.
TABLE 2.
Competition Binding Studies with PBR111 in Absence and Presence of 50 nM of PBR28
| Binding class |
Ki (nM) of…
|
Reduction (%) in specific signal after block with PBR28 (50 nM) | |
|---|---|---|---|
| PBR111 | PBR111 after block with PBR28 (50 nM) | ||
| HABs | 15.6 ± 3.7 (n = 5) | Not measurable | 69.0 ± 4.6 (n = 4) |
|
| |||
| LABs | 61.8 ± 10.7 (n = 5) | 51.7 ± 12.2 (n = 4) | 21.2 ± 4.8 (n = 4) |
|
| |||
| MABs | 30.3 ± 4.1 (n = 4) | 54.4 ± 5.3 (n = 4) | 49.3 ± 2.9 (n = 4) |
|
| |||
| t test | |||
| HAB vs LAB | P < 0.003 | NA | P < 0.0004 |
| MAB vs LAB | P < 0.04 | P < 0.84 | P < 0.002 |
| MAB vs HAB | P < 0.03 | NA | P < 0.01 |
NA = not applicable.
Data are expressed as mean ± SEM.
FIGURE 3.

Competition assays with 3H-PK11195 and unlabeled PBR111 in presence or absence of PBR28 (50 nM).
Detection of MABs in Platelets (Volunteers P1–P13)
Samples from 13 healthy volunteers were analyzed with PBR28. In 9 of 13 (69%), the ligand bound to a single class of high-affinity sites (Ki = 3.1 ± 0.57 nM); these volunteers were therefore classified as HABs. In 4 of 13 (31%), the data fitted best to a 2-site model, with affinities of 1.1 ± 0.40 and 1,266 ± 988 nM. These subjects were therefore classified as MABs. For the MABs, the mean fraction of high-affinity sites was 63% ± 9.8%. In this cohort, no LABs were detected.
Analysis of PET Data from Healthy Volunteers with 11C-PBR28
In 3 (of 35) 11C-PBR28 PET scans, the VT could not be calculated because the specific signal was too low. These subjects are likely to represent LABs. For the remaining subjects, the gaussian-mixture model indicated that the VT was best described by a single component (Fig. 4), although AIC values were similar for both 1- and 2-component fits: the AIC value was −61.939 for a single component versus −60.7238 for 2 components. The mean of the single component was 3.01 ± 1.03, and the means for the 2 components were 2.02 ± 0.46 and 3.78 ± 0.59. VT/fP was also best described by a single component, although again the AIC values were similar for both 1- and 2-component fits: the AIC value was 38.148 for a single component versus 41.1452 for 2 components. The mean of the single component was 74.5 ± 23.6, and the means for the 2 components were 58.8 ± 13.2 and 97.4 ± 14.7. The mixture model predicted that fP was best described by 2 components: the AIC value was −201.18 for a single component versus −204.239 for 2 components. There was no evidence that age and sex were responsible for the bimodal distribution of the fP data.
FIGURE 4.
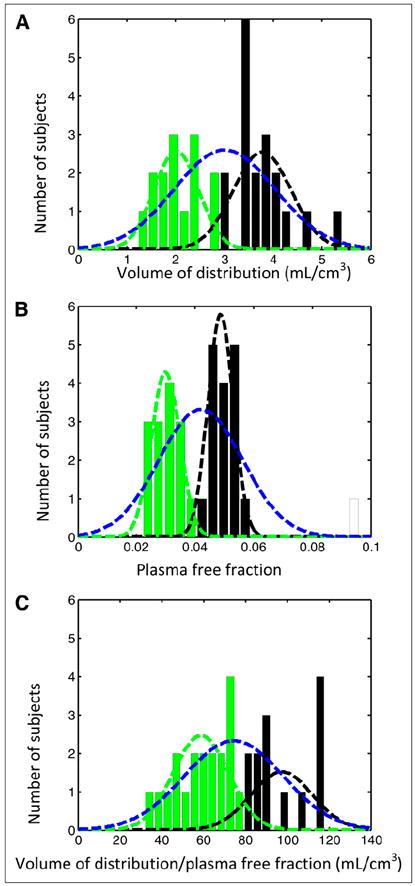
11C- PBR28 PET data from 32 healthy volunteers expressed as histogram with mixture model analysis showing 2 distributions for each measurement. (A) Volume of distribution. (B) Plasma free fraction. (C) Volume of distribution/plasma free fraction. Blue curves denote single-component solutions, and green and black curves denote 2-component solutions. For 2-component solutions, whereas different individuals are within each gaussian group (e.g., green) for 3 parameters, there was good agreement between A and B (74%) and A and C (66%).
DISCUSSION
We have recently shown, using brain tissue from donors with MS, that PBR28 binds to a single class of high-affinity sites in 1 group of patients (HABs), to a single class of low-affinity sites in another group of patients (LABs), and with 2 distinct affinities in a third group of patients (MABs) (6). These findings represent a challenge for quantitative 11C-PBR28 PET studies of TSPO binding because the existence of patients with varying affinity for PBR28 means that differences in PET signal across subjects cannot be interpreted directly as differences in receptor density.
Here, we show that these 3 binding groups exist with similar frequencies in brain tissue from donors with no history of neurologic disease (HAB, 45%; MAB, 35%; and LAB, 20%), as reported previously for donors having a history of MS (HAB, 48%; MAB, 32%; and LAB, 20%) (6). We also show that such differences in affinity between groups of patients are not restricted to PBR28. The TSPO ligands PBR06, PBR111, DPA713, and DAA1106 all show differing affinities consistent with the presence of HABs and LABs. Although differences in affinity are more pronounced with the phenoxyphenyl acetamides PBR28 and PBR06 (~50- and 20-fold, respectively), the differences are smaller with the phenylimidazopyridine PBR111 and its close relative, the phenylpyrazolopyrimidine DPA713 (both ~4-fold). Predictions of this affinity ratio from structural class alone (Fig. 5), however, are imperfect: DAA1106, another phenoxyphenyl acetamide like PBR28, binds with similar high affinity to PBR28 in HABs but exhibits a much smaller difference (~5-fold) between HABs and LABs. Because LABs have sufficient affinity with 18F-PBR06, 11C-DPA713, 18F-PBR111, and 11C-DAA1106 to produce a measurable signal in PET studies, their existence has gone undetected with these radioligands hitherto. However, their reduction in affinity with respect to HABs means that TSPO expression in these patients will have been underestimated substantially.
FIGURE 5.
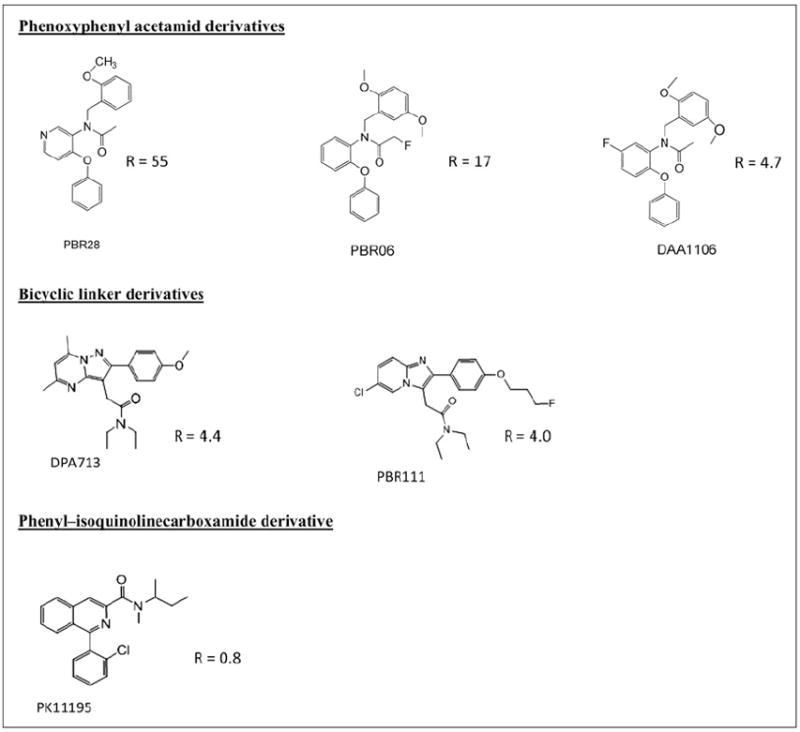
TSPO ligands displayed in structural classes.
The differing behavior of MABs with each ligand provides pharmacologic evidence that these subjects may coexpress the same binding sites responsible for HAB and LAB behavior. Two binding sites with distinguishable affinities were detected in MABs with both PBR28 and PBR06. With these ligands, the difference in affinity between the LAB site and HAB site is pronounced (>17-fold), and for each ligand the 2 affinities of the MABs were similar to those found with HABs and LABs. However, with PBR111, DAA1106, and DPA713, MABs appear to possess only 1 class of binding sites. With these ligands, the HAB and LAB sites are close in affinity (<5-fold), and for each ligand the affinity of the MABs was similar to the mean affinities of HABs and LABs. These data suggest that, for these 3 ligands, there may also be 2 classes of binding sites within tissue from MABs, whose affinities are too similar to resolve with this technique.
To test this hypothesis, PBR111 assays were repeated in the presence of PBR28 (50 nM), a concentration chosen to block most putative HAB sites while leaving most LAB sites unoccupied. The rationale was that the presence of the LAB site within MABs would be unmasked after blockade of the HAB site. Consistent with our model, the Ki of the LABs was unaffected, Ki of the HABs could not be measured because of the lack of signal, and Ki of the MABs increased to align with that of the LABs. Furthermore, the specific signal obtained with the MABs dropped by approximately 50%. These data suggest that although PBR111 appears to bind a single class of receptors in all subjects, there are 2 distinct TSPO binding sites in MABs, which are too similar in affinity to resolve. Therefore, MABs possess HAB and LAB sites in approximately equal proportions; we hypothesize that ligands with large differences in affinity between HABs and LABs will appear to bind 2 binding sites in MABs and ligands with small differences in affinity between HABs and LABs will appear to bind 1 class of binding sites in MABs, whose affinity is similar in magnitude to the mean of the HAB and LAB affinities.
Although our data suggest that most MABs express their 2 binding sites in approximately equal proportions, the fraction of high-affinity PBR28 binding sites within MABs ranges from 38% to 83%. Given the difficulties in detecting sites showing low expression, we cannot exclude the possibility that a continuum exists in expression of the HAB and LAB sites. For example, it might be the case that all subjects whom we have defined as HABs may express the LAB binding site (and vice versa) but do so at a level that is below the threshold of detection.
Having demonstrated that all the tested TSPO ligands can distinguish between HABs, MABs, and LABs, and that these groups exist in similar frequency in brain tissue from populations of donors with MS and with no history of neurologic disease, we went on to address whether the 3 binding groups can be detected in peripheral blood. The detection of these groups in peripheral blood covers an important issue for the future use of TSPO radioligands. If a peripheral blood assay can identify binding status, it would be possible to apply corrections to PET data allowing quantitative estimates of TSPO density between subjects in different binding groups. Alternatively, this approach could allow investigators to exclude subjects to ensure all participants within a study are from the same binding group. Using platelets isolated from healthy volunteers, we found that approximately 30% of the samples were classified as mixed-affinity binding, a proportion that is consistent with our data from neuropathologically normal brains. We did not detect any LABs in this cohort, but given that high-affinity and low-affinity binding has been shown in peripheral lymphocytes (5), finding no LABs is likely to be a confounder of limited power with our small sample. It remains to be demonstrated whether volunteers who are MABs with respect to their peripheral blood cells are also MABs with respect to their brain tissue, although again this has been demonstrated for PBR28 with HABs and LABs (5).
Finally, we investigated whether mixed-affinity binding occurs in vivo by analyzing the distribution of VT and VT/fP data from thirty-five 11C-PBR28 PET scans. Having excluded 3 subjects with negligible signal who were likely to be LABs, our hypothesis was that the remaining data would contain 2 populations, representing HABs and MABs. Assuming identical TSPO expression across all subjects and low nonspecific signal, the means of these 2 populations would be expected to differ by a factor of approximately 2. Although the mixture model preferred a single-component fit for both VT and VT/fP, the AIC values for a single-component and 2-component fit were similar. Given that TSPO expression will not be identical across subjects and that this will also affect VT and VT/fP, we concluded that there was evidence for HABs and MABs in vivo. Furthermore, when the data were fitted to 2 components, the means of these components differed by a factor of 1.9 for VT and 1.7 for VT/fP, consistent with the hypothesis that the components represent HABs and MABs. Further investigation will be required to definitely demonstrate the existence of mixed-affinity binding in the brain in vivo. The fP data were distributed bimodally—an unexpected finding because plasma is not thought to contain TSPO binding sites, and we found no evidence that the distribution was driven by age or sex. The reason for this bimodal distribution of fP is unclear.
The distribution volume for a radioligand is given by VT = VND (1 + BPND). Thus, by considering the affinity ratio (R = Kd-LAB/Kd-HAB), it is possible to calculate the ratio of the binding potential (BPND) between the 3 groups (HABs, MABs, and LABs) and consequently consider the impact on VT. Assuming a 50:50 split of the total Bmax in the MAB, then the BPNDs are given by:
where fND is the free fraction of radioligand in the nondisplaceable compartment, and Bmax is the receptor density.
When a ligand shows little selectively between HABs and LABs, as with 11C-PK11195, R will approach 1 and the expected binding potential will be the same for the 3 groups. For a highly selective ligand, such as 11C-PBR28, the influence of the LAB site diminishes and the binding potential approaches 0.5 × Bmax/Kd-HAB. Table 3 displays the R value for each of the ligands and predicts the ratio of specific signal that would be expected in HABs, MABs, and LABs with equal TSPO expression. The absolute BPND obtained will also depend on the fND, which will likely differ for each ligand.
TABLE 3.
Ratio of Specific Signal for HABs, MABs, and LABs with Different TSPO Ligands
| Ligand | LAB | MAB | HAB |
|---|---|---|---|
| PBR28 | 1 | 28.2 | 55.3 |
| PBR06 | 1 | 9.2 | 17.3 |
| DAA1106 | 1 | 2.9 | 4.7 |
| PBR111 | 1 | 2.5 | 4.0 |
| DPA173 | 1 | 2.7 | 4.4 |
| PK11195 | 1 | 0.9 | 0.8 |
MABs are assumed to express equal number of HAB and MAB sites. Receptor density is assumed to remain constant. Values are calculated as BPND relative to BPND of LABs.
CONCLUSION
We thus have shown that, apart from PK11195, all TSPO PET ligands in clinical use recognize high-affinity, low-affinity, and mixed-affinity binders in brain tissue in vitro. Although the same binding classes are evident from peripheral blood, it remains to be conclusively demonstrated that binding status in peripheral blood predicts that of the brain. Knowledge of binding status will be required to correctly quantify TSPO expression with PET.
Supplementary Material
Acknowledgments
We thank the U.K. Multiple Sclerosis Tissue Bank and Chris Rhodes for providing all human tissue used in this study. This work is supported by GlaxoSmithKline, Imperial College, the Wellcome Trust, and the Intramural Research Program of the National Institute of Mental Health (NIMH).
References
- 1.Banati RB, Newcombe J, Gunn RN, et al. The peripheral benzodiazepine binding site in the brain in multiple sclerosis: quantitative in vivo imaging of microglia as a measure of disease activity. Brain. 2000;123:2321–2337. doi: 10.1093/brain/123.11.2321. [DOI] [PubMed] [Google Scholar]
- 2.Yasuno F, Ota M, Kosaka J, et al. Increased binding of peripheral benzodiazepine receptor in Alzheimer’s disease measured by positron emission tomography with [11C]DAA1106. Biol Psychiatry. 2008;64:835–841. doi: 10.1016/j.biopsych.2008.04.021. [DOI] [PubMed] [Google Scholar]
- 3.Imaizumi M, Briard E, Zoghbi SS, et al. Brain and whole-body imaging in nonhuman primates of [11C]PBR28, a promising PET radioligand for peripheral benzodiazepine receptors. Neuroimage. 2008;39:1289–1298. doi: 10.1016/j.neuroimage.2007.09.063. [DOI] [PMC free article] [PubMed] [Google Scholar]
- 4.Fujita M, Imaizumi M, Zoghbi SS, et al. Kinetic analysis in healthy humans of a novel positron emission tomography radioligand to image the peripheral benzodiazepine receptor, a potential biomarker for inflammation. Neuroimage. 2008;40:43–52. doi: 10.1016/j.neuroimage.2007.11.011. [DOI] [PMC free article] [PubMed] [Google Scholar]
- 5.Kreisl WC, Fujita M, Fujimura Y, et al. Comparison of [11C]-(R)-PK 11195 and [11C]PBR28, two radioligands for translocator protein (18 kDa) in human and monkey: implications for positron emission tomographic imaging of this inflammation biomarker. Neuroimage. 2009;49:2924–2932. doi: 10.1016/j.neuroimage.2009.11.056. [DOI] [PMC free article] [PubMed] [Google Scholar]
- 6.Owen DR, Howell OW, Tang SP, et al. Two binding sites for [3H]PBR28 in human brain: implications for TSPO PET imaging of neuroinflammation. J Cereb Blood Flow Metab. 2010;30:1608–1618. doi: 10.1038/jcbfm.2010.63. [DOI] [PMC free article] [PubMed] [Google Scholar]
- 7.Fujimura Y, Zoghbi SS, Simeon FG, et al. Quantification of translocator protein (18 kDa) in the human brain with PET and a novel radioligand, 18F-PBR06. J Nucl Med. 2009;50:1047–1053. doi: 10.2967/jnumed.108.060186. [DOI] [PMC free article] [PubMed] [Google Scholar]
- 8.Endres CJ, Pomper MG, James M, et al. Initial evaluation of 11C-DPA-713, a novel TSPO PET ligand, in humans. J Nucl Med. 2009;50:1276–1282. doi: 10.2967/jnumed.109.062265. [DOI] [PMC free article] [PubMed] [Google Scholar]
- 9.Okubo T, Yoshikawa R, Chaki S, Okuyama S, Nakazato A. Design, synthesis and structure-affinity relationships of aryloxyanilide derivatives as novel peripheral benzodiazepine receptor ligands. Bioorg Med Chem. 2004;12:423–438. doi: 10.1016/j.bmc.2003.10.050. [DOI] [PubMed] [Google Scholar]
- 10.Selleri S, Gratteri P, Costagli C, et al. Insight into 2-phenylpyrazolo[1,5-a]pyrimidin-3-yl acetamides as peripheral benzodiazepine receptor ligands: synthesis, biological evaluation and 3D-QSAR investigation. Bioorg Med Chem. 2005;13:4821–4834. doi: 10.1016/j.bmc.2005.05.015. [DOI] [PubMed] [Google Scholar]
- 11.Cheng Y, Prusoff WH. Relationship between the inhibition constant (K1) and the concentration of inhibitor which causes 50 per cent inhibition (I50) of an enzymatic reaction. Biochem Pharmacol. 1973;22:3099–3108. doi: 10.1016/0006-2952(73)90196-2. [DOI] [PubMed] [Google Scholar]
- 12.Logan J, Fowler JS, Volkow ND, et al. Graphical analysis of reversible radioligand binding from time-activity measurements applied to [N-11C-methyl]-(–)-cocaine PET studies in human subjects. J Cereb Blood Flow Metab. 1990;10:740–747. doi: 10.1038/jcbfm.1990.127. [DOI] [PubMed] [Google Scholar]
- 13.Tzourio-Mazoyer N, Landeau B, Papathanassiou D, et al. Automated anatomical labeling of activations in SPM using a macroscopic anatomical parcellation of the MNI MRI single-subject brain. Neuroimage. 2002;15:273–289. doi: 10.1006/nimg.2001.0978. [DOI] [PubMed] [Google Scholar]
Associated Data
This section collects any data citations, data availability statements, or supplementary materials included in this article.