Abstract
Single-shot EPI is the most common acquisition technique for whole-brain diffusion tensor imaging (DTI) studies in vivo. Higher field MRI systems are readily available and advantageous for acquiring DTI due to increased signal. One of the practical issues for DTI with single-shot EPI at high field is incomplete fat suppression resulting in a chemically-shifted fat artifact within the brain image. Unsuppressed fat is especially detrimental in DTI because the diffusion coefficient of fat is two orders of magnitude lower than that of parenchyma, producing brighter appearing fat artifacts with greater diffusion weighting. In this work, several fat suppression techniques were tested alone and in combination with the goal of finding a method that provides robust fat suppression and can be utilized in high-resolution single-shot EPI DTI studies. Combination of chemical shift saturation with slice-select gradient reversal within a dual-spin-echo diffusion preparation period was found to provide robust fat suppression at 3T.
Introduction
As technical advances allow clinical application in MRI to move towards higher field strengths, the increased signal-to-noise ratio (SNR) can be exploited to improve the resolution of in vivo imaging. This is especially attractive for diffusion-weighted and diffusion tensor imaging (DTI), as higher-resolution provides a finer sampling of tissue from which to extract diffusion properties. Typically, DTI data are acquired with a diffusion-weighted single-shot echo-planar imaging sequence (SSEPI) due to its time efficiency and insensitivity to motion induced phase errors. Good quality SSEPI images of human brain can readily be acquired at 2 × 2 mm in-plane resolution or higher by using parallel imaging techniques, such as SENSE and GRAPPA.
In SSEPI used for DTI analysis, it is advisable to aim at isotropic voxels rather than increasing disproportionately in plane resolution to achieve higher resolution. The intravoxel orientational coherence of white matter fibers is an important determinant of measured anisotropy (1) and apparent fiber orientation, so acquiring images with isotropic voxel dimensions insures a balanced weighting of architectural features of white matter in all directions (2). Therefore, the minimum achievable slice thickness may constrain the isotropic voxel dimensions that can be achieved for high resolution DTI. In addition, signal from fat must be fully suppressed in SSEPI DTI as it produces a chemically shifted image that overlaps the tissue of interest and the diffusion coefficient for fat is very low, ~1×10⁻⁵ mm2/s (3), therefore biasing the diffusion properties of the underlying tissue.
Several fat suppression methods have been utilized in SSEPI DTI. These methods include chemical shift selective pulse and saturation (CS) (4) and spectral inversion-recovery (SPIR) (5). These methods require a preparation period with a chemical shift selective radio-frequency (RF) pulse centered on the precessional frequency of fat with a narrow bandwidth, leaving the water signal unaffected. CS and SPIR are sensitive to both B0 and B1 field inhomogeneities (6). Effects of B0 field inhomogeneity are more severe at higher field strengths, near air/tissue interfaces, and at the edge of the head where fat is located. Therefore, the frequency of fat can be shifted outside the effective bandwidth of the RF pulse used to excite or invert the fat signal. In addition, it is known that B1 is inhomogeneous at higher field strengths due to dielectric effects (7). Accordingly, in practice, fat suppression by these techniques is commonly incomplete.
Spatial-spectral excitation (SPSP) (8,9) has been employed in SSEPI acquisitions (10), as a method to excite water within a slice without affecting fat. This method is more robust in suppressing fat at 3T because the degree of suppression is not affected by B1 inhomogeneities. However, SPSP is often limited in the minimum slice thickness that can be achieved due to gradient slew-rate and amplitude constraints. The minimum slice thickness achievable in the product diffusion sequence of clinical scanners that currently use SPSP is about 2.4 mm.
Recently, techniques exploiting the difference in fat and water frequencies on slice selection have been proposed for fat suppression. Due to the difference in frequency, the fat slice is displaced from the water slice by
| [1] |
where D is displacement in mm, Δ is the relative chemical shift in ppm, B0 is the main field strength in Tesla, G is the slice-select gradient amplitude in mT/m (11), and Δωfat is the shift in frequency of fat compared to water. The ratio between fat displacement and slice thickness is given by
| [2] |
where ΔS is slice thickness and BW is the RF pulse bandwidth. In the case where two RF pulses are applied, a difference in BWresults in different displacement for the affected fat slice. In addition, slice select gradients of opposite polarity will produce displacement of the fat slice in opposite directions (Eq. 1). To exploit these phenomena for fat suppression, the affected fat slices from different RF pulses should not overlap. Therefore, the general expression to be satisfied for fat suppression is given by
| [3] |
where BW1 and BW2 are the bandwidths of the first and second RF pulses, and j = −1 if corresponding slice select gradients are of the same polarity and j = 1 for opposite polarity.
The slice-selection gradient reversal (SSGR) method (11,12) utilizes opposite polarity slice select gradients with equal bandwidths. This method has been proposed as an alternative fat suppression technique in a dual-spin-echo diffusion preparation period (13). A more recently proposed fat suppression technique utilizes different RF pulse durations, and hence different bandwidths, for excitation and refocusing with same polarity slice select gradients (14). This technique is well suited for higher field strengths, e.g. 7T, because the frequencies of fat and water are further separated and it is low in specific absorption rate (SAR). The strategy of different bandwidths alone is not ideal at 3T as the pulse durations needed for complete fat suppression would require a substantial increase in TE.
Accordingly, in this work we have focused on SSGR. However, many commercial sequences employ slightly different bandwidths for excitation and refocusing, adding a small contribution to fat suppression. For SSGR with slightly different BW90 and BW180 investigated in this work, complete fat suppression is achieved when the ratio between displacement and slice thickness for the 180° RF pulses, derived from equation 3, is
| [4] |
It follows that if the precessional frequency of fat is shifted towards lower frequencies, due to field inhomogeneity, the SSGR method will be even more effective. Although SSGR is a promising method for fat suppression at high field, in practice, imperfections in the slice profile can degrade its performance.
In this work, the effectiveness of multiple standalone fat suppression techniques (CS, SPSP, and SSGR) and SSGR combined with CS (SSGR-CS) were evaluated with phantom and human data. The goal of the investigation was to determine the most complete and robust method of fat suppression that would allow the acquisition of high-resolution SSEPI DTI data with minimum fat artifacts.
Methods
Data Acquisition
All data were collected on a 3T HD× MRI system (GE Healthcare, Milwaukee, WI) with gradients capable of 40 mT/m. An SSEPI DTI sequence with a dual-spin-echo diffusion preparation period was adapted for SSGR by implementing opposite polarity slice-select gradients for the two 180° RF pulses, i.e. {+ + −} polarity for the 90°, 180°, 180° RF pulses. The crusher gradients surrounding each 180° RF pulse were bridged to the slice-select gradients with the same polarity. The frequency of the second 180° RF pulse was adjusted to correspond with the negative polarity slice-select gradient such that off-center slices would be properly refocused. Informed consent was obtained for all subjects with a research protocol approved by the Institutional Review Board.
Phantom data were acquired with CS, SPSP, SSGR, SSGR-CS, and without fat suppression of a 7 cm diameter sphere filled with 50% polyvinylpyrrolidone (PVP) (15) immersed in a container of vegetable oil, along side a 15 cm diameter sphere filled with distilled water, using an 8-channel phased array coil. The sphere filled with distilled water allowed for the center frequency of water to be readily determined and for the PVP sphere in oil to be positioned towards the edge of the coil, corresponding to the normal fat location for in vivo imaging. The diffusion datasets, consisting of 3 non-diffusion-weighted images and 17 diffusion directions with a b-value=1100 s/mm2, were acquired with the following scan parameters: TE/TR=85 ms/5.9 s, slice thickness=2.5 mm, matrix=96×96, FOV=24 cm, acceleration factor=2, BW90 = 708 Hz and BW180 = 905 Hz. Incorporating the default BW90, the ratio that needs to be satisfied from Eq. 4 is for on-resonance fat with Δωfat = 427.9Hz. Using the default BW180, the ratio . SSGR data were also acquired with the following additional BW180/TE combinations and resulting ratios: 724 Hz/86.4 ms, 579 Hz/88.5 ms, and 482 Hz/90.5 ms with ratio , 0.739, and 0.888, respectively. Note all BW180 satisfy the condition from Eq. 4.
Data were acquired on healthy subjects using a receive-only 16-channel phased array coil (NOVA Medical Inc., Wakefield, MA). The same scan parameters were used as the phantom acquisition, except TR=18.5 s to accommodate 60 slices. For comparison with the phantom data, one subject underwent scanning with all sequence variations. Additionally, data were acquired with CS and SSGR-CS on 5 healthy subjects. The data sets contained 6 non-diffusion-weighted images and 54 diffusion directions with maximum b-value=1100 s/mm2. One of the five additional subjects had data acquired with phase encoding in right/left, to verify change in the chemically-shifted image. BW180 was automatically calculated by the scanner software based on patient weight to minimize power deposition. For the 5 additional subjects scanned, the BW180 varied from 905 to 579 Hz, resulting in to 0.739, all of which satisfy the condition from Eq. 4.
The SSGR-CS sequence was also used to acquire data of a healthy volunteer at 1.7mm isotropic voxel size. The data set also contained 6 non-diffusion-weighted images and 54 diffusion directions with maximum b-value=1100s/mm2 with the following scan parameters: TE/TR=91 ms/21 s, slice=1.7 mm, 128×128, FOV=22 cm, acceleration factor=2, and BW180 = 872 Hz.
Diffusion Tensor Image Processing
The diffusion data was processed using the TORTOISE software package available to download at www.tortoisedti.org (16). For in vivo data the preprocessing steps include 1) rigid body motion correction, 2) eddy-current distortion correction, 3) B0 distortion correction, and 4) bicubic upsampling to 1.5 mm isotropic resolution. For all diffusion data sets, the diffusion tensor (17) was computed by non-linear least squares fitting. The orientationally-averaged mean diffusivity, <D> (17), which is equal to 1/3 of the Trace of the diffusion tensor, and the fractional anisotropy (FA) (18) were calculated on a voxel-by-voxel basis. Conventional directionally encoded color (DEC) maps were also derived from the DTI data (19).
Quantitative Analysis
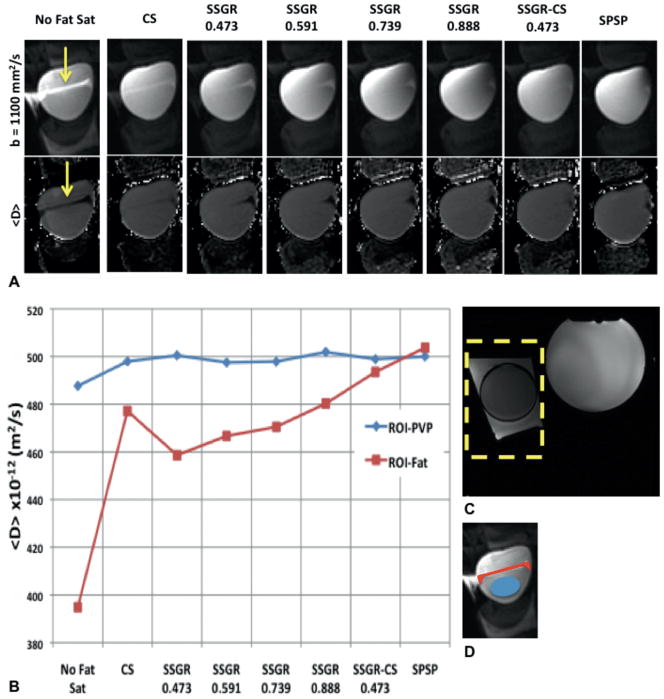
If residual fat is present in diffusion-weighted data, the <D> will be decreased proportionally. Accordingly, <D> was analyzed to determine the effectiveness of fat suppression. For phantom data, <D> was measured for each acquisition in a PVP region-of-interest (ROI-PVP) placed in the lower half of the ball, avoiding the fat artifact, and a region-of-interest (ROI-Fat) encompassing the well defined fat artifact in the “No Fat Sat” data (see Fig. 1D). Similarly, for in vivo data acquired with all sequence variations, <D> was measured for each acquisition within a ROI-Fat that was created from the data acquired without fat suppression. A diffusion-weighted volume, containing all slices, from the “No Fat Sat” data set was masked to remove non-brain voxels with a threshold at 35% maximum signal intensity, and manually masked to remove spurious voxels outside of the fat artifact. The average <D> for the whole brain was also measured, excluding all CSF contaminated voxels with <D> above 1000×10−12 m2/s.
FIG. 1.
A: Cropped region of representative images from b-values=1100 (top row) and <D> maps (bottom row). The SSGR labels are the ratio values, while the yellow arrows indicate residual fat signal. B: Mean values from the ROI encompassing the fat (ROI-Fat) and the ROI encompassing PVP (ROI-PVP). C: Reference image with an outline of the cropped region shown in A. D: Illustration showing the placement of ROI-Fat and ROI-PVP used to calculate the values graphed in B.
<D> was also measured for the in vivo data acquired on 5 subjects in both ROI-Fat and the whole brain. In this case, ROI-Fat was created by subtracting a diffusion-weighted SSGR-CS volume from the corresponding CS volume. The subtracted volume was masked to remove non-brain voxels with a threshold at 35% of the maximum residual fat signal, and manually masked to remove spurious voxels outside the fat artifact. Normalized difference images were also calculated from the <D> maps as (CS – SSGR-CS)/CS) to highlight the residual fat signal in CS.
Results
Figure 1A shows diffusion-weighted images (DWIs), and calculated <D> maps from the phantom data collected with various fat suppression methods. The effect of the fat signal can be clearly seen in the “No Fat Sat” data. In the calculated maps of this homogeneous phantom, the artifact due to unsuppressed fat signal generally manifests as decreased <D> within the PVP sample. The decrease in <D> is expected as fat has a lower <D> than the PVP sample. Using the CS fat suppression method, the effect of residual fat signal can be seen in the <D> map. In the images acquired with SSGR, the fat signal that was residual with the CS method has been significantly removed, however, a different region of residual fat is present. As the ratio increases, the amount of residual fat decreases. Using combined SSGR-CS most chemically shifted fat signals have been removed, similar to data acquired with the SPSP excitation pulse. Fig. 1B shows a plot of measured values from the ROIs. The <D> measured from ROI-PVP is similar for all acquisitions. In the ROI-fat, there is a reduction in <D> for the acquisitions that contain residual fat. Both SSGR-CS and SPSP have <D> values in ROI-Fat that are most similar to <D> in ROI-PVP, indicating good fat suppression.
Figure 2 shows the equivalent analysis for the in vivo data. In Fig. 2A, the residual fat can be seen as increased signal in the diffusion-weighted images and a decrease in the <D> maps. From the ROI analysis of all slices, shown in Fig. 2B, it can be seen that CS and SSGR had the most residual fat, resulting in the greatest decrease in <D> compared to brain tissue. In SSGR, as the ratio increases the fat suppression improves and seems to fully suppress fat at a ratio of 0.888. SSGR-CS and SPSP also have <D> values in ROI-Fat that are similar to the average <D> of the brain tissue.
FIG. 2.
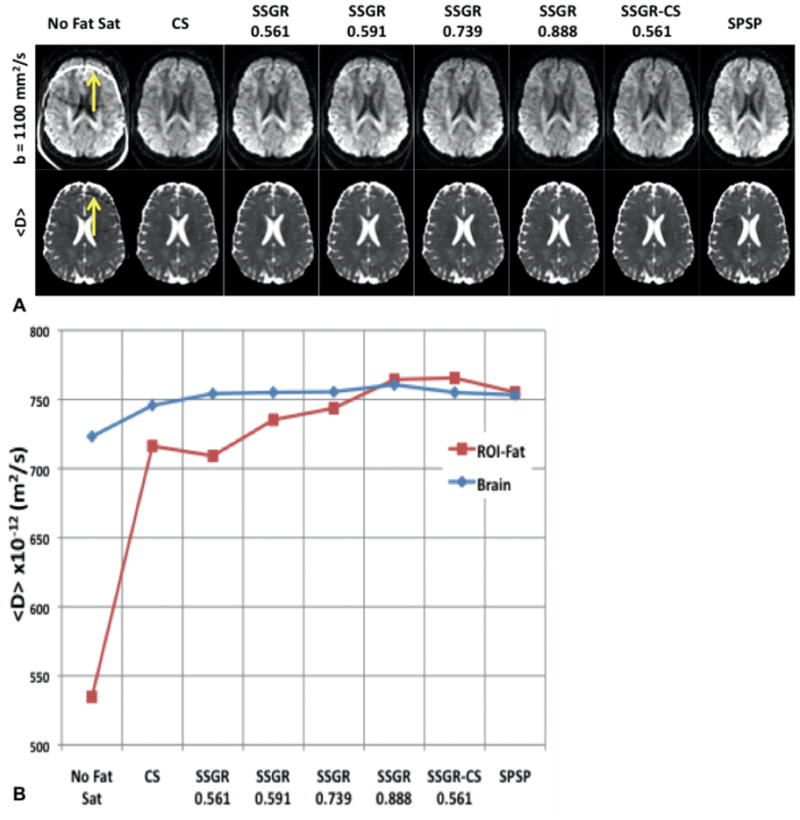
A: Representative slice from the b-value=1100 images (top row) and the <D> maps (bottom row). The SSGR labels are the ratio values, while the yellow arrows indicate residual fat signal. B: Plot of the mean values from the whole brain ROI-fat and the average over all brain tissue.
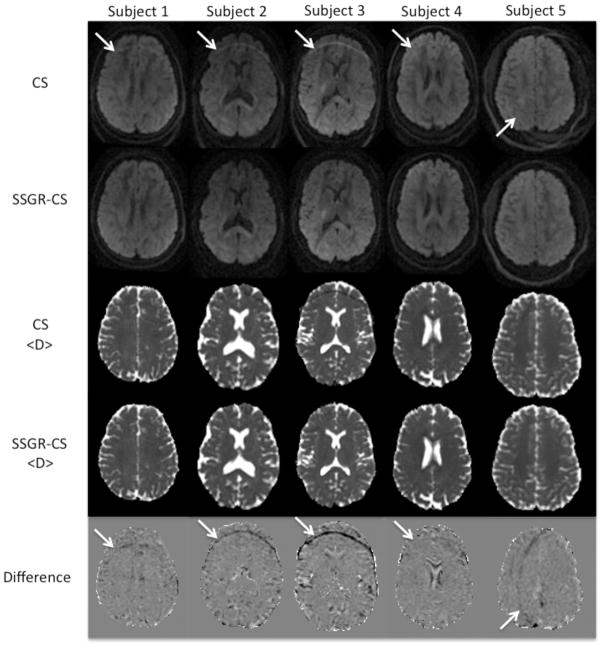
In Fig. 3, DWIs, <D> maps, and normalized difference images are shown for the five healthy volunteers acquired with both CS and SSGR-CS. With CS, unsuppressed fat can be clearly seen as a bright ring running through the frontal lobes in the first four subjects and through the left hemisphere in Subject 5. In Subject 5 the shift in the artifact was due to the change in phase encoding direction, consistent with the expected behavior of fat signal. The fat signal produces a decrease in <D> for the CS data. Although not always prominent in the <D> map, the normalized difference image between <D> of CS and SSGR-CS more clearly reveals the artifact. Table 1 summarizes the measured ROI-Fat results. The average in <D> for ROI-Fat of the CS data varies between subjects and is significantly reduced compared to the average <D> for the brain (p = 0.035, paired t-test). In contrast, the average <D> in ROI-Fat for the SSGR-CS data is similar to the average <D> for the brain in all subjects (p = 0.89, paired t-test). This shows that SSGR-CS provides superior fat suppression compared to CS. Additionally, although weight varies between subjects, its value is not correlated to <D> in ROI-Fat of the CS data (r = 0.12).
FIG.3.
Diffusion-weighted images with b-value =1100 s/mm2, <D> maps, and normalized difference images from 5 volunteers collected with CS and SSGR-CS. The data acquired on the fifth subject has phase encoding in R/L. White arrows indicate the residual fat artifact.
Table 1.
Summary of the whole brain analysis of the 5 subjects. All <D> ×10−12 m2/s.
| Subject # | Weight (Kg) | Voxels In ROI | ROI-Fat <D> CS | ROI-Fat <D> SSGR-CS | Brain <D> CS | Brain <D> SSGR-CS | Normalized difference | ||
|---|---|---|---|---|---|---|---|---|---|
| 1 | 114 | 0.738 | 1694 | 722.31 | 759.27 | 760.23 | 762.22 | −6% | |
| 2 | 89 | 0.586 | 1707 | 615.81 | 725.953 | 741.62 | 748.85 | −15% | |
| 3 | 92 | 0.594 | 3787 | 615.67 | 759.79 | 758.39 | 769.73 | −25% | |
| 4 | 82 | 0.535 | 1042 | 697.63 | 740.4 | 717.21 | 720.61 | −6% | |
| 5 | 68 | 0.473 | 651 | 695.46 | 767.59 | 752.57 | 756.78 | −11% | |
| Mean ± st dev | 88.9 ± 16.8 | 0.585± 0.098 | 1776 ± 1210 | 669.3 ± 50.1 | 750.6 ± 17.0 | 746.0 ± 17.6 | 751.6 ± 18.9 | 12.6 ± 7.9 |
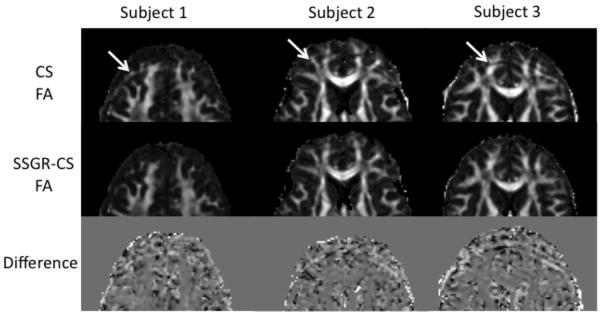
Figure 4 shows representative FA maps and normalized difference images of subject #1, 2, and 3, corresponding to data in Fig.3, cropped to the region containing the fat artifact. The fat artifact can be seen in the CS FA maps. The fat artifact causes a substantial increase in FA, for those voxels with low FA. Conversely, in the areas of white matter with underlying high FA, the fat artifact causes a decrease in the calculated FA. A closer look at images from the individual diffusion directions reveals that the fat artifact is not homogeneous in intensity, and varies slightly in location along the phase-encoding direction depending on the applied diffusion direction. Both inhomogeneous artifact intensity and unstable location will vary the intensity in an affected voxel between diffusion directions, producing an overestimation of FA for voxels with underlying low FA. Two contributing factors may lead to an underestimation of FA for voxels with underlying high FA: 1) the signal from fat is isotropic, 2) the inconsistent intensity of the fat signal obscures the systematic change in signal intensity for highly anisotropic tissue with diffusion direction. This opposing effect is more clearly seen in the normalized difference images. The brightest voxels in the fat artifact of the third column are about a 60% overestimation, while the darkest voxels are about a 50% underestimation in FA.
FIG. 4.
FA maps and normalized difference images corresponding to the data shown Fig. 3 for subject #1, 2, and 3. Images have been cropped to the area containing the fat artifacts, indicated by white arrows.
Figure 5 shows representative slices from all levels of the brain for data acquired with 1.7 mm isotropic resolution using the SSGR-CS method. These images demonstrate that high-resolution whole-brain DTI data can be acquired without fat artifacts using the SSGR-CS method. Due to the high resolution, several fine architectural features can be distinguished and have reduced partial volume effects compared to typical 2.5 mm isotropic resolution images. For example, the optic tracts (white arrow) and additional sub-cortical white matter (yellow arrows) are discernable and have diffusion properties closer to that of uncontaminated white matter.
FIG. 5.
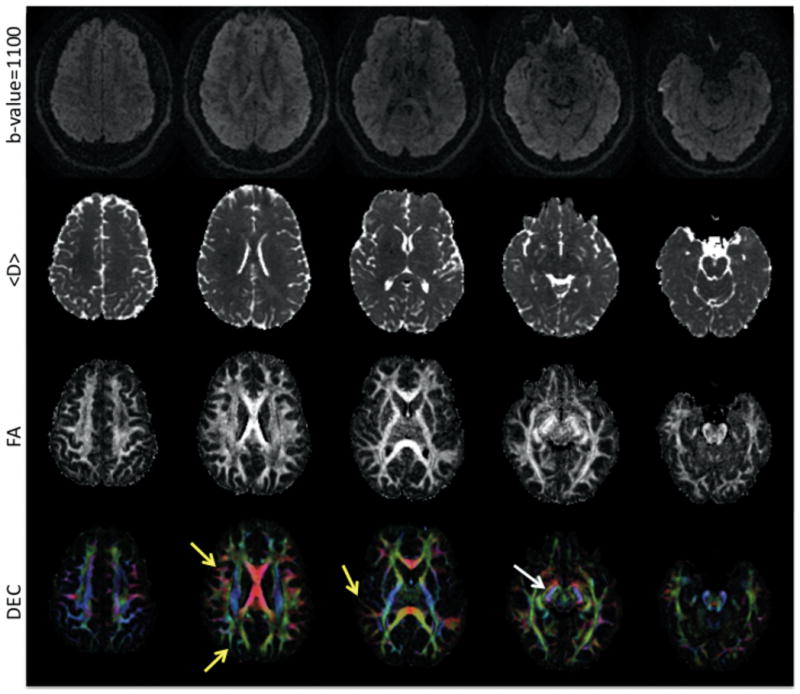
Five slices from a whole brain SSEPI DTI acquisition at 1.7mm isotropic voxel size. Diffusion-weighted images (top row), calculated <D> maps (second row), calculated FA (third row), and DEC maps (bottom row) are displayed. The yellow arrows point to sub-cortical white matter, while the white arrow points to the optic tract on the left side.
Discussion
The combination of SSGR and traditional CS, SSGR-CS, is shown to be a robust method of fat suppression. Although additional time is required to accommodate the CS preparation period it does not increase the overall scan time for DTI acquisitions, as the main factor limiting scanning speed is the duty cycle of the gradients. In fact, overall scan time is slightly reduced using SSGR-CS compared to SPSP, as SPSP excitation requires multiple high amplitude slice-select gradient pulses.
The SSGR method showed improved fat suppression, as the ratio was increased, resulting in complete suppression at , with BW180 = 482 Hz, in the in vivo data. However, TE increases with the ratio, and BW180 decreases; a greater than 5 ms increase in TE for BW = 482 Hz compared to the default 905 Hz for CS and SSGR-CS. In addition, an undesired effect of SSGR methods is the suppression of off-resonance water signal. Areas of greatest susceptibility, and thus off-resonance, are typically near air/tissue interfaces such as the paranasal sinuses and the mastoid air cells next to the inferior aspects of the frontal and temporal lobes, respectively. This undesirable effect is magnified as the BW180 decreases (see Fig. 1A). For the BW180 used in SSGR-CS, the degree of off-resonance water signal suppression is similar to that of SPSP. Therefore, the SSGR-CS method is recommended due to its robust suppression of fat, minimum TE, and minimum suppression of off-resonance water.
Unsuppressed fat signal corrupts the diffusion properties of the underlying tissue of interest. The fat artifacts will typically result in an underestimation of <D> and in either an overestimation or an underestimation of FA, depending on the consistency of the artifact in different DWIs and the degree of anisotropy of the tissue. Both overestimating and underestimating FA are problematic for further data analysis and/or processing of the diffusion MRI data. This is especially true for fiber tracking: an underestimation of FA may result in premature termination of tracts, as low anisotropy is commonly used as a stopping criterion, while an overestimation of FA may create spurious tracts that do not correspond to an anatomical structure. For <D>, it is important to note that the effect of the fat artifact, with a high signal intensity in DWIs and low <D>, is analogous to that of acute ischemia (20).
The dual-spin-echo preparation is most desirable to use for diffusion imaging, as it is known to reduce eddy-current effects (21). Accordingly, the SSGR method was employed in a dual-spin-echo diffusion preparation. However, the SSGR method has been proposed in conjunction with a spin-echo type of diffusion preparation, where the polarity of the slice-select gradient for the 90° RF excitation pulse has opposite polarity as the slice-select gradient for the 180° RF refocusing pulse (12,22).
Although not presented in this work, it seems probable that the SSGR-CS method may also be effective in robustly suppressing fat in diffusion-weighted imaging in the body.
Conclusion
By combining the traditional CS fat suppression method with the SSGR fat suppression method during a dual-spin-echo diffusion preparation period, higher resolution SSEPI images with isotropic voxel dimensions can be acquired with minimum fat artifacts. By combining the two methods both on and off-resonance fat signal is suppressed. Utilizing such a sequence allows the greater signal available at higher fields to be exploited for increasing the resolution of SSEPI acquisitions.
Acknowledgments
The authors would like to thank Dr. Stefano Marenco for motivating this work and Dr. Dan Handwerker for collaboration on in vivo data collection. Support for this work included funding from Department of Defense in the Center for Neuroscience and Regenerative Medicine. This research was supported in part by the Intramural Research Program of the NICHD, NINDS, and NIMH.
References
- 1.Pierpaoli C, Jezzard P, Basser PJ, Barnett A, Di Chiro G. Diffusion tensor MR imaging of the human brain. Radiology. 1996;201(3):637–648. doi: 10.1148/radiology.201.3.8939209. [DOI] [PubMed] [Google Scholar]
- 2.Pierpaoli C. Artifacts in Diffusion MRI. In: Jones DK, editor. Diffusion MRI: Theory, Methods, and Applications. New York: Oxford University Press, Inc; 2011. [Google Scholar]
- 3.Lehnert A, Machann J, Helms G, Claussen CD, Schick F. Diffusion characteristics of large molecules assessed by proton MRS on a whole-body MR system. Magnetic Resonance Imaging. 2004;22(1):39–46. doi: 10.1016/j.mri.2003.05.007. [DOI] [PubMed] [Google Scholar]
- 4.Haase A, Frahm J, Hanicke W, Matthaei D. <sup>1</sup>H NMR chemical shift selective (CHESS) imaging. Physics in Medicine and Biology. 1985;30(4):341–344. doi: 10.1088/0031-9155/30/4/008. [DOI] [PubMed] [Google Scholar]
- 5.Kaldoudi E, Williams SCR, Barker GJ, Tofts PS. A chemical shift selective inversion recovery sequence for fat-suppressed MRI: Theory and experimental validation. Magnetic Resonance Imaging. 1993;11(3):341–355. doi: 10.1016/0730-725x(93)90067-n. [DOI] [PubMed] [Google Scholar]
- 6.Bley TA, Wieben O, Fran√βois CJ, Brittain JH, Reeder SB. Fat and water magnetic resonance imaging. Journal of Magnetic Resonance Imaging. 2010;31(1):4–18. doi: 10.1002/jmri.21895. [DOI] [PubMed] [Google Scholar]
- 7.Yang QX, Wang J, Zhang X, Collins CM, Smith MB, Liu H, Zhu XH, Vaughan JT, Ugurbil K, Chen W. Analysis of wave behavior in lossy dielectric samples at high field. Magnetic Resonance in Medicine. 2002;47(5):982–989. doi: 10.1002/mrm.10137. [DOI] [PubMed] [Google Scholar]
- 8.Meyer CH, Pauly JM, Macovski A, Nishimura DG. Simultaneous spatial and spectral selective excitation. Magnetic Resonance in Medicine. 1990;15(2):287–304. doi: 10.1002/mrm.1910150211. [DOI] [PubMed] [Google Scholar]
- 9.Zur Y. Design of improved spectral-spatial pulses for routine clinical use. Magnetic Resonance in Medicine. 2000;43(3):410–420. doi: 10.1002/(sici)1522-2594(200003)43:3<410::aid-mrm13>3.0.co;2-3. [DOI] [PubMed] [Google Scholar]
- 10.Schick F, Forster J, Machann J, Kuntz R, Claussen CD. Improved clinical echo-planar MRI using spatial-spectral excitation. Journal of Magnetic Resonance Imaging. 1998;8(4):960–967. doi: 10.1002/jmri.1880080427. [DOI] [PubMed] [Google Scholar]
- 11.Gomori JM, Holland GA, Grossman RI, Gefter WB, Lenkinski RE. Fat suppression by section-select gradient reversal on spin-echo MR imaging. Work in progress Radiology. 1988;168(2):493–495. doi: 10.1148/radiology.168.2.3393670. [DOI] [PubMed] [Google Scholar]
- 12.Volk A, Tiffon B, Mispelter J, Lhoste JM. Chemical shift-specific slice selection. A new method for chemical shift imaging at high magnetic field. Journal of Magnetic Resonance (1969) 1987;71(1):168–174. [Google Scholar]
- 13.Nagy Z, Weiskopf N. Efficient fat suppression by slice-selection gradient reversal in twice-refocused diffusion encoding. Magnetic Resonance in Medicine. 2008;60(5):1256–1260. doi: 10.1002/mrm.21746. [DOI] [PMC free article] [PubMed] [Google Scholar]
- 14.Ivanov D, Schafer A, Streicher MN, Heidemann RM, Trampel R, Turner R. A Simple Low-SAR Technique for Chemical-Shift Selection with High-Field Spin-Echo Imaging. Magnetic Resonance in Medicine. 2010;64(2):319–326. doi: 10.1002/mrm.22518. [DOI] [PubMed] [Google Scholar]
- 15.Pierpaoli C, Sarlls JE, Nevo U, Basser PJ, Horkay F. Polyvinylpyrrolidone (PVP) Water Solutions as Isotropic Phantoms for Diffusion MRI Studies. Honolulu: 2009. p. 1414. [Google Scholar]
- 16.Pierpaoli C, Walker L, Irfanoglu MO, Barnett A, Basser P, Chang LC, Koay CG, Pajevic S, Rohde G, Sarlls J, Wu M. TORTOISE: an integrated software package for processing of diffusion MRI data. Stockholm: 2010. p. 1597. [Google Scholar]
- 17.Basser PJ, Mattiello J, LeBihan D. Estimation of the Effective Self-Diffusion Tensor from the Nmr Spin-Echo. Journal of Magnetic Resonance Series B. 1994;103(3):247–254. doi: 10.1006/jmrb.1994.1037. [DOI] [PubMed] [Google Scholar]
- 18.Basser PJ, Pierpaoli C. Microstructural and physiological features of tissues elucidated by quantitative-diffusion-tensor MRI. Journal of Magnetic Resonance Series B. 1996;111(3):209–219. doi: 10.1006/jmrb.1996.0086. [DOI] [PubMed] [Google Scholar]
- 19.Pajevic S, Pierpaoli C. Color schemes to represent the orientation of anisotropic tissues from diffusion tensor data: Application to white matter fiber tract mapping in the human brain. Magnetic Resonance in Medicine. 1999;42(3):526–540. [PubMed] [Google Scholar]
- 20.Warach S, Gaa J, Siewert B, Wielopolski P, Edelman RR. Acute Human Stroke Studied by Whole-Brain Echo-Planar Diffusion-Weighted Magnetic-Resonance-Imaging. Annals of Neurology. 1995;37(2):231–241. doi: 10.1002/ana.410370214. [DOI] [PubMed] [Google Scholar]
- 21.Reese TG, Heid O, Weisskoff RM, Wedeen VJ. Reduction of eddy-current-induced distortion in diffusion MRI using a twice-refocused spin echo. Magnetic Resonance in Medicine. 2003;49(1):177–182. doi: 10.1002/mrm.10308. [DOI] [PubMed] [Google Scholar]
- 22.Butts K, de Crespigny A, Pauly JM, Moseley M. Diffusion-weighted interleaved echo-planar imaging with a pair of orthogonal navigator echoes. Magnetic Resonance in Medicine. 1996;35(5):763–770. doi: 10.1002/mrm.1910350518. [DOI] [PubMed] [Google Scholar]


