

Abstract
In the intestine, changes of sugar concentration generated in the lumen during digestion induce adaptive responses of glucose transporters in the epithelium. A close matching between the intestinal expression of glucose transporters and the composition and amount of the diet has been provided by several experiments. Functional evidence has demonstrated that the regulation of glucose transporters into enterocytes is induced by the sensing of sugar of the enteroendocrine cells through activation of sweet taste receptors (T1R2 and T1R3) and their associated elements of G-protein-linked signaling pathways (e.g. α-gustducin, phospholipase C β type 2 and transient receptor potential channel M5), which are signaling molecules also involved in the perception of sweet substances in the taste receptor cells (TRCs) of the tongue. Considering this phenotypical similarity between the intestinal cells and TRCs, we evaluated whether the TRCs themselves possess proteins of the glucose transport mechanism. Therefore, we investigated the expression of the typical intestinal glucose transporters (i.e. GLUT2, GLUT5 and SGLT1) in rat circumvallate papillae, using immunohistochemistry, double-labeling immunofluorescence, immunoelectron microscopy and reverse transcriptase-polymerase chain reaction analysis. The results showed that GLUT2, GLUT5 and SGLT1 are expressed in TRCs; their immunoreactivity was also observed in cells that displayed staining for α-gustducin and T1R3 receptor. The immunoelectron microscopic results confirmed that GLUT2, GLUT5 and SGLT1 were predominantly expressed in cells with ultrastructural characteristics of chemoreceptor cells. The presence of glucose transporters in TRCs adds a further link between chemosensory information and cellular responses to sweet stimuli that may have important roles in glucose homeostasis, contributing to a better understanding of the pathways implicated in glucose metabolism.
Keywords: circumvallate papilla, glucose transporter, immunohistochemistry, taste, ultrastructure
Introduction
Glucose and fructose are the principal energy substrates absorbed by epithelial cells lining the intestinal lumen; they are transported to the bloodstream by membrane-associated carrier proteins, the glucose transporters (Wright et al. 2003; Thorens & Mueckler, 2010). The classic intestinal glucose transport pathway occurs primarily through the serial work of two transporter proteins: SGLT1 and GLUT2. SGLT1 is a member of the Na+-dependent glucose transporter (SGLT) family, which cotransports, from the lumen to the interior of the cell, the sodium and glucose substrates in the same direction across the apical membrane, using the energy from a downhill sodium gradient against an uphill glucose gradient. Elevated intracellular glucose concentration induces the extrusion of glucose out of the cells by GLUT2, an isoform of the sodium-independent, facilitative glucose/hexose transporter (GLUT) family, located on the basolateral membrane (Thorens et al. 1990; Kellett, 2001; Scheepers et al. 2004). This mechanism is valid for other sugars like galactose and mannose, but not for fructose, which can only be extruded by GLUT2 (Cheeseman, 1993), but needs to be taken up from the lumen by the GLUT5 isoform (Burant et al. 1992; Burant & Saxena, 1994).
In the intestine, the transport of glucose is considered an important example of how luminal sweet stimuli have a regulatory effect on glucose transporters, because changes of sugar concentration generated in the lumen during digestion induce adaptive responses of glucose transporters in the intestinal epithelium. Evidence for a close matching between the intestinal expression of glucose transporters and the composition and amount of the diet has been provided by several in vivo or in vitro experiments. It has been shown that the expression of SGLT1 in enterocytes is related to the amount of luminal monosaccharides (Dyer et al. 1997, 2007; Stearns et al. 2010). An additional intestinal sugar absorption through the GLUT2 pathway appeared to be induced by high levels of glucose generated during digestion of carbohydrate-rich food (Kellett & Helliwell, 2000; Kellett, 2001; Kellett & Brot-Laroche, 2005), and it seemed to occur entirely in enterocytes and required the insertion of GLUT2 into the apical membrane (Mace et al. 2007). Similarly, the intestinal expression of GLUT5 showed to be markedly and specifically increased by high-fructose diets or solutions (Inukai et al. 1993; Shu et al. 1997, 1998; Ferraris, 2001).
Chemosensing of luminal contents by receptors is now of interest also in the gastrointestinal tract, because it is possible that chemoreceptors might play a role in food intake control. Enteroendocrine cells and enterocytes are considered to be the main agents in the perception and absorption of intraluminal free sugars, respectively (Sternini et al. 2008). It is now well established that the sweet receptors in enteroendocrine cells are the same T1R2 and T1R3 receptors that perceive sweet substances in the taste receptor cells (TRCs) of the tongue (Bezençon et al. 2006; Dyer et al. 2007). The sweet receptor functions associated in the T1R2 + T1R3 heterodimer and belonging to the G-protein-coupled receptor superfamily use G-protein-linked signaling pathways involving α-gustducin, phospholipase C β type 2 (PLCβ2), inositol 1,4,5-triphosphate and transient receptor potential channel M5 as signaling elements (Perez et al. 2002; Hofmann et al. 2003; Liu & Liman, 2003).
The oral cavity is like a gateway to the digestive system in which sugars contained in ingested food are partially broken down by salivary enzymes, generating a local buildup of sugar. Recently, we have shown that amylase is expressed in taste bud cells of the circumvallate papillae, suggesting that a local release of amylase by taste cells could increase sugar levels in the external milieu of TRCs, which could in turn modulate initial events in taste perception (Merigo et al. 2009).
Considering the regulatory effect of luminal sugar concentrations on glucose uptake and transport in intestinal cells, it is conceivable that TRCs are responsive to local changes of sugar concentration through modulation of mechanisms having direct effects on glucose homeostasis. In other words, it may be that TRCs respond to increased levels of external sugar not only by detection of sweet stimuli but also through mechanisms of glucose absorption. Some reports have demonstrated, using electrophysiology experiments, a sugar-activated lingual Na transport system, stimulated by both mono- and disaccharides, in the dorsal lingual epithelia from dog (Mierson et al. 1988), and a d-glucose transport system in the human oral cavity, predominantly localized in the dorsum of the tongue (Kurosaki et al. 1998; Oyama et al. 1999). On these evidences implying the existence of glucose transport in the tongue, we hypothesized that glucose transporters might be present in the gustatory epithelium of tongue as mechanisms of substrate-induced regulation, and that TRCs may participate in sugar sensing by molecular elements analogous to those observed in intestinal cells.
To test this hypothesis, in the present study we examined the expression of the major intestinal glucose transporters (SGLT1, GLUT2, GLUT5) in rat circumvallate papillae, which are localized in the dorsal part of the tongue where glucose transport has previously been described, using immunostaining at light and electron microscopy and reverse transcriptase-polymerase chain reaction (RT-PCR) analyses. In addition, using double-labeling confocal laser microscopy, the glucose transporter immunolabeling was compared with that of α-gustducin and T1R3 receptor.
Materials and methods
Tissue preparation
The study was conducted on 15 adult Wistar rats of both sexes (150–200 g; Morini Company, Reggio Emilia, Italy) kept at the departmental animal facility. The rats were allowed free access to food and water, and were handled in accordance with the guidelines for animal experimentation established by Italian law. The animals were anesthetized with ether and perfused with 4% paraformaldehyde in 0.1 m phosphate buffer (PB), pH 7.4. The excised tissues (i.e. circumvallate papillae, pancreas, proximal jejunum) were further fixed by immersion in the same fixative for 2 h at 4 °C. After rinsing in 0.1 m PB, the tissues were put into 30% sucrose overnight and cut (40 μm thickness) on a freezing microtome (Reichert-Jung, Vienna, Austria). Sections from seven animals were processed both for immunoperoxidase and single-immunofluorescence labeling, and sections from eight animals for double-immunofluorescence labeling. Two or three sections per animal were used for each immunohistochemical experiment.
Primary antibodies
For this study we used the following primary antibodies: anti-GLUT2 (Chemicon International, Temecula, CA, USA, cat #AB1342 and LifeSpan Biosciences, Seattle, WA, USA, cat #LS-C15390/25520); anti-GLUT5 (Chemicon International, cat #AB1348 and Lifespan Biosciences, cat #LS-C15414/7781); anti-SGLT1 (abcam, Cambridge, UK, cat #ab14686); anti-α-gustducin (Santa Cruz Biotechnology, Heidelberg, Germany, cat #sc-395); T1R3 (abcam, cat #ab74732).
Peroxidase-immunohistochemistry
Sections were blocked for 1 h in 0.3% Triton X-100, 1% bovine serum albumin (BSA) and 1% normal swine serum in 0.1 m phosphate-buffered saline (PBS; blocking solution); the same solution was used to dilute the antibodies. Immunohistochemical staining was performed using the avidin-biotin complex (ABC) technique. Briefly, endogenous peroxidase was quenched by immersion in a solution of 0.3% hydrogen peroxide in methanol for 30 min. After washing in PB, the sections were treated with blocking solution for 20 min. Subsequently, sections were incubated overnight at 4 °C with anti-GLUT2 (1 : 1000 abcam, 1 : 400 LSBio), anti-GLUT5 (1 : 1000 abcam, 1 : 400 LSBio), or anti-SGLT1 (1 : 1000), and then reacted with biotinylated swine anti-rabbit immunoglobulins (DAKO, Milan, Italy; 1 : 400) for 2 h. The immunoreaction was detected using a Vectastain Elite ABC kit (Vector, Burlingame, CA, USA) and then visualized with 3.3′-diaminobenzidine tetrahydrocloride (DAKO) for 5–10 min. Finally, sections were collected on polylysine-coated slides and mounted with DAKO® Faramount Aqueous Mounting Medium. Control sections were prepared by preabsorbing the glucose transporter antibodies with the corresponding peptide (5 μg per 1 mL of antibody) or by omitting the primary antibody. Sections were observed under an Olympus BX51 photomicroscope equipped with a KY-F58 CCD camera (JVC). Electronic images were analyzed and stored using Image-ProPlus software (Media Cybernetics, Silver Springs, MD, USA).
Immunofluorescence
Single-labeling
Free-floating sections were blocked for 1 h in 0.3% Triton X-100, 1% BSA and 1% normal goat serum in 0.1 m PBS (blocking solution). Subsequently, they were incubated overnight in anti-GLUT2 (1 : 200 abcam and LSBio), anti-GLUT5 (1 : 200 abcam and LSBio) or anti-SGLT1 (1 : 200), and after washes, reacted with a secondary rhodamine (TRITC)-conjugated goat anti-rabbit IgG antibody (Jackson Laboratories, West Grove, PA, USA; 1 : 200) for 1 h at room temperature. Control sections were prepared as described above.
Double-labeling
The glucose transporter immunolabeling was compared with that of α-gustducin and T1R3. The double-label assay was carried out sequentially with a method that relied on the use of secondary monovalent Fab fragments (Lewis Carl et al. 1993; Negoescu et al. 1994), because all primary antibodies are raised in the same species. Free-floating sections were blocked for 1 h in blocking solution and then incubated overnight at 4 °C with anti-GLUT2, anti-GLUT5 or anti-SGLT1. After washes, they were reacted with Cy™3-conjugated Affinity Pure Fab Fragment Goat anti Rabbit IgG (Jackson Laboratories; 1 : 200) at room temperature for 1 h. Unoccupied antigen-binding sites in the primary or secondary antibody were then blocked by incubation with normal rabbit serum (nrs; DAKO; 1 : 50) followed by an excess of unconjugated Affinity Pure Fab Fragment goat anti-rabbit IgG (Jackson Laboratories; 1 : 20) for 4 h. After washes, the blocking solution was again applied for 1.5 h, followed by incubation overnight with the second primary antibody anti-α-gustducin (1 : 200) or anti-T1R3 (1 : 200). Finally, sections were exposed to FITC-conjugated Affinity Pure Fab fragment goat anti-rabbit IgG (Jackson Laboratories; 1 : 200) for 1 h. Sections were mounted with fluorescent mounting medium (DAKO), and observed with a Zeiss LSM 510 confocal microscope equipped with argon (488 nm) and helium/neon (543 nm) excitation beams. Sequential acquisition, i.e. one color at a time, was utilized on double-label tissues to avoid side-band excitation of the inappropriate fluorophore. All images for publication were composed using Adobe Photoshop software (version 6.0; Adobe Systems, Mountain View, CA, USA), adjusting only brightness and contrast.
Control sections were prepared by one of the following methods:
adding the corresponding peptide (5 μg per 1 mL of antibody) to glucose transporter antibodies;
replacing the second primary antibody with nrs;
exchanging the fluorophores of the secondary antibodies;
omitting the primary antibody;
changing the sequence of secondary antibody application.
Immunoelectron microscopy
For ultrastructural examination, free-floating sections, previously immunostained using the ABC technique, were postfixed in 1% OsO4 in PB for 1 h, dehydrated in graded concentrations of acetone, and embedded in a mixture of Epon and Araldite (Electron Microscopic Sciences, Fort Washington, PA, USA). Semithin sections (thickness 1 μm) were examined using light microscopy to locate areas showing immunoreactivity. Ultrathin sections were cut at 70 nm thickness on an Ultracut-E ultramicrotome (Reichert-Jung) and observed unstained on an EM 10 electron microscope (Zeiss, Oberkochen, Germany).
Total RNA isolation and RT-PCR
Five adult Wistar rats were used to perform this experiment. Tongues and other control tissues (i.e. duodenum, pancreas, liver, kidney and spleen) were quickly removed from animals anesthetized with ether and killed by vertebrae dislocation. Circumvallate papillae of the tongues were carefully resected with the use of a stereo-microscope, and peeled from the muscles and Von Ebner's glands. The total RNA was isolated using TriZol reagent (Invitrogen, Life Technologies, Milan, Italy) according to the manufacturer's instructions. Following spectrophotometric determination of total RNA content, samples of RNA (about 1 μg of the total RNA) from each tissue were digested with RNase-free DNase I Amp Grade (Invitrogen), reverse transcribed to cDNA and amplified with gene-specific primers by using the SuperScript First-Strand Synthesis System for RT-PCR kit (Invitrogen). The following primer sequences were used: glyceraldehyde-3 phosphate dehydrogenase (GAPDH), 5′-ACTGGCGTCTTCACCACCAT-3′ (forward) and 5′-ATCCACAGTCTTCTGGGTGG-3′ (reverse), product size 273 bp; SGLT1 (gene name SLC5A1), 5′-GACTCGTTCCACATATTCCGAGACC-3′ (forward) and 5′GTAGGCGATGTTGGTACAGCCCA-3′ (reverse), product size 318 bp; GLUT2 (gene name SLC2A2), 5′-TCCAGTTCGGATATGACATCGGTG-3′ (forward) and 5′GTGACGTCCTCAGTGCCCCTTAG-3 (reverse), product size 738 bp; GLUT5 (gene name SLC2A5), 5′-GTACAACGTGGCTGCTGTCAACTC-3′ (forward) and 5′-CGCTTGCCAAGACACTCCGAAG-3′ (reverse), product size 467 bp. Expression of GAPDH was used as the internal standard. PCR amplification was performed in an Eppendorf Mastercycler gradient at 95 °C for 30 s, 60 °C for 30 s and 72 °C for 25–45 s for 36 cycles. The PCR products were identified on the basis of their size, determined by gel electrophoresis in 1.5% agarose gels.
Results
Immunohistochemical localization of glucose transporters in TRCs
Glucose transporters in TRCs were detected by light immunohistochemistry and immunofluorescence experiments using anti-GLUT2, -GLUT5 and -SGLT1 antibodies (Fig. 1). Two polyclonal anti-GLUT2 and -GLUT5 antibodies were used, and the comparison of their results showed a similar labeling pattern. Immunostaining was observed in basoapically elongated cells with round or oval nuclei, and in bipolar cells. A cytoplasmic and/or vesicular pattern of staining was observed for all the antibodies used. In particular, GLUT2 reactivity was mainly localized in the basolateral region (i.e. below and around the nucleus) and/or in the apical cell process (Fig. 1A,B).
Fig. 1.
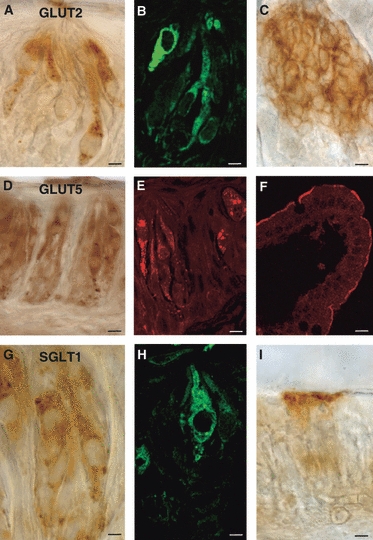
Immunoperoxidase (A, C, D, G, I) and immunofluorescent (B, E, F, H) staining showing GLUT2- (A, B), GLUT5- (D, E) or SGLT1- (G, H) immunoreactivity in taste buds of rat circumvallate papillae. The taste pore is toward the top in all the photomicrographs. As positive control, GLUT2-immunoreactivity is shown in rat pancreatic islet cells (C), GLUT5 and SGLT1 in rat jejunum (F, I, respectively). Scale bars: 5 μm (A–C, G–I); 10 μm (D, E); 15 μm (F).
GLUT5-immunoreactivity was distributed around the nucleus or in the apical cell pole or throughout the entire cytoplasm (Fig. 1D,E). GLUT5 staining was also seen in nerve fibers located within the subepithelial connective tissue layer.
SGLT1-immunoreactivity was mainly observed throughout the entire cytoplasm, also with vesicular pattern (Fig. 1G,H). Immunoreactivity was never seen in nerve fibers located within the subepithelial connective tissue layer.
We assessed the specificity of GLUT2 antibody in the pancreas, and those of GLUT5 and SGLT1 in the jejunum, being well-known sites of their localization. As expected, GLUT2-immunoreactivity was observed in pancreatic islet cells (Fig. 1C); GLUT5- and SGLT1-expressions were found in the apical membrane of epithelial cells in jejunum (Fig. 1F,I, respectively).
Immunoreactivity was not observed when anti-glucose transporters antibodies were preincubated with an excess control peptide or the primary antibody was omitted.
By laser-scanning confocal microscopy, the glucose transporter immunolabeling was compared with that of α-gustducin and T1R3. GLUT2-, GLUT5- and SGLT1-immunoreactivities were observed in some cells expressing α-gustducin, with a labeling pattern that mainly coexpressed around the nucleus or in the apical process (Fig. 2A–I). However, not all GLUT2-, GLUT5- or SGLT1-immunoreactive cells were α-gustducin-positive. No specific labeling was seen when glucose transporters antibodies were preincubated with the corresponding antigen peptide (Fig. 3A–I), or the second primary antiserum was replaced with nrs (Fig. 3J–L).
Fig. 2.
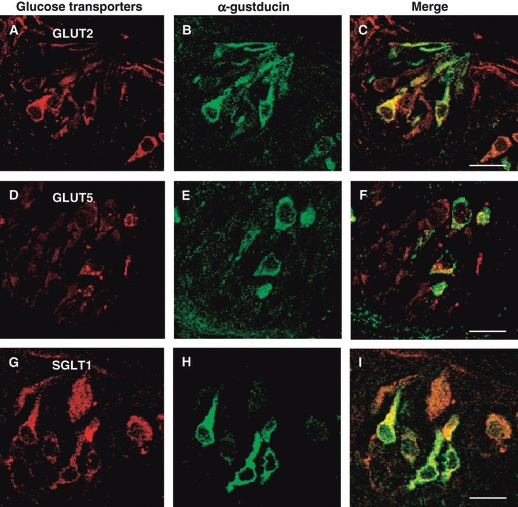
Double-immunofluorescent confocal microscopy showing expression of GLUT2 (A–C), GLUT5 (D–F) and SGLT1 (G–I) with α-gustducin in taste buds of rat circumvallate papillae. The coexpression pattern is shown in the merge. The taste pore is toward the top in the photomicrographs (A–I). Scale bars: 10 μm (C, F, I).
Fig. 3.
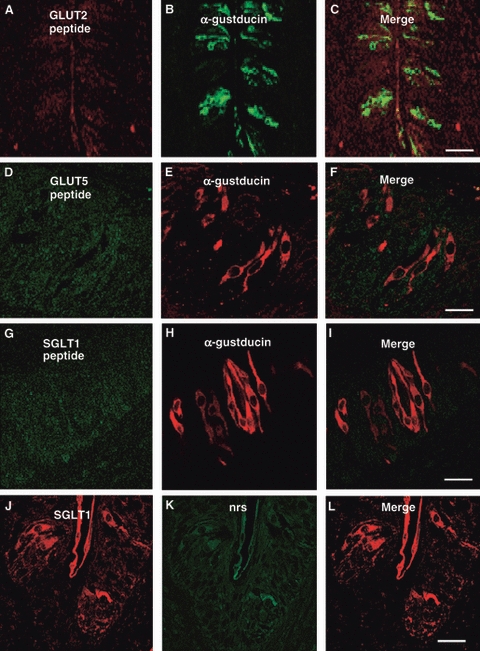
Double-immunofluorescent confocal microscopy showing absence of labeling when anti-GLUT2 (A–C), anti-GLUT5 (D–F) and anti-SGLT1 (G–I) antibodies were preincubated with the control peptide antigen, or the second primary antiserum was replaced with normal rabbit serum (nrs; J–L). Scale bars: 30 μm (C, L); 10 μm (F, I).
Dual immunohistochemistry for glucose transporters and T1R3 revealed that some T1R3-positive cells colabeled with all the glucose transporters (Fig. 4A–I). Furthermore, some glucose transporters-immunoreactive cells lacked T1R3 expression, and others were only T1R3-immunopositive.
Fig. 4.
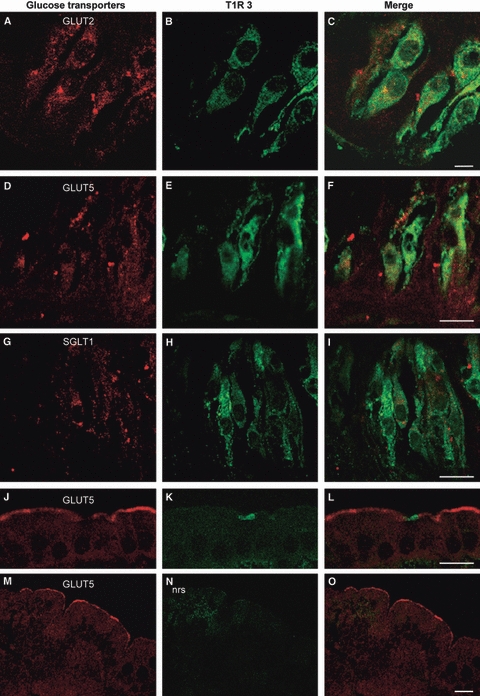
Double-immunofluorescent confocal microscopy showing expression of GLUT2 (A–C), GLUT5 (D–F), SGLT1 (G–I) and T1R3 in taste buds of rat circumvallate papillae, and for GLUT5 and T1R3 in rat jejunum (J–L). The coexpression pattern is shown in the merge. The specificity of the double-labeling procedure is demonstrated by absence of labeling when the second primary antiserum was replaced with normal rabbit serum (nrs) in jejunum (M–O). The taste pore is toward the top in the photomicrographs (A–I). Scale bars: 5 μm (C); 10 μm (F, I, L); 30 μm (O).
To assess the specificity of the double-labeling procedure we carried out double-immune-fluorescence with GLUT5 and T1R3 in jejunum. As expected, in no case was overlapping observed, being T1R3 expression localized in enteroendocrine and GLUT5 in the apical membrane of absorptive cells (Fig. 4J–L).
No specific double-labeling was seen when the second primary antibody was replaced with nrs (Fig. 4M–O).
Immunoelectron microscopy of glucose transporters in TRCs
To reveal the subcellular localizations of the glucose transporters, peroxidase-immunostained ultrathin sections of circumvallate papillae were analysed by transmission electron microscope. Consistent with the histological localization, electron-microscopic examination showed that GLUT2 and GLUT5, as well as SGLT1, were expressed in TRCs. Their expression was observed in cell types with morphological characteristics of chemoreceptor cells that differed considerably in their shape and immunostaining, from the surrounding taste bud cells, that lacked immunostaining and resembled type I cells in their ultrastructural characteristics of dense apical granule-containing cells (Fig. 5A). Immunoreactive cells were flask/pear-shaped cells devoid of basal processes, or bipolar. Ultrastructurally, their cytoplasm showed few bundles of tonofilaments and appeared less dense in respect to that of the neighboring cells (Fig. 5A). The basolateral membrane of chemoreceptor-immunoreactive cells presented immunostained intercellular junctions with the adjacent basolateral cell membranes (Fig. 5B). On the membrane (e.g. apical, basolateral and nuclear), GLUT2 and GLUT5 immunostaining were observed mainly concentrated in specific regions, named microdomains, where the GLUT2 or GLUT5 proteins were probably clustered (Fig. 5B, insert). Some GLUT5-positive cells showed ultrastructural characteristics of few-differentiated cells, characterized by scarce cytoplasm, heterochromatic nucleus and high nucleus/cytoplasm ratio. They rested on the basement membrane and did not reach the lumen (Fig. 5C); their basolateral membranes were continuous with those of nearby cells through evaginations that increased their membrane surface. In GLUT2-, GLUT5- and SGLT1-immunoreactive cells, staining was predominantly localized in the cytoplasm, especially within the rough endoplasmic reticulum, as well as in some cisternae of Golgi apparatus (Fig. 5B,D,E) and in intracellular vesicles (Fig. 5A, insert), mainly distributed in the apical cell pole. GLUT5-immunoreactive nerve fibers were detected beneath the basal lamina. Unstained control sections lacked immunostaining throughout the entire cytoplasm as well as on the membranes (Fig. 5F).
Fig. 5.
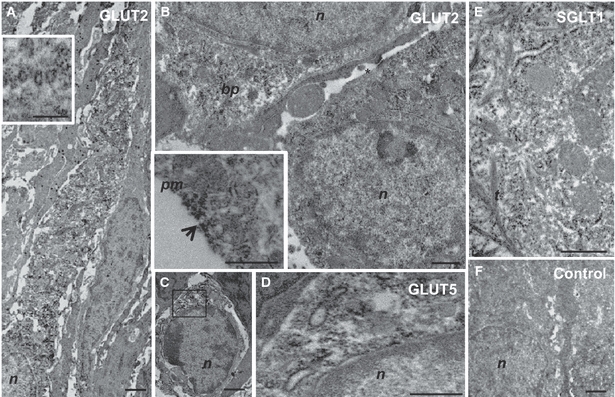
Immunoelectron microscopy showing expression of GLUT2 (A, B), GLUT5 (C, D) and SGLT1 (E) in TRCs of rat circumvallate papillae. An immunoreactive TRC surrounded by dense apical granule-containing cells (A). Detail of positive intracellular vesicles distributed in the apical cell pole (A, insert). Positive TRCs with immunoreactivity in intercellular junctions on the basolateral membranes (B, asterisk); detail of immunostaining concentrated in specific microdomains on the membrane (B, insert, arrow). A few-differentiated positive cell on the basement membrane (C). Higher magnification image of the boxed area in (C) demonstrates immunoreactivity concentrated in the Golgi region around the nucleus (D). Immunoreactivity distributed in the endoplasmic reticulum (E). Unstained control TRCs (F). bp, basal pole; m, mithochondria; n, nucleus; pm, plasma membrane; t, tonofilaments. Scale bars: 0.5 μm (B, A and B insert, D, E), 1 μm (C, F), 2 μm (A).
RT-PCR/expression of glucose transporters in TRCs
The expressions of mSGLT1, mGLUT2 and mGLUT5 were examined by RT-PCR using RNA isolated from rat circumvallate papillae, duodenum, pancreas, liver, kidney and spleen. As shown in Fig. 6, GAPDH standard product was expressed in all the tissues. In addition, a single band of the expected size for GLUT2, GLUT5 and SGLT1 mRNA (corresponding to 738-, 467- and 318-bp products, respectively) was present in RNA extracted from circumvallate papillae. The mRNAs of GLUT2, GLUT5 and SGLT1 were expressed also in duodenum, liver and kidney, used as positive controls. The pancreas expressed GLUT2 and SGLT1 mRNAs, and the spleen only GLUT5 mRNA.
Fig. 6.
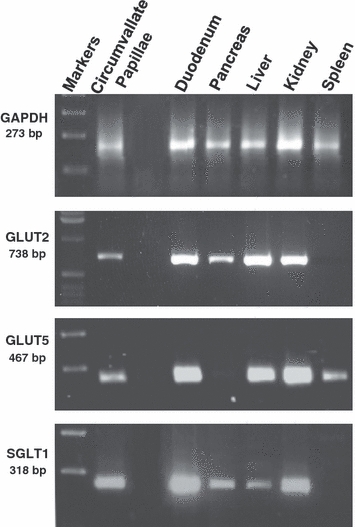
RT-PCR was carried out with primers specific for GLUT2, GLUT5 and SGLT1 cDNA. The templates were cDNA prepared from RNA isolated from rat circumvallate papillae, duodenum, pancreas, liver, kidney and spleen homogenates. The expected size of PCR products is 738 bp for GLUT2, 467 bp for GLUT5 and 318 bp for SGLT1.
Discussion
This study demonstrates, for the first time, the expression of GLUT2, GLUT5 and SGLT1 – typically intestinal glucose transporters – in TRCs of rat circumvallate papillae, using immunocytochemistry and RT-PCR analysis. Staining for all three glucose transporters was found in both the apical and basolateral membranes of TRCs, but also distributed throughout the entire cytoplasm. This observation is in agreement with the specific immunolocalization observed using electron microscopy, showing that GLUT2-, GLUT5- and SGLT1-immunoreactivity was concentrated in intracellular structures (i.e. endoplasmic reticulum, cisternae of the Golgi apparatus, vesicles, plasma and nuclear membrane). On plasma and nuclear membrane, GLUT2- and GLUT5-immunoreactivity appeared non-homogeneously distributed, showing staining preferentially concentrated in some microdomains, as described in an earlier ultrastructural immunohistochemical characterization (Orci et al. 1989). In addition, the intracellular distribution of the glucose transporters observed in the present study is in accordance with a previous ultrastructural SGLT1 labeling in the Golgi apparatus of some absorptive epithelial intestinal cells, which was interpreted ‘as a biosynthetic process or a reservoir for the apical membrane SGLT1 protein’ (Takata, 1996). This process may be a possible explanation of the intracellular localization of the glucose transporters observed in this study, which may represent a storage compartment after their removal from plasma membrane by endocytosis, and reflect the physiological situation of TRCs. It is evident that this intracellular distribution differs significantly from their topographical localization in intestinal cells. However, some obvious structural differences between intestinal and taste bud cells might give account of the different localization.
GLUT2-, GLUT5- and SGLT1-immunoreactivities were also observed in TRCs that displayed staining for α-gustducin and T1R3, indicating that some subsets displayed the same signaling molecules that mediate the responses to sweet stimuli in the gastrointestinal tract. However, only a subpopulation of glucose transporters-containing cells was α-gustducin- or T1R3-positive, providing evidences that the glucose transporters are selectively expressed in TRCs. Clearly, although physiological investigation will be required to elucidate the role of glucose transporters in TRCs, it might be that in the oral cavity the sweet receptors, together with glucose transporters, represent a specific local monitoring system of sugar concentration. Recent experiments have provided functional evidence that the regulation of intestinal SGLT1 and GLUT2 is induced by the sensing of sugar of the enteroendocrine cells through activation of T1R2/T1R3 in response to increases in dietary sugar (Margolskee et al. 2007; Kellett et al. 2008; Stearns et al. 2010). A similar pathway could be operative in TRCs that might be considered sugar-sensing cells that participate in the regulation of glucose homeostasis, along with the contribution of the glucose transporters. Our recent study showed that taste bud cells of circumvallate papillae expressed amylase, also in coexpression with α-gustducin, PLCβ2 and chromogranin A, all elements that support the capacity of amylase-expressing cells to activate chemosensory responses (Merigo et al. 2009). The findings of the present work add a further link between chemosensory information and cellular responses of TRCs to sweet stimuli.
In the gastrointestinal tract, it is well known that the expression of glucose transporters may be differentially regulated by external/internal stimuli (Zhao & Keating, 2007), although the way luminal stimuli can modulate their expression has yet to be clearly determined. Luminal glucose exposure mediates gastrointestinal (i.e. reduction of satiety, acceleration of gastric emptying; Young et al. 2009) and endocrine responses through the release of incretin hormones, like glucagon-like peptide-1 (GLP-1) and glucose-dependent insulinotropic peptide (GIP) from enteroendocrine cells (McIntyre et al. 1964; Falko et al. 1980; Elliott et al. 1993; Yoder et al. 2010). Although some studies showed that this secretion of incretin hormones of the gut was regulated by T1R3 and α-gustducin (Egan & Margolskee, 2008; Kokrashvili et al. 2009), others supported a functional relationship between incretin hormone secretion and GLUT2 (Cani et al. 2007) or SGLT1 expression (Jang et al. 2007; Margolskee et al. 2007; Moriya et al. 2009), also suggesting that SGLT1 is an upper intestinal glucose sensor able to mediate secretion of incretin hormones by itself (Moriya et al. 2009). Considering that TRCs express the same signaling molecules that mediate sugar sensing in intestinal cells (Mace et al. 2007; Margolskee et al. 2007; Sternini et al. 2008), it could be speculated that TRCs could modulate glucose transporter expression through the involvement of gut-related hormones and neuropeptides. The expression of GLP-1 (Feng et al. 2008; Shin et al. 2008; Martin et al. 2009), cholecystokinin (Kusakabe et al. 1998; Herness et al. 2002; Shen et al. 2005), neuropeptide y (Zhao et al. 2005), vasoactive intestinal peptide (Herness, 1989; Kusakabe et al. 1998; Shen et al. 2005; Martin et al. 2010), galanin (Seta et al. 2006), GIP and leptin receptor (Kawai et al. 2000; Ninomiya et al. 2002; Shigemura et al. 2004), and glucagon (Elson et al. 2010) have been reported in TRCs of humans and rodents, often colocalized with markers of taste transduction pathways (i.e. T1R2 and T1R3 receptors, α-gustducin; Shen et al. 2005). Although the functional roles of these molecules in TRCs remain to be clearly established, most of these studies indicate that in TRCs they act as local signaling modulators in food perception, suggesting an endocrine and paracrine modulation of the peripheral gustatory apparatus.
On this basis, the presence of glucose transporters in TRCs can profoundly influence the pathways activated by the perception of sweet stimuli, and may have more complex functions and implications. Research in this area could provide the basis for novel diagnostic and therapeutic strategies in the treatment of pathological states in which the glucose transporters are altered or differentially regulated (i.e. obesity, diabetes, malabsorption).
Acknowledgments
The authors thank Dr Christine Harris for revising the manuscript.
References
- Bezençon C, le Coutre J, Damak S. Taste-signaling proteins are coexpressed in solitary intestinal epithelial cells. Chem Senses. 2006;32:41–49. doi: 10.1093/chemse/bjl034. [DOI] [PubMed] [Google Scholar]
- Burant CF, Saxena M. Rapid reversible substrate regulation of fructose transporter expression in rat small intestine and kidney. Am J Physiol Gastrointest Liver Physiol. 1994;267:G71–G79. doi: 10.1152/ajpgi.1994.267.1.G71. [DOI] [PubMed] [Google Scholar]
- Burant CF, Takeda J, Brot-Laroche E, et al. Fructose transporter in human spermatozoa and small intestine is GLUT5. J Biol Chem. 1992;267:14 523–14 526. [PubMed] [Google Scholar]
- Cani PD, Holst JJ, Drucker DJ, et al. GLUT2 and the incretin receptors are involved in glucose-induced incretin secretion. Mol Cell Endocrinol. 2007;276:18–23. doi: 10.1016/j.mce.2007.06.003. [DOI] [PubMed] [Google Scholar]
- Cheeseman CI. GLUT2 is the transporter for fructose across the rat intestinal basolateral membrane. Gastroenterology. 1993;105:1050–1056. doi: 10.1016/0016-5085(93)90948-c. [DOI] [PubMed] [Google Scholar]
- Dyer J, Barker PJ, Shirazi-Beechey SP. Nutrient regulation of the intestinal Na+/glucose co-transporter (SGLT1) gene expression. Biochem Biophys Res Commun. 1997;230:624–629. doi: 10.1006/bbrc.1996.6018. [DOI] [PubMed] [Google Scholar]
- Dyer J, Daly K, Salmon KS, et al. Intestinal glucose sensing and regulation of intestinal glucose absorption. Biochem Soc Trans. 2007;35:1191–1194. doi: 10.1042/BST0351191. [DOI] [PubMed] [Google Scholar]
- Egan JM, Margolskee RF. Taste cells of the gut and gastrointestinal chemosensation. Mol Interv. 2008;8:78–81. doi: 10.1124/mi.8.2.5. [DOI] [PMC free article] [PubMed] [Google Scholar]
- Elliott RM, Morgan LM, Tredger JA, et al. Glucagon-like peptide-1 (7-36) amide and glucose-dependent insulinotropic peptide secretion in response to nutrient ingestion in man: acute postprandial and 25-h secretin patterns. J Endocrinol. 1993;138:159–166. doi: 10.1677/joe.0.1380159. [DOI] [PubMed] [Google Scholar]
- Elson AE, Dotson CD, Egan JM, et al. Glucagon signaling modulates sweet taste responsiveness. FASEB J. 2010;24:3960–3969. doi: 10.1096/fj.10-158105. [DOI] [PMC free article] [PubMed] [Google Scholar]
- Falko JM, Crockett SE, Cataland S, et al. The effect of increasing doses of ingested glucose on insulin and gastric inhibitory polypeptide (GIP) concentrations in man. Clin Endocrinol. 1980;13:587–593. doi: 10.1111/j.1365-2265.1980.tb03427.x. [DOI] [PubMed] [Google Scholar]
- Feng XH, Liu XM, Zhou LH, et al. Expression of glucagon-like peptide-1 in the taste buds of rat circumvallate papillae. Acta Histochem. 2008;110:151–154. doi: 10.1016/j.acthis.2007.10.005. [DOI] [PubMed] [Google Scholar]
- Ferraris RP. Dietary and developmental regulation of intestinal sugar transport. Biochem J. 2001;360:265–276. doi: 10.1042/0264-6021:3600265. [DOI] [PMC free article] [PubMed] [Google Scholar]
- Herness MS. Vasoactive intestinal peptide-like immunoreactivity in rodent taste cells. Neuroscience. 1989;33:411–419. doi: 10.1016/0306-4522(89)90220-0. [DOI] [PubMed] [Google Scholar]
- Herness S, Zhao FL, Lu SG, et al. Expression and physiological responses of cholecystokinin in taste receptor cells. J Neurosci. 2002;22:10 018–10 029. doi: 10.1523/JNEUROSCI.22-22-10018.2002. [DOI] [PMC free article] [PubMed] [Google Scholar]
- Hofmann T, Chubanov V, Gudermann T, et al. TRPM5 is a voltage-modulated and Ca(2+)-activate monovalent selective cation channel. Curr Biol. 2003;13:1153–1158. doi: 10.1016/s0960-9822(03)00431-7. [DOI] [PubMed] [Google Scholar]
- Inukai K, Asano T, Katagiri H, et al. Cloning and increased expression with fructose feeding of rat jejunal GLUT5. Endocrinology. 1993;133:2009–2014. doi: 10.1210/endo.133.5.8404647. [DOI] [PubMed] [Google Scholar]
- Jang HJ, Kokrashvili Z, Theodorakis MJ, et al. Gut-expressed gustducin and taste receptors regulate secretion of glucagon-like peptide-1. Proc Natl Acad Sci USA. 2007;104:5069–15 074. doi: 10.1073/pnas.0706890104. [DOI] [PMC free article] [PubMed] [Google Scholar]
- Kawai K, Sugimoto K, Nakashima K, et al. Leptin as a modulator of sweet taste sensitivities in mice. Proc Natl Acad Sci USA. 2000;97:11 044–11 049. doi: 10.1073/pnas.190066697. [DOI] [PMC free article] [PubMed] [Google Scholar]
- Kellett GL. The facilitated component of intestinal glucose absorption. J Physiol. 2001;531:585–595. doi: 10.1111/j.1469-7793.2001.0585h.x. [DOI] [PMC free article] [PubMed] [Google Scholar]
- Kellett GL, Brot-Laroche E. Apical GLUT2: a major pathway of intestinal sugar absorption. Diabetes. 2005;54:3056–3062. doi: 10.2337/diabetes.54.10.3056. [DOI] [PubMed] [Google Scholar]
- Kellett GL, Helliwell PA. The diffusive component of intestinal glucose absorption is mediated by the glucose-induced recruitment of GLUT2 to the brush-border membrane. Biochem J. 2000;350:155–162. [PMC free article] [PubMed] [Google Scholar]
- Kellett GL, Brot-Laroche E, Mace OJ, et al. Sugar absorption in the intestine: the role of GLUT2. Annu Rev Nutr. 2008;28:35–54. doi: 10.1146/annurev.nutr.28.061807.155518. [DOI] [PubMed] [Google Scholar]
- Kokrashvili Z, Mosinger B, Margolskee RF. Taste signaling elements expressed in gut enteroendocrine cells regulate nutrient-responsive secretion of gut hormones. Am J Clin Nutr. 2009;90:822S–825S. doi: 10.3945/ajcn.2009.27462T. [DOI] [PMC free article] [PubMed] [Google Scholar]
- Kurosaki Y, Yano K, Kimura T. Perfusion cells for studying regional variation in oral mucosal permeability in humans. 2. A specialized transport mechanism in D-glucose absorption exists in dorsum of tongue. J Pharm Sci. 1998;87:613–615. doi: 10.1021/js9703028. [DOI] [PubMed] [Google Scholar]
- Kusakabe T, Matsuda H, Gono Y, et al. Immunohistochemical localization of regulatory neuropeptides in human circumvallate papillae. J Anat. 1998;192:557–564. doi: 10.1046/j.1469-7580.1998.19240557.x. [DOI] [PMC free article] [PubMed] [Google Scholar]
- Lewis Carl SA, Gillete-Ferguson I, Ferguson DG. An indirect immunofluorescence procedure for staining the same cryosection with two mouse monoclonal primary antibodies. J Histochem Cytochem. 1993;41:1273–1278. doi: 10.1177/41.8.7687266. [DOI] [PubMed] [Google Scholar]
- Liu D, Liman ER. Intracellular Ca2+ and the phospholipid PIP2 regulate the taste transduction ion channel TRPM5. Proc Natl Acad Sci USA. 2003;100:15 160–15 165. doi: 10.1073/pnas.2334159100. [DOI] [PMC free article] [PubMed] [Google Scholar]
- Mace OJ, Affleck J, Patel N, et al. Sweet taste receptors in rat small intestine stimulate glucose absorption through apical GLUT2. J Physiol. 2007;582:379–392. doi: 10.1113/jphysiol.2007.130906. [DOI] [PMC free article] [PubMed] [Google Scholar]
- Margolskee RF, Dyer J, Kokrashvili Z, et al. T1R3 and gustducin in gut sense sugar to regulate expression of Na+-glucose cotransporter 1. Proc Natl Acad Sci USA. 2007;104:15 075–15 080. doi: 10.1073/pnas.0706678104. [DOI] [PMC free article] [PubMed] [Google Scholar]
- Martin B, Dotson CD, Shin YK, et al. Modulation of taste sensitivity by GLP-1 signaling in taste buds. Ann NY Acad Sci. 2009;1170:98–101. doi: 10.1111/j.1749-6632.2009.03920.x. [DOI] [PMC free article] [PubMed] [Google Scholar]
- Martin B, Shin YK, White CM, et al. Vasoactive intestinal peptide-null mice demonstrate enhanced sweet taste preference, dysglycemia, and reduced taste bud leptin receptor expression. Diabetes. 2010;59:1143–1152. doi: 10.2337/db09-0807. [DOI] [PMC free article] [PubMed] [Google Scholar]
- McIntyre N, Holdsworth CD, Turner DS. New interpretation of oral glucose tolerance. Lancet. 1964;41:20–21. doi: 10.1016/s0140-6736(64)90011-x. [DOI] [PubMed] [Google Scholar]
- Merigo F, Benati D, Cecchini MP, et al. Amylase expression in taste receptor cells of rat circumvallate papillae. Cell Tissue Res. 2009;336:411–421. doi: 10.1007/s00441-009-0789-7. [DOI] [PubMed] [Google Scholar]
- Mierson S, DeSimone SK, Heck GL, et al. Sugar-activated ion transport in canine lingual epithelium. Implications for sugar taste transduction. J Gen Physiol. 1988;92:87–111. doi: 10.1085/jgp.92.1.87. [DOI] [PMC free article] [PubMed] [Google Scholar]
- Moriya R, Shirakura T, Ito J, et al. Activation of sodium-glucose cotransporter 1 ameliorates hyperglycemia by mediating incretin secretion in mice. Am J Physiol Endocrinol Metab. 2009;297:E1358–E1365. doi: 10.1152/ajpendo.00412.2009. [DOI] [PubMed] [Google Scholar]
- Negoescu A, Labat-Moleur F, Lorimier P, et al. F(ab) secondary antibodies: a general method for double immunolabeling with primary antisera from the same species. Efficiency control by chemiluminescence. J Histochem Cytochem. 1994;42:433–437. doi: 10.1177/42.3.7508473. [DOI] [PubMed] [Google Scholar]
- Ninomiya Y, Shigemura N, Yasumatsu K, et al. Leptin and sweet taste. Vitam Horm. 2002;64:221–248. doi: 10.1016/s0083-6729(02)64007-5. [DOI] [PubMed] [Google Scholar]
- Orci L, Thorens B, Ravazzola M, et al. Localization of the pancreatic beta cell glucose transporter to specific plasma membrane domains. Science. 1989;245:295–297. doi: 10.1126/science.2665080. [DOI] [PubMed] [Google Scholar]
- Oyama Y, Yamano H, Ohkuma A, et al. Carrier-mediated transport systems for glucose in mucosal cells of the human oral cavity. J Pharm Sci. 1999;88:830–834. doi: 10.1021/js980298f. [DOI] [PubMed] [Google Scholar]
- Perez CA, Huang L, Rong M, et al. A transient receptor potential channel expressed in taste receptor cells. Nat Neurosci. 2002;5:1169–1176. doi: 10.1038/nn952. [DOI] [PubMed] [Google Scholar]
- Scheepers A, Joost HG, Shurman A. The glucose transporter families SGLT and GLUT: molecular basis of normal and aberrant function. JPEN J Parenter Enteral Nutr. 2004;28:364–371. doi: 10.1177/0148607104028005364. [DOI] [PubMed] [Google Scholar]
- Seta Y, Kataoka S, Toyono T, et al. Expression of galanin and galanin receptor in rat taste buds. Arch Histol Cytol. 2006;69:273–280. doi: 10.1679/aohc.69.273. [DOI] [PubMed] [Google Scholar]
- Shen T, Kaya N, Zhao FL, et al. Co-expression patterns of the neuropeptides vasoactive intestinal peptide and cholecystokinin with the transduction molecules α-gustducin and T1R2 in rat taste receptor cells. Neuroscience. 2005;130:229–238. doi: 10.1016/j.neuroscience.2004.09.017. [DOI] [PubMed] [Google Scholar]
- Shigemura N, Ohta R, Kusakabe Y, et al. Leptin modulates behavioral responses to sweet substances by influencing peripheral taste structures. Endocrinology. 2004;145:839–847. doi: 10.1210/en.2003-0602. [DOI] [PubMed] [Google Scholar]
- Shin YK, Martin B, Golden E, et al. Modulation of taste sensitivity by GLP-1 signaling. J Neurochem. 2008;106:455–463. doi: 10.1111/j.1471-4159.2008.05397.x. [DOI] [PMC free article] [PubMed] [Google Scholar]
- Shu R, David ES, Ferraris RP. Dietary fructose enhances intestinal fructose transport and GLUT-5 expression in weaning rats. Am J Physiol Gastrointest Liver Physiol. 1997;272:G446–G453. doi: 10.1152/ajpgi.1997.272.3.G446. [DOI] [PubMed] [Google Scholar]
- Shu R, David ES, Ferraris RP. Luminal fructose modulates fructose transport and GLUT-5 expression in small intestine of weaning rats. Am J Physiol Gastrointest Liver Physiol. 1998;274:G232–G239. doi: 10.1152/ajpgi.1998.274.2.G232. [DOI] [PubMed] [Google Scholar]
- Stearns AT, Balakrishnan A, Rhoads DB, et al. Rapid upregulation of sodium-glucose transporter SGLT1 in response to intestinal sweet taste stimulation. Ann Surg. 2010;251:865–871. doi: 10.1097/SLA.0b013e3181d96e1f. [DOI] [PMC free article] [PubMed] [Google Scholar]
- Sternini C, Anselmi L, Rozengurt E. Enteroendocrine cells: a site of “taste” in the gastrointestinal chemosensing. Curr Opin Endocrinol Diabetes Obes. 2008;15:73–78. doi: 10.1097/MED.0b013e3282f43a73. [DOI] [PMC free article] [PubMed] [Google Scholar]
- Takata K. Glucose transporters in the transepithelial transport of glucose. J Electron Microsc. 1996;45:275–284. doi: 10.1093/oxfordjournals.jmicro.a023443. [DOI] [PubMed] [Google Scholar]
- Thorens B, Mueckler H. Glucose transporters in the 21st century. Am J Physiol Endocrinol Metab. 2010;298:E141–E145. doi: 10.1152/ajpendo.00712.2009. [DOI] [PMC free article] [PubMed] [Google Scholar]
- Thorens B, Cheng Z-Q, Brown D, et al. Liver transporter: a basolateral protein in hepatocytes and intestine and kidney cells. Am J Physiol. 1990;259:C279–C285. doi: 10.1152/ajpcell.1990.259.2.C279. [DOI] [PubMed] [Google Scholar]
- Wright EM, Martin MG, Turk E. Intestinal absorption in health and disease-sugar. Best Pract Res Clin Gastroenterol. 2003;17:943–956. doi: 10.1016/s1521-6918(03)00107-0. [DOI] [PubMed] [Google Scholar]
- Yoder SM, Yang Q, Kindel TL, et al. Differential responses of the incretin hormones GIP and GLP-1 to increasing doses of dietary carbohydrate but not dietary protein in lean rats. Am J Physiol Gastrointest Liver Physiol. 2010;299:G476–G485. doi: 10.1152/ajpgi.00432.2009. [DOI] [PMC free article] [PubMed] [Google Scholar]
- Young RL, Sutherland K, Pezos N, et al. Expression of taste molecules in the upper gastrointestinal tract in humans with and without type 2 diabetes. Gut. 2009;58:337–346. doi: 10.1136/gut.2008.148932. [DOI] [PubMed] [Google Scholar]
- Zhao FQ, Keating AF. Functional properties and genomics of glucose transporters. Curr Genomics. 2007;8:113–128. doi: 10.2174/138920207780368187. [DOI] [PMC free article] [PubMed] [Google Scholar]
- Zhao FL, Shen T, Kaya N, et al. Expression, physiological action, and coexpression patterns of neuroptide Y in rat taste bud cells. Proc Natl Acad Sci USA. 2005;102:11 100–11 105. doi: 10.1073/pnas.0501988102. [DOI] [PMC free article] [PubMed] [Google Scholar]