

Abstract
Selective 2′-hydroxyl acylation analyzed by primer extension (SHAPE) is a facile technique for quantitative analysis of RNA secondary structure. In general, low SHAPE signal values indicate Watson-Crick base-pairing, and high values indicate positions that are single-stranded within the RNA structure. However, the relationship of SHAPE signals to structural properties such as non-Watson-Crick base-pairing or stacking has thus far not been thoroughly investigated. Here, we present results of SHAPE experiments performed on several RNAs with published three-dimensional structures. This strategy allows us to analyze the results in terms of correlations between chemical reactivities and structural properties of the respective nucleotide, such as different types of base-pairing, stacking, and phosphate–backbone interactions. We find that the RNA SHAPE signal is strongly correlated with cis-Watson-Crick/Watson-Crick base-pairing and is to a remarkable degree not dependent on other structural properties with the exception of stacking. We subsequently generated probabilistic models that estimate the likelihood that a residue with a given SHAPE score participates in base-pairing. We show that several models that take SHAPE scores of adjacent residues into account perform better in predicting base-pairing compared with individual SHAPE scores. This underscores the context sensitivity of SHAPE and provides a framework for an improved interpretation of the response of RNA to chemical modification.
Keywords: 3D structures, RNA, SHAPE signatures, context sensitivity, probabilistic models
INTRODUCTION
The structure of RNA molecules is of profound significance for the fundamental roles they play in cellular regulation (Serganov and Patel 2007; Geissmann et al. 2009; Nowotny and Yang 2009; Scott et al. 2009). There is a pressing need for experimental techniques that allow rapid and accurate determination of RNA structures. Chemical probing techniques such as hydroxyl radical footprinting (Tullius and Dombroski 1985; Tullius and Greenbaum 2005) or in-line probing (Regulski and Breaker 2008; Wakeman and Winkler 2009a,b) are important approaches for RNA structure determination. In recent years, the development of innovative methods such as SHAPE (selective 2′-hydroxyl acylation analyzed by primer extension) (Merino et al. 2005; Wilkinson et al. 2008), SHAMS (selective 2′-hydroxyl acylation analyzed by mass spectrometry) (Turner et al. 2009), and antisense interfered aiSHAPE (Legiewicz et al. 2010) for probing secondary and tertiary structure of RNA molecules has opened new avenues for RNA research. Certain hydroxyl-selective electrophiles, such as N-methylisatoic anhydride (NMIA) (Merino et al. 2005) and 1-methyl-7-nitroisatoic anhydride (1M7) (Mortimer and Weeks 2007), readily react with 2′-OH groups of ribose moieties at nucleotide positions that are single-stranded and unconstrained. In contrast, the 2′-OH group of base-paired or architecturally constrained nucleotides shows reduced nucleophilic reactivity (Merino et al. 2005). Covalently modified positions are identified by stops in subsequent primer extension reactions, followed by electrophoretic fragment separation. Quantitative SHAPE reactivities at single nucleotide resolution can be used as constraints in prediction algorithms to compute RNA secondary structure (Deigan et al. 2009; Low and Weeks 2010), and high-throughput variants of this technique have successfully been implemented (Vasa et al. 2008; Wilkinson et al. 2008).
While SHAPE signatures at each nucleotide position are highly reproducible (Wilkinson et al. 2008), these can be difficult to interpret. For example a low SHAPE signal suggests that the nucleotide participates in base-pairing, but it does not, however, give direct evidence about the base-pairing partner or the type (Leontis and Westhof 2001) of base pair. Also, a nucleotide can participate in several base-pairing interactions simultaneously (up to three according to the Leontis-Westhof classification) (Leontis and Westhof 2001). Furthermore, currently available algorithms that analyze nucleic acid reactivity, either from sequencing gels or from capillary electropherograms, do not always allow unambiguous assignment of reactivities. For complex RNA molecules, SHAPE can support multiple structures (Wilkinson et al. 2008; Watts et al. 2009).
In order to understand better the complex nature of SHAPE, we performed a thorough investigation of SHAPE signatures of seven RNAs (see Table 1) that have a corresponding three-dimensional (3D) structure available in the Protein Data Bank (PDB), examining the correlation between NMIA reactivity and structural features such as base-pairing, stacking, base-pair type, and base-pairing status of adjacent residues. A normalization procedure was subsequently applied to the quantified SHAPE signals, and then correlated SHAPE reactivities were compared with RNA secondary and tertiary structure properties to better understand the underlying properties that a SHAPE experiment measures. We find that the SHAPE signal strongly depends on the base-pairing state of a residue, with cis-Watson-Crick/Watson-Crick interactions showing the strongest correlation. We also find significant correlations with base-pair stacking. Finally, we used these properties to build seven different models that convert a SHAPE score into a posterior probability of base-pairing. By taking into account the SHAPE score of several (two or three) adjacent residues, we can improve (compared to the direct use of SHAPE scores) the correlation between the predicted base-pairing and the base-pairing pattern of the known reference structures. The method is made available as a web server that facilitates conversion of raw SHAPE signal values (as processed by the SAFA software) into posterior probabilities of base-pairing (http://knetfold.abcc.ncifcrf.gov/rnashape/).
TABLE 1.
Data set of RNA structures for which SHAPE experiments were performed

MATERIALS AND METHODS
Generation of RNA SHAPE data
SHAPE experimental data were generated for the RNA sequences listed in Table 1. RNAs were generated by in vitro transcription, purified by electrophoresis, and folded into the native structure (see Fig. 1; Wilkinson et al. 2006). SHAPE experiments were performed with NMIA as the electrophile. 2′-O-adducts were detected as stops in subsequent primer extension reactions using a 5′-radiolabeled DNA primer annealed to a structural cassette introduced into each RNA. After reverse transcription, the RNA of the resulting RNA–DNA hybrid was hydrolyzed under alkaline conditions, and cDNA fragments were resolved by denaturing polyacrylamide gel electrophoresis. Since the RNA constructs under evaluation did not contain any extension at their 5′ termini, the first few 5′ nucleotides could not be quantified due to the very intense band of the full-length extension product. Modification reactions were performed at three different NMIA concentrations (9 mM, 13.5 mM, and 18 mM). Absolute NMIA reactivities were derived by subtracting the intensities of a control experiment performed without NMIA. In order to unambiguously assign correct positions to all bands, four dideoxy sequencing reactions were performed for each RNA. Experiments were performed in triplicate for all RNAs.
FIGURE 1.

Examination of RNAs by nondenaturing polyacrylamide gel electrophoresis. They are (1) musD transport element mutant 6 (external control); (2) HDV ribozyme (PDB: 1CX0); (3) signal recognition particle (PDB: 1Z43); (4) HCV IRES (PDB: 1P5O); (5) self-splicing intron (PDB: 1KXK); (6) BWYV pseudoknot (PDB: 437D); (7) tRNA (PDB: 2TRA); and (8) SARS stem–loop II motif (PDB: 1XJR). RNAs were resolved for ∼6 h at 190 V on a 10% nondenaturing polyacrylamide gel in a running buffer containing 5 mM Mg2+. The gel was stained with Fast RNA stain.
Oligonucleotides were designed such that an RNA structure cassette was fused to the 3′-end of the respective RNA (Wilkinson et al. 2006). This 43-nucleotide (nt) extension contains two UUCG tetraloops which promote folding into stable hairpin structures that do not interfere with folding (Badorrek and Weeks 2005; Merino et al. 2005). Oligonucleotides (listed in the Supplemental Material) were ordered from IDT (Coralville, Iowa) and purified by electrophoresis on an 8% polyacrylamide/TBE/7 M urea gel, followed by ethanol precipitation. DNA transcription cassettes were prepared by PCR using Platinum Taq DNA polymerase (Invitrogen): The reaction contained in a total volume of 100 μL 200 pmol of each primer, 10 U (2 μL) Taq polymerase, 2 mM MgCl2, and 0.2 mM dNTPs. The DNA product was precipitated with ethanol, dried, and resuspended in 20 μL TE buffer.
RNAs were prepared by in vitro transcription using the Megashort Script kit from Ambion, purified on 8% acrylamide/TBE/7 M urea gels, and recovered by passive elution and ethanol precipitation. RNA was folded by heating in 10 mM Tris (pH 8), 100 mM KCl, and 0.1 mM EDTA for 3 min at 95°C, followed by snap cooling on ice. Folding buffer was then added to a final concentration of 40 mM Tris (pH 8), 5 mM MgCl2 (unless indicated otherwise), 0.2 mM EDTA, and 133 mM KCl, and the RNA was incubated at 37°C for 10 min. In the case of the group II self-splicing intron (PDB: 1KXK), experiments corresponding to MgCl2 concentrations of 0.3 mM, 0.6 mM, 1.3 mM, 2.5mM, 5mM, 7.5 mM, 10 mM, and 20 mM have been performed (see Supplemental Fig. S5). Proper folding was confirmed by native polyacrylamide gel electrophoresis (see Fig. 1). RNA was then separated into control (−) NMIA and (+) NMIA reactions. Samples were incubated with NMIA at concentrations indicated earlier at 37°C for 50 min, followed by ethanol precipitation. Modified RNA was analyzed by primer extension with SuperScript III (Invitrogen), using a 5′-[32P]-labeled DNA primer hybridized to the structure cassette at the 3′ terminus. Four sequencing reactions were performed in parallel using unmodified RNA and adding the respective dideoxynucleotides to the reaction mixture. To hydrolyze the RNA, each 20 μL reaction mixture was supplemented with 1 μL of 4 M NaOH and incubated at 95°C for 5 min. The reaction was then placed on ice, and 2 μL of 2 M Tris-HCl and 23 μL of formamide gel loading buffer were added. cDNA fragments were resolved on 5%–10% denaturing polyacrylamide sequencing gels. To obtain unequivocal assignment of bands, electrophoretic separation for each reaction mixture was performed with polyacrylamide gels of different concentration. Gels were dried and scanned by phosphorimaging (Typhoon Trio; GE Healthcare). The quantitative analysis of gels was performed with the software program SAFA (Das et al. 2005; Laederach et al. 2008).
Analysis of 3D structures
The base-pairing pattern of the RNA 3D structures obtained from the PDB were analyzed with the program FR3D (Sarver et al. 2008), which can detect and classify RNA base pairs, backbone conformations, base-phosphate interactions. and stacking interactions. Base pairs are classified according to the Leontis-Westhof scheme (Leontis and Westhof 2001). Base-phosphate interactions are based on a recently developed nomenclature (Zirbel et al. 2009). The FR3D analysis results of the seven RNA structures were downloaded from the FR3D web page (http://rna.bgsu.edu/FR3D/).
Data processing
The objective of the data processing was ultimately to convert the unprocessed SHAPE signals into per-residue probabilities that the respective RNA residues are single-stranded. Briefly, the main steps of the normalization method (implemented in R) are as follows: (1) subtraction of the control experiment data (the SHAPE experiment performed without NMIA) from the unnormalized data; (2) detection of outliers; (3) baseline correction; and (4) normalization of the data by dividing the signal values by the average of the data corresponding to the top 10% of signal values. This is analogous to a previously described data normalization procedure (Deigan et al. 2009) with the exception of a different baseline correction. Due to the relatively short length of the RNAs, no exponential decay correction was performed. We utilized existing software for baseline correction in the form of the R package PROcess (Li et al. 2005). The baseline correction determines what unprocessed SHAPE signals should correspond to “zero.” Simply taking the smallest signal value might lead to a biased normalization due to outlier signal values. Instead, the baseline correction method employed divides the number of signal values into regions of equal size. The minimum signal value is determined for each region. Next, a smoothed curve that interpolates between the different found minima is computed. This smoothed curve is the new zero-line and is subtracted from the data curve. We introduced this additional normalization step in order to automate all steps of SHAPE score normalization.
We used the FR3D software (Zirbel et al. 2009) to determine the reference base-pairing for each 3D structure, which allowed us to calculate quantities such as the Matthews correlation coefficient (MCC) of the SHAPE signal with respect to its reference base-pairing pattern. The MCC is defined as
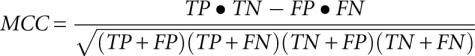 |
with TP, TN, FP, and FN being the number of true positives, true negatives, false positives, and false negatives, respectively. True positives are defined as all residue positions that have a normalized SHAPE score below a threshold and also participate in a base-pair interaction that involves a Watson-Crick edge on both base-pairing residues. The MCC depends on the chosen threshold; for each of the eight compared methods (see Table 3), the maximal achievable MCC values are reported. While “score” stands for the normalized SHAPE score, the probabilistic models developed in this study involve “training” (labeled Prob1, Prob2D, Prob2S, Prob25, Prob23, Prob3DS, and Prob353); the training set consists of six RNA structures such that the current RNA structure used for evaluating the prediction performance is not part of the training set (leave-one-out strategy, jackknifing).
TABLE 3.
Matthews correlation coefficient (MCC) of eight different approaches for predicting whether residues participate in cis-Watson-Crick/Watson-Crick base-pairing

The seven different probabilistic models utilize the normalized SHAPE score of the current residue and of zero, one, or two adjacent residues in order to provide a posterior probability of base-pairing for the current residue:
Prob1, one-dimensional Bayesian probability model using the SHAPE score of the current residue;
Prob2D, two-dimensional Bayesian probability model (use of a SHAPE score and the SHAPE score of the adjacent residue with the most different SHAPE score);
Prob2S, two-dimensional Bayesian probability model (use of a SHAPE score and the SHAPE score of an adjacent residue with the most similar SHAPE score);
Prob25, two-dimensional Bayesian probability model (use of a SHAPE score and the SHAPE score of the upstream adjacent residue);
Prob23, two-dimensional Bayesian probability model (use of a SHAPE score and the SHAPE score of the downstream adjacent residue);
Prob3DS, combination of Prob2D and Prob2S models (implemented as the product of the results obtained by the Prob2D and Prob2S models); and
Prob353, combination of Prob25 and Prob23 models (implemented as the product of the results obtained by the Prob25 and Prob23 models).
Probabilistic models corresponding to NMIA concentrations from 9–18 mM were generated in this fashion. For the BWYV frameshifting pseudoknot (PDB: 437D); SHAPE data for NMIA concentrations of 9 mM and 18 mM were used and interpolated to approximate the SHAPE experiment results corresponding to 13.5 mM NMIA. For all other RNAs, SHAPE data for three concentrations (9 mM, 13.5mM, 18 mM NMIA) were analyzed.
RESULTS
SHAPE experimental data were obtained for seven RNAs prepared by in vitro transcription, purified, and folded into the native structure as confirmed by nondenaturing PAGE (Fig. 1). Using the normalized SHAPE score for each nucleotide as an input parameter, we utilized both the VARNA (Darty et al. 2009) and RNAMLVIEW programs (Waugh et al. 2002) to generate the secondary structure diagrams shown in Figures 2 and 3. The color-coding illustrates posterior probabilities of cis-Watson-Crick/Watson-Crick base-pairing (cWW) as produced by the Prob23 model (Materials and Methods), where blue corresponds to high probabilities of base-pairing (low SHAPE scores) and red to low probabilities (high SHAPE scores). White corresponds to residues for which no SHAPE signal values were measured.
FIGURE 2.

Secondary structure of the (A) yeast group II self-splicing intron (PDB 1KXK), (B) BWYV frame shifting pseudoknot (PDB 437D), and (C) SARS stem–loop II motif (PDB 1XJR), color-coded according to SHAPE data. The color-coding is showing the posterior probabilities of cis-Watson-Crick/Watson-Crick base-pairing derived from SHAPE signal values, where blue values correspond to high probabilities (low SHAPE signals) and red values to low probabilities (high SHAPE signals). The probabilistic model was not applied to residues (shown in white) that correspond to the first and last residues for which SHAPE data are available. Residues for which no SHAPE signal values were measured are also shown in white.
FIGURE 3.

Secondary structure of (A) hepatitis delta virus ribozyme (PDB 1CX0), (B) hepatitis C virus IRES domain II (PDB 1P5O), (C) 7S.S SRP RNA (PDB 1Z43), and (D) of yeast tRNAASP (PDB 2TRA) colored according to SHAPE data. Color-coding is as described in the legend of Figure 2.
Probabilities of structural properties as a function of SHAPE signal
The FR3D software provides a set of per-residue structural properties such as base-pairing (12 cases according to the Leontis-Westhof nomenclature), stacking, and base-phosphate interactions. Each of these properties can be viewed as a structural feature that is either absent or present for a particular residue. For each of these features, we performed a statistical test (Wilcoxon rank sum test) to determine if the SHAPE scores of residues possessing this feature are unlikely to be from the same distribution compared to residues that do not possess this feature. Table 2 indicates that only a small number of structural features remain, the most significant being the cWW.
TABLE 2.
List of structural properties that show a correlation with SHAPE scores

To find additional features other than Watson-Crick base-pairing that independently influence NMIA reactivity, the data set is then divided into two subsets depending on whether the residues participate in Watson-Crick base-pairing or not. A Wilcoxon rank sum test is performed for SHAPE scores of each structural feature for both subsets individually. Table 2 suggests that very few structural properties influence the SHAPE scores if Watson-Crick base-pairing is taken into account. The only structural feature that remains significant for the set of residues that are not part of a cWW interaction is the s53 stacking interaction (P = 0.0036, Wilcoxon rank sum test) (see Table 2 row s53 [not cWW]). Nucleotide stacking interactions make an important contribution to the stability of an RNA structure. We follow the nomenclature of the FR3D software, and distinguish s35, s53, s33, and s55 interactions. This nomenclature is based on the convention of naming the two “flat” sides of the actual bases as either the “3” or the “5” side, depending on whether they are pointing toward the 5′ direction or the 3′ direction of the backbone part of that particular base. An s53 interaction, for example, indicates that the 5′ side of the base has a stacking interaction with the 3′ side of another base. The SHAPE scores of residues that do participate in cWW are on average slightly lower if they participate in one type of base-phosphate interaction designated H_9BPh (Table 2). This interaction corresponds to an H5 atom that is part of a C or U base interacting with a phosphate group (Zirbel et al. 2009). There are, however, only six cases with this type of base-phosphate interaction in our data set; it would be interesting to analyze larger data sets with respect to base-phosphate interactions and SHAPE scores.
It is straightforward, to generate for each structural property a (smoothed) histogram of SHAPE scores that were found for residues that exhibit these features. The case of cis-WW is shown in Figure 4. Also interesting is, however, the converse: Given a residue with an experimental SHAPE score, what is the likelihood that this residue possesses a structural feature? This is achieved using a Bayesian formalism (the equations are detailed in section 1 of the Supplemental Material). Briefly, the histograms of observed SHAPE scores are used for probability density estimations. Given the probability density of the SHAPE scores corresponding to residues that possess a feature and another probability density of SHAPE scores of residues that do not possess that feature, one can compute the probability (more precisely the Bayesian posterior probability) for a residue to possess that feature for a given SHAPE score. The results are shown for cWW in Figure 5 and for all examined structural features in the Supplemental Material. Only structural features that occur at least five times in the data set are examined. As expected, the probability of cWW is higher for SHAPE scores around 0.0 compared with SHAPE scores around 1.0. It should be noted, however, that the maximal obtained probability of cWW is ∼84% (at a nonprobabilistic SHAPE score of −0.2).
FIGURE 4.

Density estimation of SHAPE scores that do or do not participate in cis-Watson-Crick/Watson-Crick base-pairing. Narrow distribution indicates base-paired residues; broad distribution, non-base-paired residues.
FIGURE 5.

Bayesian posterior probability of cis-Watson-Crick/Watson-Crick base-pairing as a function of SHAPE score. Indicated in gray is a 95% confidence interval. The method for estimating the posterior probability as well as the confidence interval is described in the Supplemental Material (sections 1 and 2).
The analogous approach can be performed using the SHAPE scores of two adjacent residues. This leads to two-dimensional histograms, density estimations, and probability “landscapes.” For a given residue and its SHAPE score, which of the two adjacent neighboring residues should be chosen? We generated four different probabilistic models that depend on SHAPE scores of two adjacent residues (the models are called Prob2D, Prob2S, Prob25, and Prob23; see Materials and Methods). Figure 6 shows the posterior probability of cWW as a function of the SHAPE score of a residue and the SHAPE score of (1) its 5′ adjacent residue (Fig. 6, top, model Prob25) and (2) its 3′ adjacent residue (Fig. 6, bottom, model name Prob23).
FIGURE 6.

Bayesian posterior probability of cis-Watson-Crick/Watson-Crick base-pairing of a residue as a function of its SHAPE score and the SHAPE score of one adjacent residue. (Top) The upstream adjacent residue is chosen; (bottom) the downstream adjacent residue is chosen.
Given the SHAPE score of a residue and its 3′ adjacent neighbor, one can use, for example, the data in Figure 6 to determine the posterior probability of cWW. As apparent from the plot, the posterior probability of cWW is influenced not only by the SHAPE score of the current residue but also by the SHAPE score of its 3′ neighbor. Note that the dependence of the SHAPE score on the adjacent residue appears to be greater for the 3′ adjacent residue (Fig. 6, bottom) compared with the 5′ adjacent residue (Fig. 6, top).
Correlation of the SHAPE signal with base-pairing
Ultimately one wants to use the SHAPE signal as a classifier that determines if a particular nucleotide participates in base-pairing. Table 3 shows the MCCs for the individual RNA structures using nonprobabilistic SHAPE scores (column Score) as well as the probabilistic models (columns labeled with names starting with Prob). These results were obtained at an NMIA concentration of 18 mM. Data corresponding to NMIA concentrations of 9 mM and 13.5 mM are shown in the Supplemental Material (Supplemental Table S1).
The mean MCC is similar for the one-dimensional probabilistic model labeled Prob1 (0.55) (see Table 3). The two-dimensional models Prob23 (it utilizes the SHAPE score of a residue and the SHAPE score of its 3′ adjacent residue) has a mean MCC of 0.58. This represents an improvement compared to the direct use of normalized SHAPE scores, the P-value, however, is greater than a 0.05 significance level (P = 0.15, Wilcoxon signed rank test) (see Table 3, row labeled “P-value”). The probabilistic models Prob3DS and Prob353 utilize the SHAPE scores of the current residue and both adjacent neighbors in order to predict the base-pairing of the current residue (Materials and Methods). For those two models, one achieves a mean maximum MCC of 0.62 and a median of 0.68 and 0.67, respectively. This is a statistically significant improvement compared to the performance of the direct use of normalized SHAPE scores (P ≤ 0.04, Wilcoxon signed rank test) (see Table 3).
The maximal MCC uses information from the experimentally determined structure (leading to the optimal choice of a score cutoff). In the right half of Table 3, we show MCCs in which the cutoffs were chosen such that the amount of predicted base-pairing reaches a fixed fraction (chosen to be 61% base-pairing). The achieved correlations are significantly lower compared to the maximal achievable MCC values reported. The two-dimensional and 3D probabilistic models, however, still outperform the direct use of normalized SHAPE scores.
We analyzed to what extent the baseline correction method influenced the correlation of the normalized SHAPE signals with base-pairing. This was accomplished by generating results that did not rely on baseline correction (shown in Supplemental Table S2; they can be compared to the results that include base line correction [Supplemental Table S1, top]). We found that for none of the eight normalization methods is the difference in prediction accuracy statistically significant (Wilcoxon signed rank test).
We also looked at how an error in the initial SHAPE signal leads to a reduced correlation between the normalized SHAPE signal and cWW-type base-pairing. We found that a relative error of 10% in the original SHAPE signal leads to a mean maximal MCC of 0.55 when using the Prob23 model (compared to a mean MCC of 0.58 for the unperturbed SHAPE signal) (see Table 3).
In order to ascertain to what degree normalized SHAPE reactivities depend on the magnesium concentration, we performed SHAPE experiments on the group II self-splicing intron under magnesium concentrations from 0.3–20 mM. Supplemental Figure S5 shows a slight increase in NMIA reactivity with respect to magnesium concentration. The gel bands corresponding to positions 35–37 (thus corresponding to the apical GAAA tetraloop region), however, do not show a pronounced variation. The crystal structure contains a magnesium ion that binds the phosphate oxygen of G38 (Zhang and Doudna 2002). This suggests, that a high local structural stability implies a reduced dependency of the SHAPE experimental results on magnesium concentration. A plot showing the base-pair scores for different probabilistic models and for different magnesium concentrations is shown in Supplemental Figure S6. One can see, that the context-sensitive model (Supplemental Fig. S6b for model Prob23) exhibits a smaller dependency on the base-pair probabilities with respect to the magnesium concentrations compared to the noncontext sensitive model (Prob1). Also, the context-sensitive model shows less variability with respect to sequence position within both single-stranded and double-stranded regions.
DISCUSSION
The goal of this study was to identify structural features that ultimately determine the SHAPE experimental signal and to attempt to correlate its range with particular types of RNA interactions. We found that the median SHAPE signal is lowest for residues involved in base-pairing using the Watson-Crick edges of both interacting residues.
We find a statistical significance between s53 stacking interactions and SHAPE scores, even if the examined residues do not participate in cWW (Table 2, row s53 [not cWW]). Visual inspection of the 3D structures identified several cases in which the non-base-paired nucleotides that participate in a s53 stacking interaction are located adjacent (one residue downstream) to a regular RNA A-type double-helix. The observed s53 stacking interaction is then an interaction with the last terminal base pair of the adjacent helix. The median SHAPE scores of non-base-paired residues with such s53 stacking interactions are lower compared with the control set (cf. columns Median1 and Median2 in Table 3). Thus, s53 stacking interactions have a tendency to “extend” helices and “mimic” base-pairing. Constructing context-sensitive probabilistic models improves the prediction accuracy compared to individual SHAPE scores (Table 3), suggesting that considering the SHAPE score of a residue in combination with the SHAPE scores of the adjacent residues is a simple and efficient way to improve interpretation of SHAPE reactivities.
The advantage of context-sensitive probabilistic models becomes evident by comparing base-pair scores generated for different magnesium concentrations (Supplemental Fig. S6). It appears that the probabilistic models that take the SHAPE scores of residues into account are more “resilient” toward changes in experimental conditions such as changes in magnesium concentration. Base-pair scores generated by the context-sensitive model Prob23 also appear to be less “noisy” when comparing SHAPE scores of adjacent residues that are part of the same double helix. Lastly, the use of context-sensitive probabilistic models results in higher base-pair prediction accuracy (see Table 3). The success of this approach is likely to be in part due to an inherent quality of RNA structure: Base pairs within folded RNA structures usually do not occur in isolation, but are often part of A-type helices.
This underscores the context-sensitivity of SHAPE reactivities and provides a paradigm for future improved algorithms for SHAPE score normalization. Over time, a significant accumulation of SHAPE data (in conjunction with known RNA 3D structures) can be predicted. This should make it possible to generate higher-dimensional probabilistic models that consider larger sequence contexts of RNA nucleotides. It should also be emphasized that similar probabilistic models could be generated for similar RNA structure determination techniques, such as in-line probing (Regulski and Breaker 2008; Wakeman and Winkler 2009b). Such probabilistic models will aid the interpretation of RNA structure probing experiments and will ultimately lead to a deeper understanding of RNA structure.
We provide a user-friendly web server that aids in normalization of SHAPE data values. In the web form, the user can enter the SAFA-processed SHAPE signal values and choose between three different NMIA concentrations. After job submission, the web server returns a table with normalized SHAPE data values. The web server is available at the URL http://knetfold.abcc.ncifcrf.gov/rnashape/.
SUPPLEMENTAL MATERIAL
Supplemental material is available for this article.
ACKNOWLEDGMENTS
This work has been funded in whole or in part with federal funds from the National Cancer Institute, National Institutes of Health, under contract no. HHSN261200800001E. The content of this publication does not necessarily reflect the views or policies of the Department of Health and Human Services, nor does mention of trade names, commercial products, or organizations imply endorsement by the US Government. This research was supported in part by the Intramural Research Program of the NIH, National Cancer Institute, Center for Cancer Research. The funders had no role in study design, data collection and analysis, decision to publish, or preparation of the manuscript.
Footnotes
Article published online ahead of print. Article and publication date are at http://www.rnajournal.org/cgi/doi/10.1261/rna.2640111.
REFERENCES
- Badorrek CS, Weeks KM 2005. RNA flexibility in the dimerization domain of a gamma retrovirus. Nat Chem Biol 1: 104–111 [DOI] [PubMed] [Google Scholar]
- Darty K, Denise A, Ponty Y 2009. VARNA: Interactive drawing and editing of the RNA secondary structure. Bioinformatics 25: 1974–1975 [DOI] [PMC free article] [PubMed] [Google Scholar]
- Das R, Laederach A, Pearlman SM, Herschlag D, Altman RB 2005. SAFA: semi-automated footprinting analysis software for high-throughput quantification of nucleic acid footprinting experiments. RNA 11: 344–354 [DOI] [PMC free article] [PubMed] [Google Scholar]
- Deigan KE, Li TW, Mathews DH, Weeks KM 2009. Accurate SHAPE-directed RNA structure determination. Proc Natl Acad Sci 106: 97–102 [DOI] [PMC free article] [PubMed] [Google Scholar]
- Geissmann T, Marzi S, Romby P 2009. The role of mRNA structure in translational control in bacteria. RNA Biol 6: 153–160 [DOI] [PubMed] [Google Scholar]
- Laederach A, Das R, Vicens Q, Pearlman SM, Brenowitz M, Herschlag D, Altman RB 2008. Semiautomated and rapid quantification of nucleic acid footprinting and structure mapping experiments. Nat Protoc 3: 1395–1401 [DOI] [PMC free article] [PubMed] [Google Scholar]
- Legiewicz M, Zolotukhin AS, Pilkington GR, Purzycka KJ, Mitchell M, Uranishi H, Bear J, Pavlakis GN, Le Grice SF, Felber BK 2010. The RNA transport element of the murine musD retrotransposon requires long-range intramolecular interactions for function. J Biol Chem 285: 42097–42104 [DOI] [PMC free article] [PubMed] [Google Scholar]
- Leontis NB, Westhof E 2001. Geometric nomenclature and classification of RNA base pairs. RNA 7: 499–512 [DOI] [PMC free article] [PubMed] [Google Scholar]
- Li X, Gentleman R, Lu X, Shi Q, Iglehard JD, Harris L, Miron A 2005. SELDI-TOF Mass spectrometry protein data. In Bioinformatics and computational biology solutions using R and bioconductor (ed. Gentleman R et al.), pp. 91–108 Springer, New York [Google Scholar]
- Low JT, Weeks KM 2010. SHAPE-directed RNA secondary structure prediction. Methods 52: 150–158 [DOI] [PMC free article] [PubMed] [Google Scholar]
- Merino EJ, Wilkinson KA, Coughlan JL, Weeks KM 2005. RNA structure analysis at single nucleotide resolution by selective 2′-hydroxyl acylation and primer extension (SHAPE). J Am Chem Soc 127: 4223–4231 [DOI] [PubMed] [Google Scholar]
- Mortimer SA, Weeks KM 2007. A fast-acting reagent for accurate analysis of RNA secondary and tertiary structure by SHAPE chemistry. J Am Chem Soc 129: 4144–4145 [DOI] [PubMed] [Google Scholar]
- Nowotny M, Yang W 2009. Structural and functional modules in RNA interference. Curr Opin Struct Biol 19: 286–293 [DOI] [PMC free article] [PubMed] [Google Scholar]
- Regulski EE, Breaker RR 2008. In-line probing analysis of riboswitches. Methods Mol Biol 419: 53–67 [DOI] [PubMed] [Google Scholar]
- Sarver M, Zirbel CL, Stombaugh J, Mokdad A, Leontis NB 2008. FR3D: finding local and composite recurrent structural motifs in RNA 3D structures. J Math Biol 56: 215–252 [DOI] [PMC free article] [PubMed] [Google Scholar]
- Scott WG, Martick M, Chi YI 2009 Structure and function of regulatory RNA elements: ribozymes that regulate gene expression. Biochim Biophys Acta 1789: 634–641 [DOI] [PubMed] [Google Scholar]
- Serganov A, Patel DJ 2007. Ribozymes, riboswitches and beyond: regulation of gene expression without proteins. Nat Rev Genet 8: 776–790 [DOI] [PMC free article] [PubMed] [Google Scholar]
- Tullius TD, Dombroski BA 1985. Iron(II) EDTA used to measure the helical twist along any DNA molecule. Science 230: 679–681 [DOI] [PubMed] [Google Scholar]
- Tullius TD, Greenbaum JA 2005. Mapping nucleic acid structure by hydroxyl radical cleavage. Curr Opin Chem Biol 9: 127–134 [DOI] [PubMed] [Google Scholar]
- Turner KB, Yi-Brunozzi HY, Brinson RG, Marino JP, Fabris D, Le Grice SF 2009. SHAMS: combining chemical modification of RNA with mass spectrometry to examine polypurine tract-containing RNA/DNA hybrids. RNA 15: 1605–1613 [DOI] [PMC free article] [PubMed] [Google Scholar]
- Vasa SM, Guex N, Wilkinson KA, Weeks KM, Giddings MC 2008. ShapeFinder: a software system for high-throughput quantitative analysis of nucleic acid reactivity information resolved by capillary electrophoresis. RNA 14: 1979–1990 [DOI] [PMC free article] [PubMed] [Google Scholar]
- Wakeman CA, Winkler WC 2009a. Analysis of the RNA backbone: structural analysis of riboswitches by in-line probing and selective 2′-hydroxyl acylation and primer extension. Methods Mol Biol 540: 173–191 [DOI] [PubMed] [Google Scholar]
- Wakeman CA, Winkler WC 2009b. Structural probing techniques on natural aptamers. Methods Mol Biol 535: 115–133 [DOI] [PubMed] [Google Scholar]
- Watts JM, Dang KK, Gorelick RJ, Leonard CW, Bess JW Jr, Swanstrom R, Burch CL, Weeks KM 2009. Architecture and secondary structure of an entire HIV-1 RNA genome. Nature 460: 711–716 [DOI] [PMC free article] [PubMed] [Google Scholar]
- Waugh A, Gendron P, Altman R, Brown JW, Case D, Gautheret D, Harvey SC, Leontis N, Westbrook J, Westhof E, et al. 2002. RNAML: a standard syntax for exchanging RNA information. RNA 8: 707–717 [DOI] [PMC free article] [PubMed] [Google Scholar]
- Wilkinson KA, Merino EJ, Weeks KM 2006. Selective 2′-hydroxyl acylation analyzed by primer extension (SHAPE): quantitative RNA structure analysis at single nucleotide resolution. Nat Protoc 1: 1610–1616 [DOI] [PubMed] [Google Scholar]
- Wilkinson KA, Gorelick RJ, Vasa SM, Guex N, Rein A, Mathews DH, Giddings MC, Weeks KM 2008. High-throughput SHAPE analysis reveals structures in HIV-1 genomic RNA strongly conserved across distinct biological states. PLoS Biol 6: e96 doi: 10.1371/journal.pbio.0060096 [DOI] [PMC free article] [PubMed] [Google Scholar]
- Zhang L, Doudna JA 2002. Structural insights into group II intron catalysis and branch-site selection. Science 295: 2084–2088 [DOI] [PubMed] [Google Scholar]
- Zirbel CL, Sponer JE, Sponer J, Stombaugh J, Leontis NB 2009. Classification and energetics of the base-phosphate interactions in RNA. Nucleic Acids Res 37: 4898–4918 [DOI] [PMC free article] [PubMed] [Google Scholar]